. 2021 May 21;49(9):5393-5406.
doi: 10.1093/nar/gkab253.

Topologies of synthetic gene circuit for optimal fold change activation

Affiliations

Topologies of synthetic gene circuit for optimal fold change activation

Phyana Litovco et al. Nucleic Acids Res. .

Abstract

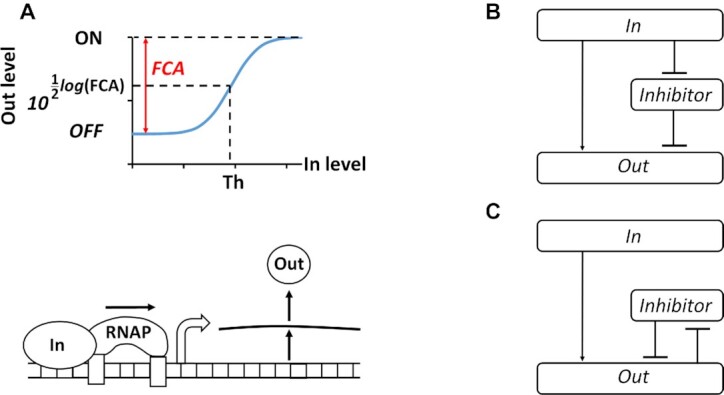
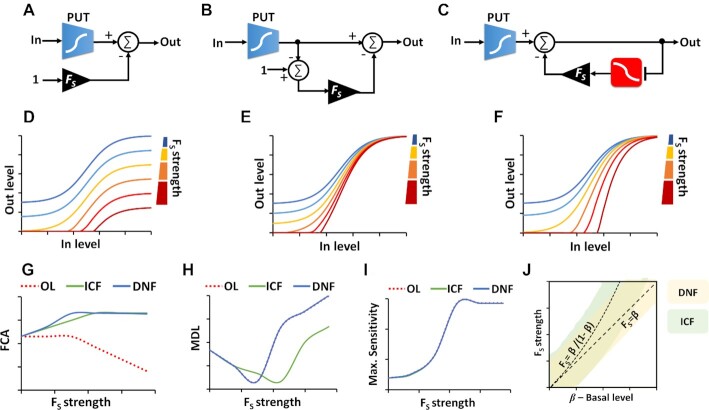
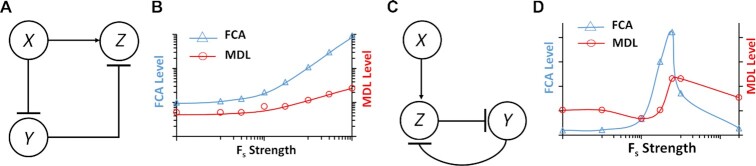
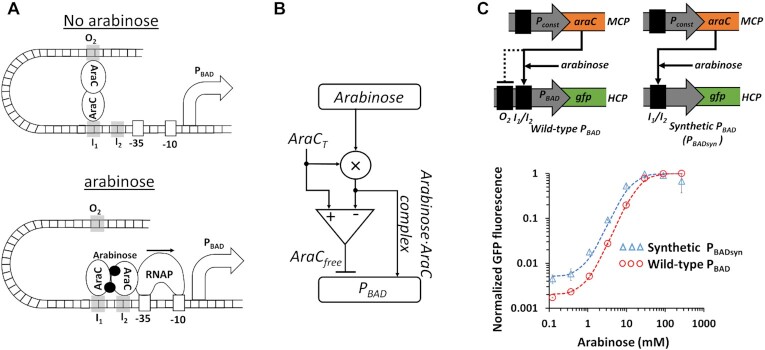
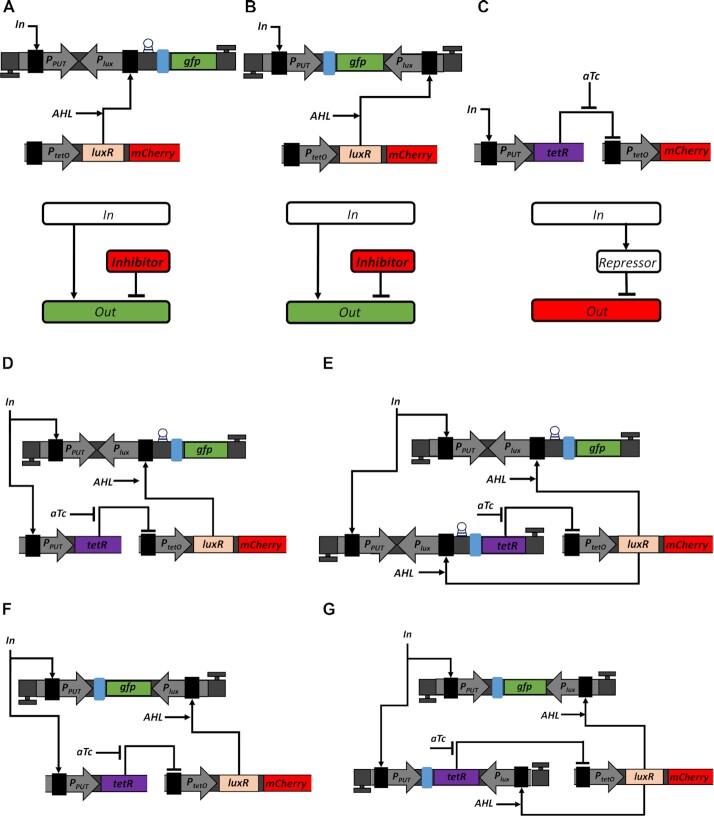
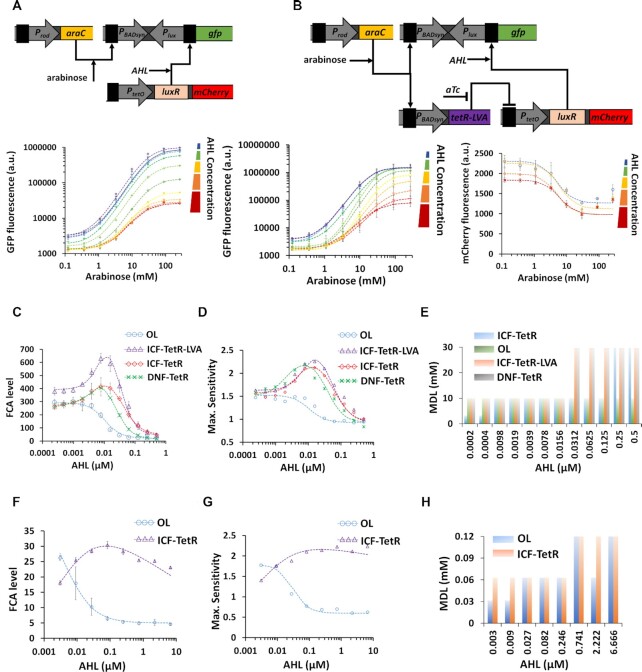
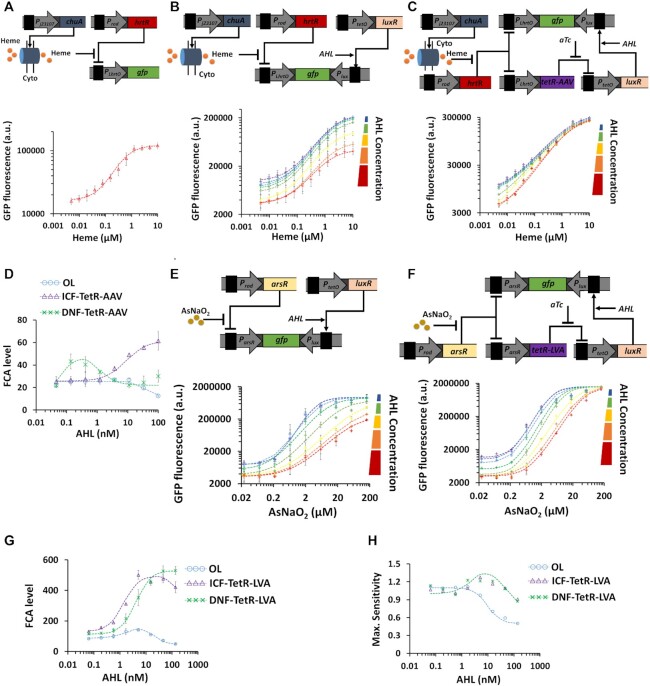
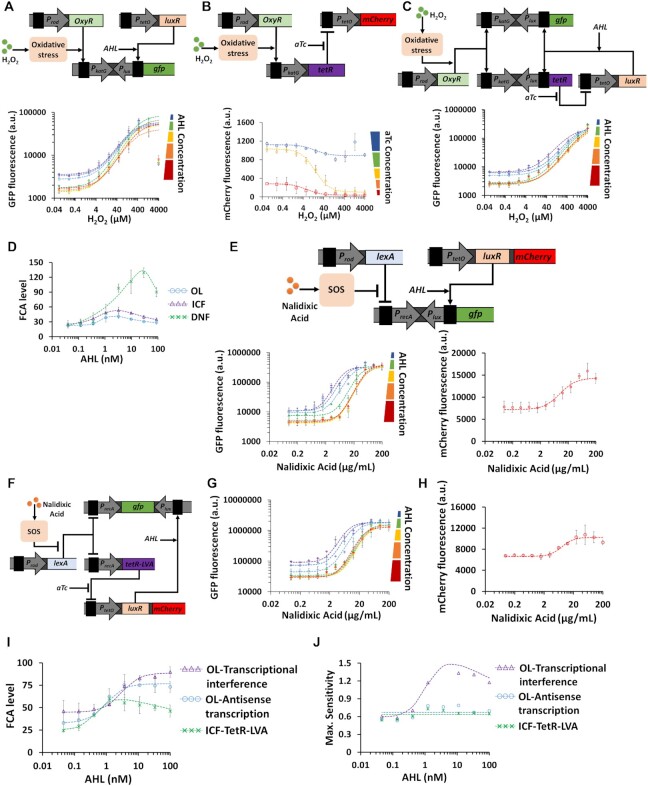
Computations widely exist in biological systems for functional regulations. Recently, incoherent feedforward loop and integral feedback controller have been implemented into Escherichia coli to achieve a robust adaptation. Here, we demonstrate that an indirect coherent feedforward loop and mutual inhibition designs can experimentally improve the fold change of promoters, by reducing the basal level while keeping the maximum activity high. We applied both designs to six different promoters in E. coli, starting with synthetic inducible promoters as a proof-of-principle. Then, we examined native promoters that are either functionally specific or systemically involved in complex pathways such as oxidative stress and SOS response. Both designs include a cascade having a repressor and a construct of either transcriptional interference or antisense transcription. In all six promoters, an improvement of up to ten times in the fold change activation was observed. Theoretically, our unitless models show that when regulation strength matches promoter basal level, an optimal fold change can be achieved. We expect that this methodology can be applied in various biological systems for biotechnology and therapeutic applications.


Figures

Figure 1.
Figure 1.
Fold change activation (FCA) and block diagrams for ICF and DNF designs. (A) Describes the transfer function of promoter activity (Supplementary Figure S1A). FCA is the ratio between ON and OFF states of the promoter. The OFF state is the minimum activity of the promoter and is achieved when no input molecules are present and there is only leaky gene expression (basal level) due to the unspecific binding of RNA polymerases (RNAPs). The ON state is the maximum activity of the promoter. ‘Th’ is the input threshold of genetic switches and equals to half of FCA on the logarithmic scale. (B) Schematic diagram of the indirect coherent feedforward (ICF) circuit. Input molecules regulate both the inhibitor and the output level. (C) Schematic diagram of the mutual inhibition through double negative feedback (DNF) circuit. A positive feedback between the inhibitor and the output is coupled through mutual repression.
Figure 2.
Figure 2.
Linear models for ICF and DNF designs. (A) Block diagram for the open loop (OL) circuit. The part under test (PUT) has a non-linear monotonic function with two distinct levels: (i) normalized minimum level- β (e.g. basal level of promoter activity) and (ii) normalized maximum level ‘1’. The output of the OL circuit is obtained by subtracting Fs from the output of the PUT. The connecting node has two inputs. One with a positive sign that is connected directly to the output of the PUT target circuit, and the second is with a negative sign that is connected to a constant ‘1’ through a gain of Fs. (B) Block diagram for the indirect coherent feedforward (ICF) circuit. The output of the PUT is split into two branches that both positively regulate the circuit output. The difference between the two branches determines the circuit output. The first branch is directly connected to circuit output and the second branch includes a two-stage subtraction with a gain of Fs. (C) Block diagram for the mutual inhibition through double negative feedback (DNF) circuit. The output of the PUT is regulated through a negative feedback loop formed by an inverter (e.g. repressor) with gain of Fs. (D) Simulation results of the OL circuit. (E) Simulation results of the ICF circuit. (F) Simulation results of the DNF circuit. (G) FCA level versus Fs strength for OL, ICF and DNF circuits. (H) Minimum detection level (MDL) versus Fs strength for OL, ICF and DNF circuits. MDL is defined as the input level when the sensitivity is maximum. (I) Maximum sensitivity versus Fs strength for OL, ICF and DNF circuits. The sensitivity is calculated at every input point, based on formula image. (J) Qualitative β – FS diagrams for ICF and DNF designs. The area marked in light green corresponds to maximal FCA and the area marked in light yellow corresponds to minimal MDL. Outside of these areas, the FCA and MDL are not optimal.
Figure 3.
Figure 3.
Models for ICF and DNF circuits based on biochemical reactions. (A) Schematic diagram for molecular ICF network. Molecule Z is activated by molecule X and repressed by molecule Y, which is activated by X. (B) Simulation results of FCA and MDL for molecular ICF circuit. (C) Schematic diagram for molecular DNF circuit. Similar to the ICF, but here the molecule Z also represses Y. (D) Simulation results of FCA and MDL for the molecular DNF circuit. Simulation parameters: β = 0.1, α = 10, n = 1.5, m = 1, h = 1.
Figure 4.
Figure 4.
ICF design describes l-arabinose utilization system. (A) The structure of PBAD promoter in l-arabinose utilization system. In the absence of arabinose, a loop between O2 and I2 binding sites is formed through AraC, which prevents RNA polymerase from accessing the promoter. When arabinose is present, the loop is released and AraC binds to I1 and I2 sites. This leads to RNA polymerase (RNAP) binding to DNA sites (-35, -10) and the initiation of transcription. (B) A diagram model for AraC and PBAD promoter showing that the system resembles an ICF network. On the one hand, the arabinose acts as an input to activate the PBAD by forming arabinose–AraC complex. On the other hand, the free AraC represses the PBAD promoter and is equal to the total concentration of AraC (AraCT) minus the arabinose-AraC complex concentration. (C) The measured transfer function of wild-type PBAD and synthetic PBAD (PBADsyn). The synthetic PBADsyn contains only I1 and I2 binding sites without O2 DNA sites. AraC is expressed by a constitutive promoter, encoded on a medium-copy-number plasmid (MCP). The synthetic PBADsyn and wild-type PBAD promoters regulate green fluorescent protein (GFP), encoded on a high-copy-number plasmid (HCP). The dotted lines are Hill function fittings. All experimental data are averaged from three experiments.
Figure 5.
Figure 5.
Implementation of ICF and DNF designs in living cells. (A) Utilization of transcriptional interference to mimic subtraction. The PPUT activates GFP signal. The Plux reverse promoter is located opposite to PPUT and upstream to gfp gene repressing GFP signal. The first unidirectional terminator is in the same orientation as PPUT and downstream to gfp gene. The second unidirectional terminator is in the same orientation as Plux and upstream to PPUT. The terminator is represented by a highlighted letter T. The RBS is marked by a blue rectangle. The riboj sequence is inserted upstream of the RBS which is marked by a circle (59). The LuxR transcription activator and mCherry are expressed under PtetO promoter, encoded on MCP. When no TetR is expressed, PtetO acts as a constitutive promoter. Both LuxR and mCherry genes have their own RBS sequences. The unit Terminator_RC-PPUT-Plux_RC-GFP-Terminator is encoded on HCP. The block diagram describes the operation of OL circuit, where the output is regulated both by the input and inhibitor. (B) Utilizing antisense transcription to mimic subtraction. The Plux promoter is oriented in reverse to PPUT and downstream to gfp gene repressing GFP signal. The first unidirectional terminator was placed in the same orientation to PPUT and downstream to gfp gene. The second unidirectional terminator was placed in the same orientation to Plux and upstream to PPUT. The LuxR activator and mCherry are expressed by PtetO promoter encoded on MCP. Both LuxR and mCherry genes have their own RBS sequences. The unit Terminator_RC-PPUT-GFP-Plux_RC-Terminator is encoded on HCP. The block diagram describes the operation of OL, where both input and inhibitor regulate the output level. (C) Implementation of an inverting switch using TetR repressor. The PPUT controls the expression of TetR, which represses the activity of PtetO. The small molecule aTc binds TetR to release the repression of PtetO. The PtetO-mCherry-Terminator construct was placed on MCP, while the PPUT-TetR-Terminator construct was cloned on LCP in order to match their copy numbers in ICF and DNF circuits. The mCherry gene was further replaced by LuxR gene to be integrated in ICF and DNF circuits. The block diagram describes the operation of an inverting switch circuit. (D) Implementation of ICF circuit by combining a transcriptional interference unit with TetR inverting switch. Here TetR is controlled only by PPUT. (E) Implementation of a DNF circuit by combining transcriptional interference unit with TetR inverting switch. Here TetR is controlled by both PPUT and Plux promoters. (F) Implementation of ICF circuit by combining an antisense transcription unit with TetR inverting switch. Here TetR is controlled only by PPUT. (G) Implementation of a DNF circuit by combining an antisense transcription with TetR inverting switch. Here TetR is controlled by both promoters PPUT and Plux.
Figure 6.
Figure 6.
Transcriptional interference- based ICF and DNF topologies for synthetic PBADsyn and PlacO inducible promoters. (A) Experimentally measured arabinose-GFP transfer function for the synthetic PBADsyn-based OL circuit as a function of AHL concentration. (B) Experimentally measured arabinose-GFP and arabinose-mCherry transfer functions for the synthetic PBADsyn-based ICF circuit (TetR is fused with a LVA degradation tag) for various AHL concentrations. (CE) FCA levels, Maximum sensitivity level and MDL for different synthetic PBADsyn-based circuits (OL, ICF, DNF) versus AHL concentrations derived from experimental data. (FH) FCA levels, Maximum sensitivity level and MDL for different PlacO-based circuits (OL, ICF) versus AHL concentration derived from experimental data provided in Supplementary Information, Section 3.2 (Supplementary Figure S19). The dotted lines are fittings using Hill-functions (formula image). All experimental data are averaged from three experiments. The flow cytometry data for this figure is provided in Supplementary Information, Supplementary Figures S25–S38.
Figure 7.
Figure 7.
ICF and DNF topologies for specific bacterial biosensors sensitive to heme and arsenic (AsNaO2) based on antisense transcription. (A) Blood sensor operation. Experimentally measured heme-GFP transfer function of a blood sensing circuit in the simplest (wild-type) design. Transporter proteins are constitutively expressed from ChuA gene. HrtR is a repressor and is driven by a constitutive promoter. A heme-group containing molecule enters the bacterial cells through the outer membrane ChuA protein and binds the transcriptional repressor HrtR to form a heme-HrtR complex which is then released from PLhrtO heme-inducible promoter allowing its activation and GFP expression. (B) Experimentally measured heme-GFP transfer function of PLhrtO-based OL circuit relative to AHL concentration. (C) The measured heme-GFP transfer function of PLhrtO based ICF circuit (TetR is fused with a AAV degradation tag) relative to AHL concentration. (D) FCA levels derived from experimental results for various blood sensor circuits (OL, ICF, DNF) as a function of AHL concentration. (E) Arsenic sensor circuit with inducible antisense transcription. The transcription factor ArsR encoded by arsR gene is constitutively expressed to repress ParsR promoter. Arsenic input, AsNaO2, can bind with ArsR to release the repression on ParsR, to produce a GFP signal. A reverse Plux is located downstream of gfp gene to induce antisense transcription. The induction of antisense transcription is controlled by varying AHL concentrations. Experimentally measured arsenic-GFP transfer function of ParsR-based OL circuit under various AHL concentrations. (F) Experimentally measured arsenic-GFP transfer function of ParsR-based ICF circuit (TetR is fused with a LVA degradation tag) under various AHL concentrations. (G) and (H) FCA levels, Maximum sensitivity derived from experimental results for various arsenic sensor circuits (OL, ICF, DNF) under various AHL concentrations. The dotted lines are fittings using Hill-functions (formula image). All experimental data represent the average of three experiments. The flow cytometry data for this figure is provided in Supplementary Information, Supplementary Figures S39-S53.
Figure 8.
Figure 8.
ICF and DNF designs for systemic bacterial biosensors based on oxidative stress response and SOS response. (A) OL circuit based on antisense transcription for the katG biosensor inducible by hydrogen peroxide (H2O2). H2O2 interacts with the transcription factor OxyR causing a conformational change to its structure which in turn activates through a series of oxidative stress responses the PkatG promoter enabling GFP expression. OxyR is constitutively expressed. A reverse promoter, Plux, is placed downstream of PkatG as a transcriptional interference component, the strength of which can be programmed using AHL concentration. The experimentally measured H2O2-GFP transfer function of PkatG-based OL circuit under various AHL concentrations is also shown. (B) Experimentally measured H2O2-mCherry transfer function of the inverting switch using TetR repressor. The PkatG promoter controls the expression of TetR, which represses the activity of PtetO. The small molecule, aTc, inhibits the activity of TetR. (C) Experimentally measured H2O2-GFP transfer function of the PkatG-based DNF circuit under various AHL concentrations. (D) FCA levels derived from experimental results for different katG biosensor circuits (OL, ICF, DNF) across AHL concentrations. (E) OL circuit based on transcriptional interference for recA biosensor activated by Nalidixic Acid. The LexA repressor inhibits the activity of PrecA promoter, and Nalidixic Acid induces a series of SOS responses that inhibit the LexA activity. PrecA drives GFP expression and LexA is constitutively expressed. A reverse promoter, Plux, is placed downstream of PrecA as a transcriptional interference component, the strength of which can be programmed using AHL concentration. The experimentally measured Nalidixic Acid-GFP transfer function of PrecA-based OL circuit under various AHL concentrations, as well as the Nalidixic Acid-mCherry transfer function of PtetO in the absence of TetR are also shown. (F) Experimentally measured Nalidixic Acid -GFP transfer function of PrecA-based ICF circuit (TetR is fused with a LVA degradation tag) using antisense transcription under AHL concentrations. The measured Nalidixic Acid -mCherry transfer function of PrecA-based ICF circuit is shown. (G) and (H) show FCA levels, Maximum sensitivity derived from experimental results for the OL and ICF circuits of recA biosensor across AHL concentrations. The dotted lines are fittings using Hill-functions (formula image). All experimental data represent the average of three experiments. The flow cytometry data for this figure is provided in Supplementary Information, Supplementary Figures S54–S63.

Similar articles

Cited by

References

    1. Adler M., Alon U.. Fold-change detection in biological systems. Curr. Opin. Syst. Biol. 2018; 8:81–89.
    1. Adler M., Szekely P., Mayo A., Adler M., Szekely P., Mayo A., Alon U.. Optimal regulatory circuit topologies for fold-change detection. Cell Syst. 2017; 4:171–181. - PubMed
    1. Alon U., Surette M.G., Barkai N., Leibler S.. Robustness in bacterial chemotaxis. Nature. 1999; 397:168–171. - PubMed
    1. Ferrell J.E. Previews signaling motifs and Weber’s law. Mol. Cell. 2009; 36:724–727. - PubMed
    1. Hicks M., Bachmann T.T., Wang B.. Synthetic biology enables programmable cell-based biosensors. ChemPhysChem. 2020; 21:132–144. - PMC - PubMed

Publication types

LinkOut - more resources