. 2021 Dec 15;224(12):2073-2084.
doi: 10.1093/infdis/jiab274.

Anti-PD-L1 Therapy Does Not Improve Survival in a Murine Model of Lethal Staphylococcus aureus Pneumonia

Affiliations

Anti-PD-L1 Therapy Does Not Improve Survival in a Murine Model of Lethal Staphylococcus aureus Pneumonia

Colleen S Curran et al. J Infect Dis. .

Abstract

Background: Staphylococcus aureus (SA) bacterial pneumonia is a common cause of sepsis in intensive care units. Immune checkpoint inhibitors (CPIs) that target programmed cell death protein 1 (PD-1) and its ligand (PD-L1) have been proposed for the treatment of sepsis. However, in our systematic review of sepsis preclinical models, none of the models examined CPIs in pneumonia.

Methods: Mice were inoculated intratracheally with vehicle control, low dose (LD)- or high dose (HD)-SA. Immune cell recruitment and checkpoint molecule expression were examined at 4, 24, and 48 hours after infection. Infected animals, treated with control or anti-PD-L1 antibodies, were assessed for survival, bacterial burden, lung immunophenotypes, and mediator production.

Results: LD-SA and HD-SA produced lethality of 15% and 70%, respectively, by 168 hours. At 24 hours, LD-infected animals exhibited increased lung monocyte PD-L1 expression (P = .0002) but lower bacterial counts (P = .0002) compared with HD animals. By 48 hours, either infection induced lung neutrophil and macrophage PD-L1 expression (P < .0001). Anti-PD-L1 treatment at the time of infection and at 24 hours following infection with low to high doses of SA reduced PD-L1 detection but did not affect survival or bacterial clearance.

Conclusions: Anti-PD-L1 therapy did not alter survival in this pneumonia model. Preclinical studies of additional common pathogens and septic foci are needed.

Keywords: Staphylococcus aureus; immunotherapy; pneumonia; sepsis.


Figures

Figure 1.
Figure 1.
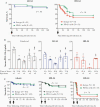
Effect of Staphylococcus aureus (SA) infection on mortality and lung bacterial counts. A, Kaplan–Meier survival curves of C57BL/6 mice infected with low-dose (LD) SA (4.5 × 109 colony-forming units [CFU]/kg intratracheally) or high-dose (HD) SA (7 × 109 CFU/kg intratracheally) are displayed. n = 20 animals per group. B, Lung bacterial counts are charted at the indicated timepoints. Each colored symbol represents an individual animal. Means ± standard error are displayed. HD vs LD 24 hours, P = .0002; §LD 24 hours and LD 48 hours vs LD 4 hours, P ≤ .005; HD 48 hours vs HD 4 hours, P < .0001; n ≥ 2 animals per group.
Figure 2.
Figure 2.
Immune cell checkpoint molecule expression in response to low-dose (LD) and high-dose (HD) Staphylococcus aureus infection. At the identified time point, lungs were harvested and processed into single-cell suspensions. Live cells and intraparenchymal CD45+ cells were gated for subsets (see Supplementary Figure 1 for gating strategy here and throughout). A, Programmed cell death protein 1 (PD-1) or programmed death ligand 1 (PD-L1) median fluorescence intensity (MFI) is normalized by subtracting the respective isotype MFI. Each colored symbol represents an individual animal. Means ± standard error are displayed. n = 5 or 6 animals per time point for HD over 4 experiments, and n = 9 animals per time point for LD experiments over 3 experiments. A, Myeloid PD-L1 MFI: *Control vs LD, P ≤ .02; Control vs HD, P < .0001; HD vs LD, P = .0002. B and C, T-cell PD-L1 MFI (B) and T-cell PD-1 MFI (C): *Control vs LD, P < .01; Control vs HD, P ≤ .004; HD vs LD, P ≤ .04.
Figure 3.
Figure 3.
Serum cytokine analysis from animals challenged with saline control, low-dose (LD) Staphylococcus aureus (SA), or high-dose (HD) SA at the indicated times. Serum cytokines and chemokines were measured at 4, 24, or 48 hours after challenge with saline control, LD-SA, or HD-SA. Log10 changes in serum cytokine levels compared to control are plotted in each panel for the indicated cytokines tested at the indicated timepoints. Mean differences ± standard error are displayed. Data are from 8 LD experiments and 8 HD experiments. n = 15–19 animals per time point for LD and n = 13–22 animals per time point for HD. *Control vs LD, P ≤ .04; Control vs HD, P ≤ .01; HD vs LD, P ≤ .04. Abbreviations: HD, high-dose; IFN, interferon; IL, interleukin; KC, keratinocyte-derived chemokine; LD, low-dose; MCP, monocyte chemoattractant protein; MIP, macrophage inflammatory protein.
Figure 4.
Figure 4.
Survival and pharmacokinetics of anti-programmed death ligand 1 (PD-L1) monoclonal antibodies (mAb) in Staphylococcus aureus (SA) infection. A, Kaplan–Meier survival curves are displayed for animals treated with 1 dose of PD-L1 mAb at the time of infection (T0) and infected with low-dose (LD) SA (4.5 × 109 colony-forming units [CFU]/kg; n = 23/group), or high-dose (HD) SA (7 × 109 CFU/kg; n = 24/group). Arrows below the x-axis indicate the time of PD-L1 mAb administration. Twenty survivors of 23 total controls (87%) vs 20 of 23 (87%) PD-L1 mAb animals in LD-SA (P = .90) and 11 of 24 (46%) controls vs 13 of 24 (54%) PD-L1 mAb animals in HD-SA (P = .34). B, Mice were treated with either 1 dose (×1) at T0 or 2 doses (×2) at T0 and 24 hours after infection (T24) of PD-L1 mAb. At the indicated time points (time of draw), serum was assessed for circulating PD-L1 mAb levels from mice challenged with saline control (uninfected), LD-SA (4.5 × 109 CFU/kg), or HD-SA (7 × 109 CFU/kg) SA; n = 1–3/time point per treatment. Each colored symbol represents an individual animal. Means ± standard error are displayed. Conditions were grouped for statistical analysis. *Four hours (×1) vs 24 hours (×1), P = .0009; 4 hours (×1) vs 48 hours (×1), P < .0001; 48 hours (×1) vs 48 hours (×2), P = .0006; and §48 hours (×1) vs 72 hours (×2), P = .002. C, Kaplan–Meier survival curves are displayed for animals treated with 2 doses of PD-L1 mAb at T0 and T24 and infected with LD-SA (4.5 × 109 CFU/kg; n = 102), medium dose (MD-SA: 7.0 × 109 CFU/kg; n = 23–24), or HD-SA (9.0 × 109 CFU/kg; n = 18). Arrows on the x-axis indicate the time of PD-L1 mAb administration.
Figure 5.
Figure 5.
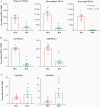
Immune cell checkpoint molecule expression in high-dose Staphylococcus aureus (HD-SA)–infected mice treated with anti-programmed death ligand 1 (PD-L1) monoclonal antibodies (mAb). Mice were infected with HD-SA (8.5 × 109 colony-forming units/kg intractracheally) and treated with 300 μg isotype or PD-L1 mAb intraperitoneally at the time of infection and 24 hours later. At 48 hours following infection, lungs were harvested and processed into single-cell suspensions. Live cells and intraparenchymal CD45+ cells were gated for subsets, and the median fluorescence intensity (MFI) was generated for PD-L1 or programmed cell death protein 1 (PD-1). The PD-L1 and PD-1 MFIs are normalized by subtracting the respective isotype MFI. Each colored symbol represents an individual animal. Means ± standard error are displayed; n = 7 animals/group over 2 experiments. A, Myeloid PD-L1 MFI: *Isotype vs anti–PD-L1, P ≤ .0005. B, T-cell PD-L1 MFI: *Isotype vs anti–PD-L1, P ≤ .0001. C, T-cell PD-1 MFI: *Isotype vs anti–PD-1, P = .046.
Figure 6.
Figure 6.
Bronchoalveolar lavage (BAL) cell counts and lung histology in high-dose Staphylococcus aureus (HD-SA)–infected mice treated with anti-programmed death ligand 1 (PD-L1) monoclonal antibodies (mAb). Mice were infected with HD-SA (8.5 × 109 colony-forming units/kg intratracheally) and treated with 300 μg isotype or PD-L1 mAb intraperitoneally at the time of infection and 24 hours later. A, At 48 hours following infection, lungs were lavaged and the fluid was assessed for complete blood counts with differentials. Each colored symbol represents an individual animal. Means ± standard error (SE) are displayed; n = 7 or 8 animals/group, 1 experiment. *Isotype vs PD-L1 mAb, P ≤ .045. B, At 48 hours following infection, mean ± SE blinded pathology hematoxylin and eosin and TUNEL-stained scores were assessed; n = 8. *Alveolar fibrin, P = .04; *Neutrophils (PMNs) per high-power field (HPF), P = .04; and *Apoptotic TUNEL-stained cells per HPF, P = .054 (Mann–Whitney test).

Similar articles

Cited by

References

    1. van Vught LA, Klein Klouwenberg PM, Spitoni C, et al. . MARS Consortium . Incidence, risk factors, and attributable mortality of secondary infections in the intensive care unit after admission for sepsis. JAMA 2016; 315:1469–79. - PubMed
    1. Jin HT, Ahmed R, Okazaki T. Role of PD-1 in regulating T-cell immunity. Curr Top Microbiol Immunol 2011; 350:17–37. - PubMed
    1. Huang X, Venet F, Wang YL, et al. . PD-1 expression by macrophages plays a pathologic role in altering microbial clearance and the innate inflammatory response to sepsis. Proc Natl Acad Sci U S A 2009; 106:6303–8. - PMC - PubMed
    1. Latchman YE, Liang SC, Wu Y, et al. . PD-L1-deficient mice show that PD-L1 on T cells, antigen-presenting cells, and host tissues negatively regulates T cells. Proc Natl Acad Sci U S A 2004; 101:10691–6. - PMC - PubMed
    1. Kinter AL, Godbout EJ, McNally JP, et al. . The common gamma-chain cytokines IL-2, IL-7, IL-15, and IL-21 induce the expression of programmed death-1 and its ligands. J Immunol 2008; 181:6738–46. - PubMed

Publication types

MeSH terms