

MRI in head and neck cancer following chemoradiotherapy: what is the optimal delay to demonstrate maximal response?
- PMID: 34009413
- PMCID: PMC8589821
- DOI: 10.1007/s00330-021-07913-x
MRI in head and neck cancer following chemoradiotherapy: what is the optimal delay to demonstrate maximal response?
Abstract
Objectives: To investigate the optimal timing for post-chemoradiotherapy (CRT) reference magnetic resonance imaging (MRI) in head and neck cancer, so as to demonstrate a maximal treatment response. To assess whether this differs in human papillomavirus-related oropharyngeal cancer (HPV-OPC) and whether the MRI timing impacts on the ability to predict treatment success.
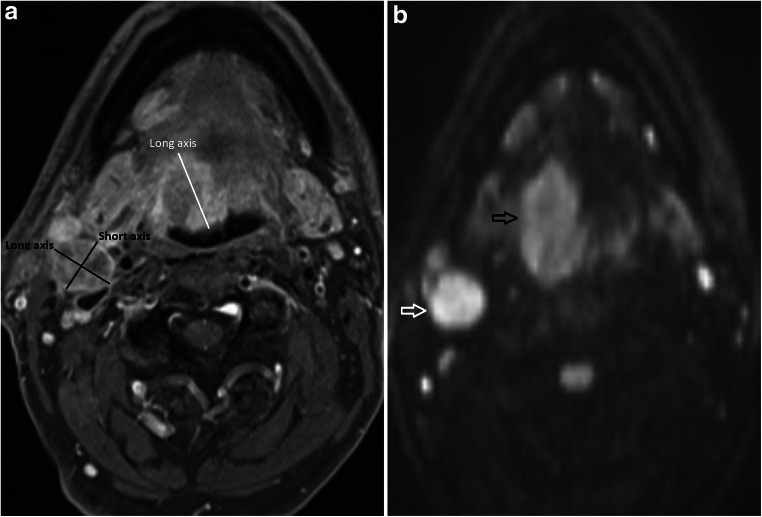
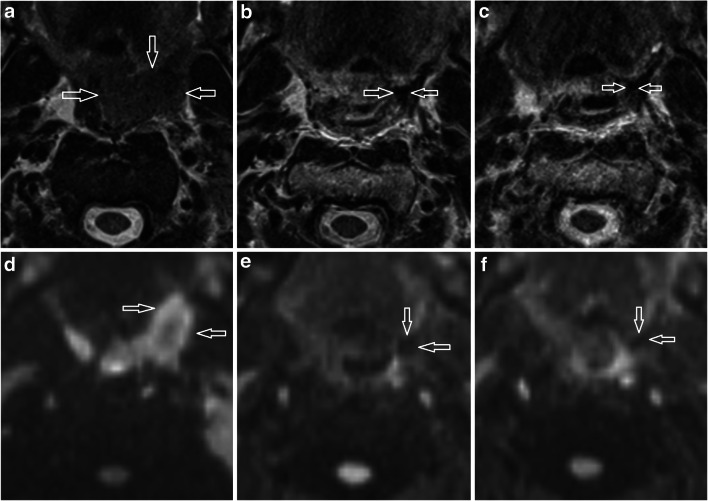
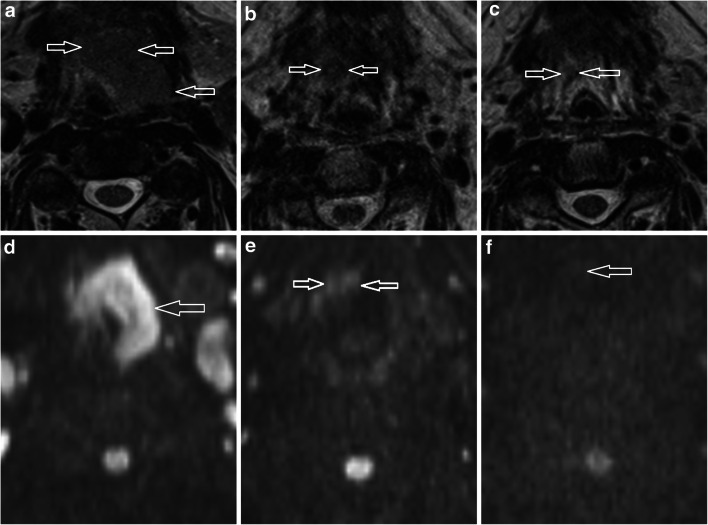
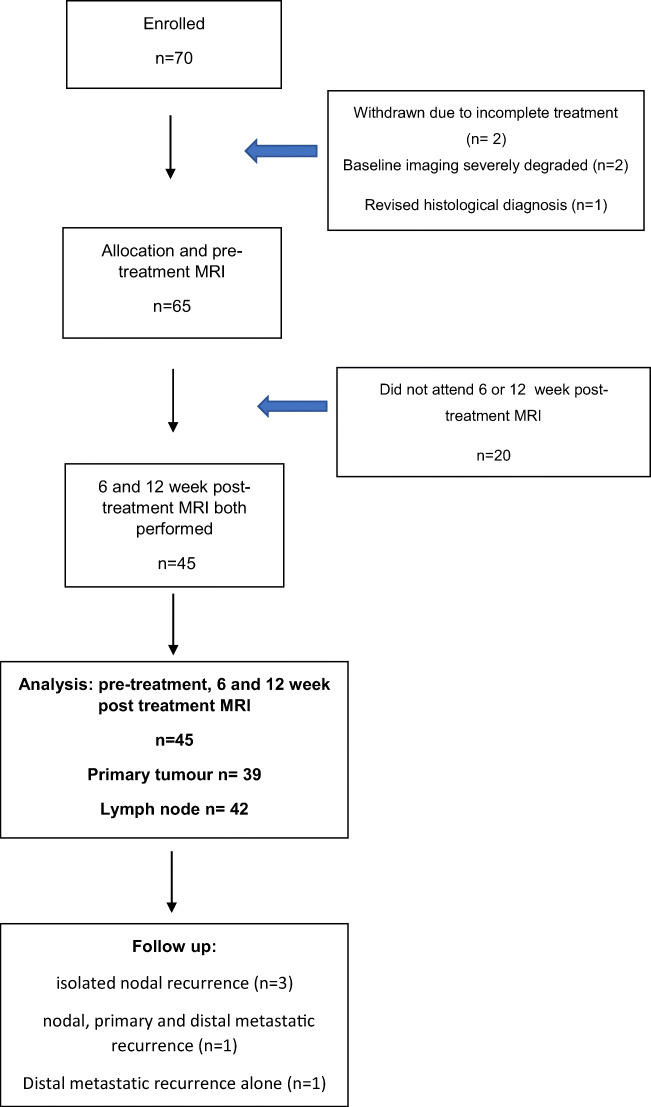
Methods: Following ethical approval and informed consent, 45 patients (40 male, mean age 59.7 ± 7.9 years, 33 HPV-OPC) with stage 3 and 4 HNSCC underwent pre-treatment, 6- and 12-week post-CRT MRIs in this prospective cohort study. Primary tumour (n = 39) size, T2w morphology and diffusion weight imaging (DWI) scores, together with nodal (n = 42) size and necrotic/cystic change, were recorded. Interval imaging changes were analysed for all patients and according to HPV-OPC status. MRI descriptors and their interval changes were also compared with 2-year progression-free survival (PFS).
Results: All MRI descriptors significantly changed between pre-treatment and 6-week post-treatment MRI studies (p < .001). Primary tumour and nodal volume decreased between 6- and 12-week studies; however, interval changes in linear dimensions were only evident for HPV-OPC lymph nodes. Nodal necrosis scores also evolved after 6 weeks but other descriptors were stable. The 6-week nodal necrosis score and the 6- and 12-week nodal volume were predictive of 2-year PFS.
Conclusion: Apart from HPV-OPC patients with nodal disease, the 6-week post-CRT MRI demonstrates maximal reduction in the linear dimensions of head and neck cancer; however, a later reference study should be considered if volumetric analysis is applied.
Key points: • This study provides guidance on when early post-treatment imaging should be performed in head and neck cancer following chemoradiotherapy, in order to aid subsequent detection of recurrent tumour. • Lymph nodes in HPV-related oropharyngeal cancer patients clearly reduced in size from 6 to 12 weeks post-treatment. However, other lymph node disease and all primary tumours showed only a minor reduction in size beyond 6 weeks, and this required a detailed volumetric analysis for demonstration. • Timing of the reference MRI following chemoradiotherapy for head and neck cancer depends on whether the patient has HPV-related oropharyngeal cancer and whether there is nodal disease. MRI as early as 6 weeks post-treatment may be performed unless volumetric analysis is routinely performed.
Keywords: Chemoradiotherapy; Diffusion magnetic resonance imaging; Human papillomavirus; Squamous cell carcinoma of head and neck; Treatment outcome.
© 2021. Crown.
Conflict of interest statement
The authors of this manuscript declare no relationships with any companies whose products or services may be related to the subject matter of the article.
Figures
Similar articles
-
The ability of post-chemoradiotherapy DWI ADCmean and 18F-FDG SUVmax to predict treatment outcomes in head and neck cancer: impact of human papilloma virus oropharyngeal cancer status.J Cancer Res Clin Oncol. 2021 Aug;147(8):2323-2336. doi: 10.1007/s00432-021-03662-y. Epub 2021 Jun 22. J Cancer Res Clin Oncol. 2021. PMID: 34159420 Free PMC article.
-
The impact of Human Papilloma Virus status on the prediction of head and neck cancer chemoradiotherapy outcomes using the pre-treatment apparent diffusion coefficient.Br J Radiol. 2022 Feb 1;95(1130):20210333. doi: 10.1259/bjr.20210333. Epub 2021 Dec 20. Br J Radiol. 2022. PMID: 34111977 Free PMC article.
-
Apparent diffusion coefficient agreement and reliability using different region of interest methods for the evaluation of head and neck cancer post chemo-radiotherapy.Dentomaxillofac Radiol. 2021 Oct 1;50(7):20200579. doi: 10.1259/dmfr.20200579. Epub 2021 May 6. Dentomaxillofac Radiol. 2021. PMID: 33956510 Free PMC article.
-
Survival outcomes for head and neck cancer patients with N3 cervical nodal metastases.Clin Otolaryngol. 2020 May;45(3):342-349. doi: 10.1111/coa.13501. Epub 2020 Feb 20. Clin Otolaryngol. 2020. PMID: 31869000
-
Nutritional Support in Head and Neck Radiotherapy Patients Considering HPV Status.Nutrients. 2020 Dec 27;13(1):57. doi: 10.3390/nu13010057. Nutrients. 2020. PMID: 33375430 Free PMC article. Review.
Cited by
-
Imaging of human papilloma virus associated oropharyngeal squamous cell carcinoma and its impact on diagnosis, prognostication, and response assessment.Br J Radiol. 2022 Sep 1;95(1138):20220149. doi: 10.1259/bjr.20220149. Epub 2022 Jun 28. Br J Radiol. 2022. PMID: 35687667 Free PMC article. Review.
References
-
- Million RR, Cassis NJ. Oral cavity. In: Million RR, Cassisi NJ, editors. Management of head and neck cancer: a multidisciplinary approach. 2. Philadelphia: Lippincott; 1994. pp. 239–298.
MeSH terms
Grants and funding
LinkOut - more resources
Full Text Sources
Other Literature Sources
Medical
Research Materials
