. 2022 Jan 20;34(1):302-332.
doi: 10.1093/plcell/koab135.

A nanodomain-anchored scaffolding complex is required for the function and localization of phosphatidylinositol 4-kinase alpha in plants

Affiliations

A nanodomain-anchored scaffolding complex is required for the function and localization of phosphatidylinositol 4-kinase alpha in plants

Lise C Noack et al. Plant Cell. .

Abstract

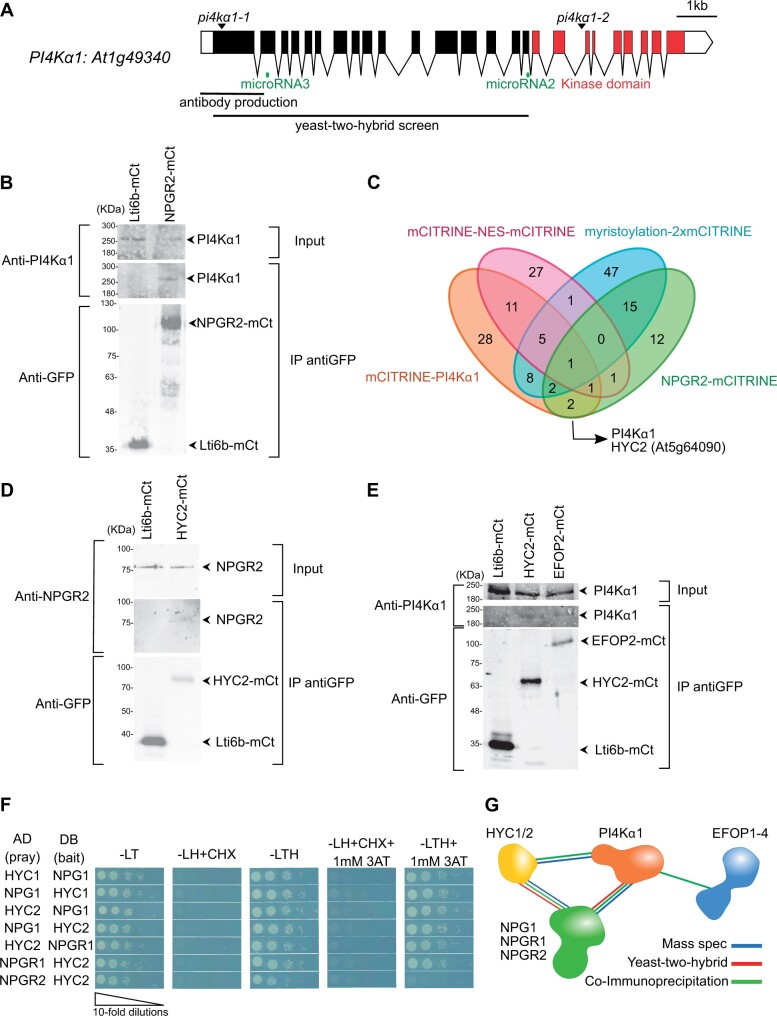
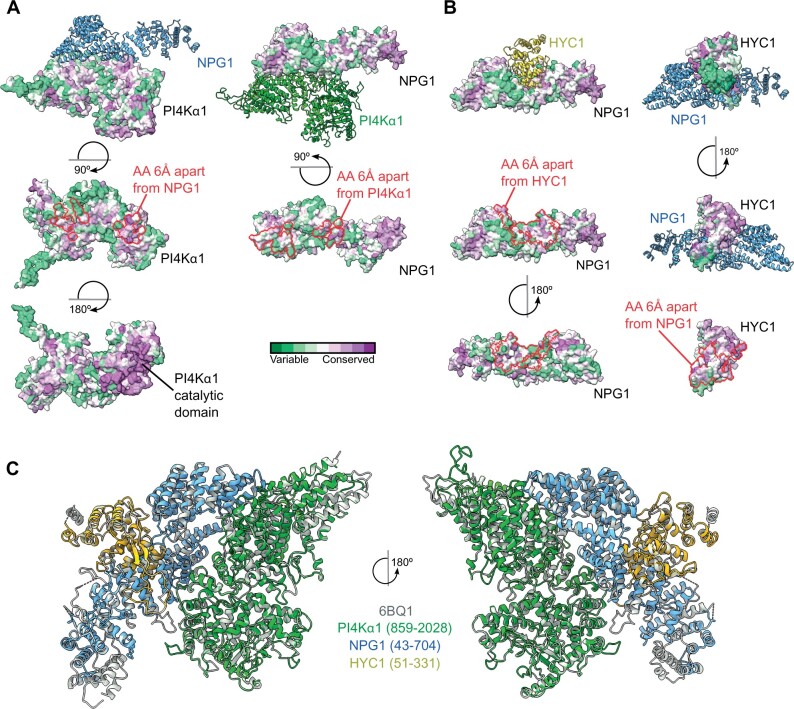
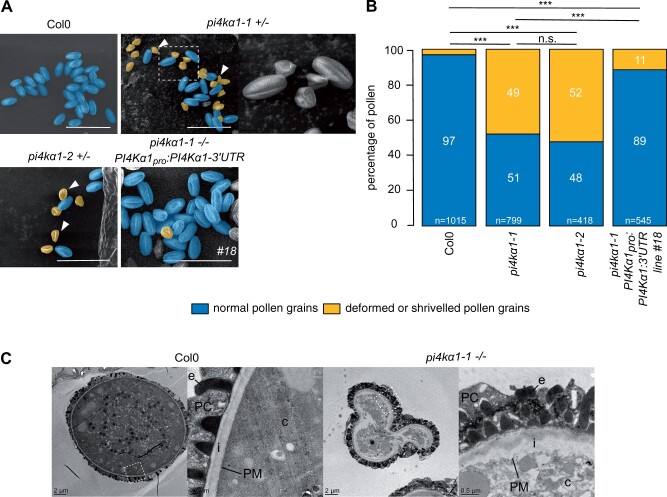
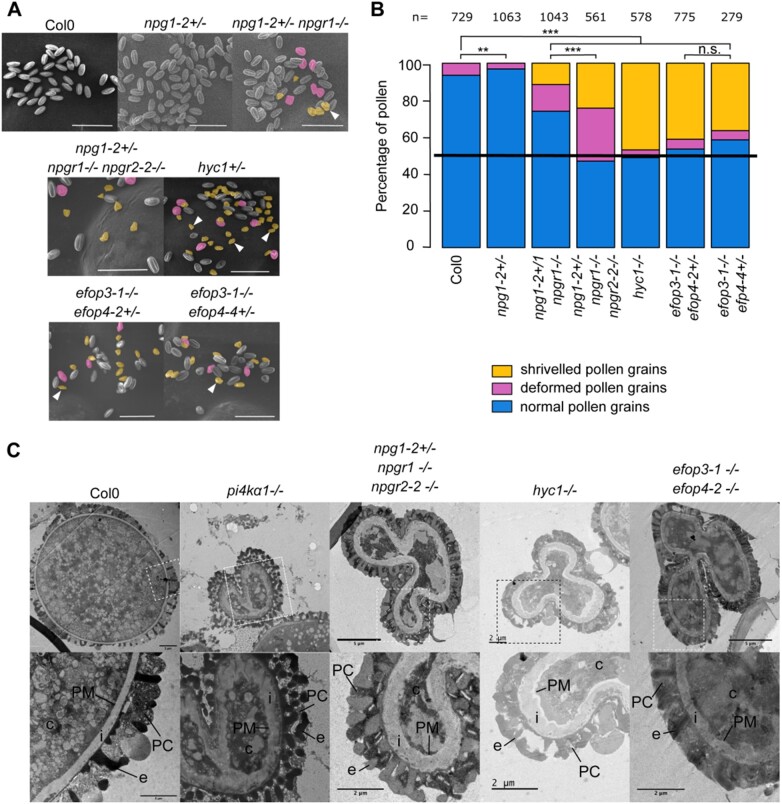
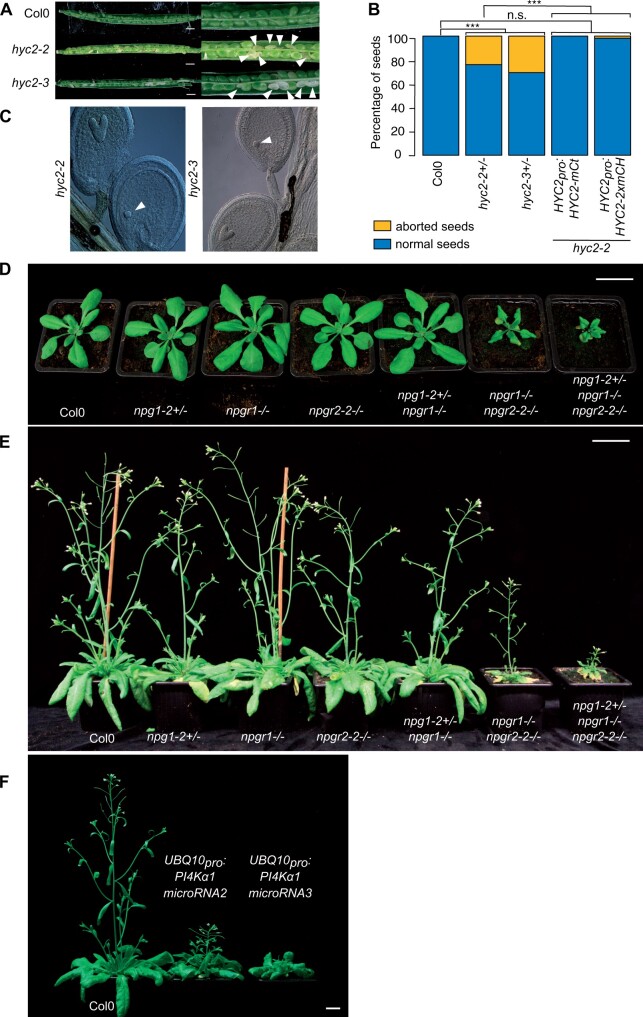
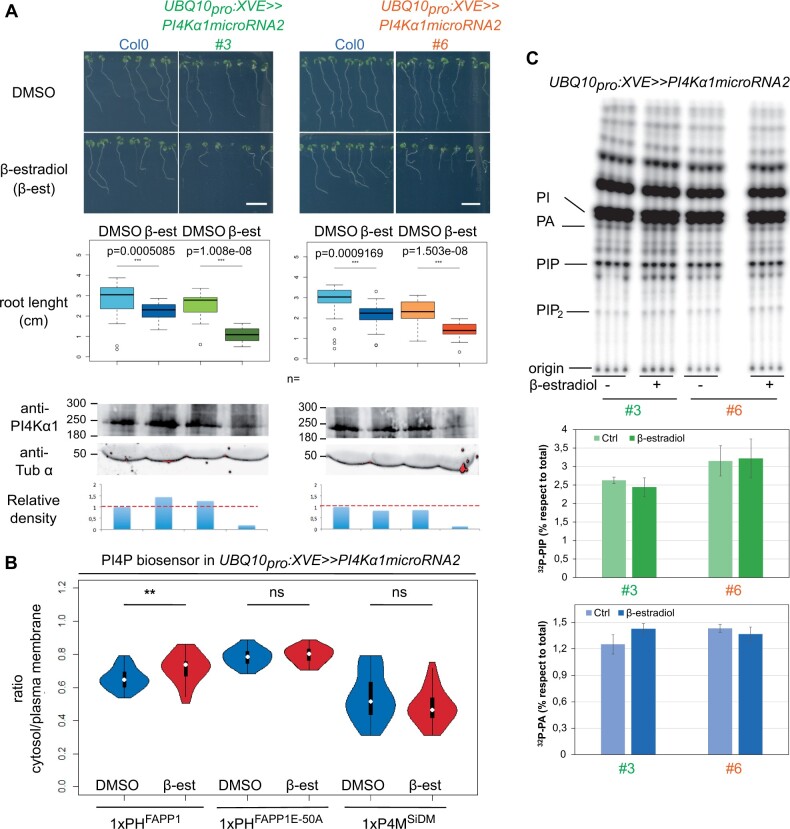
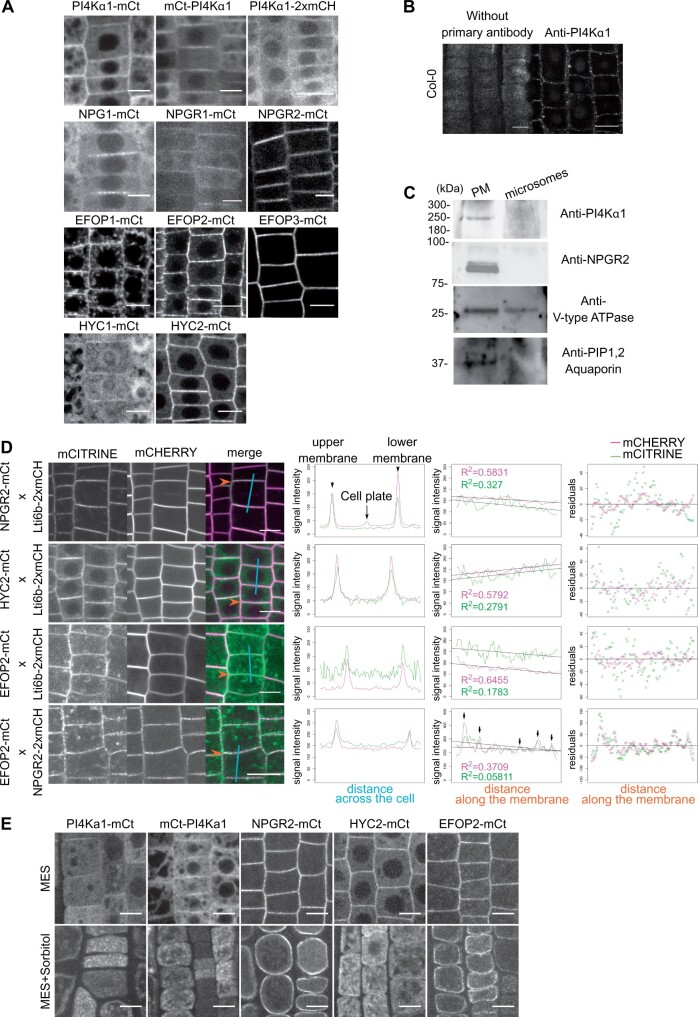
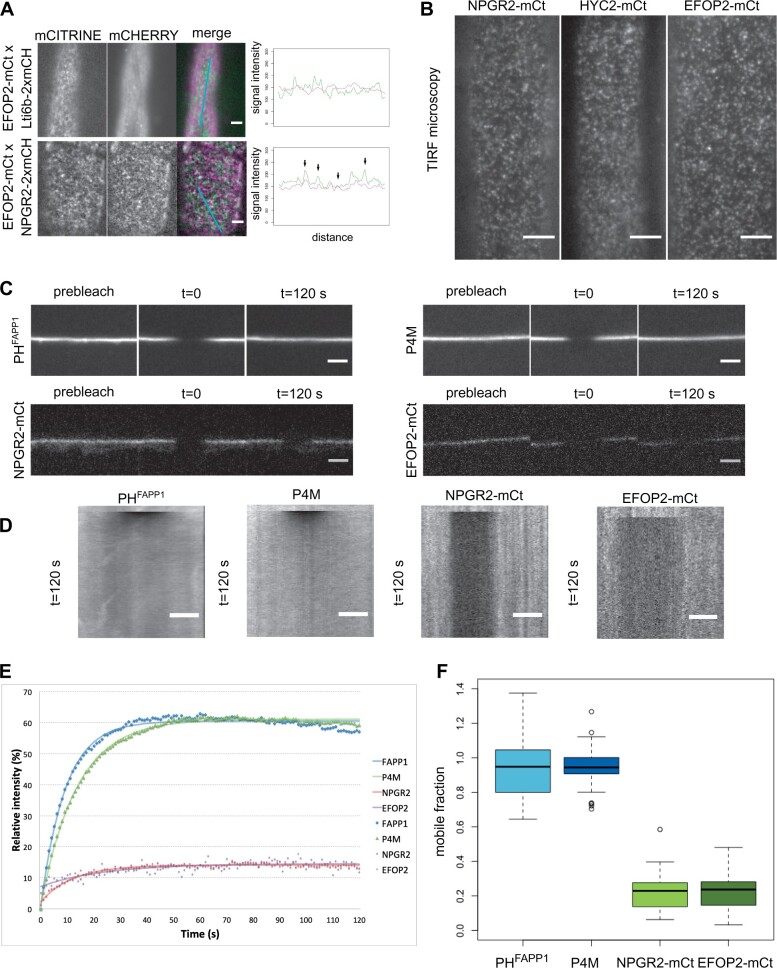
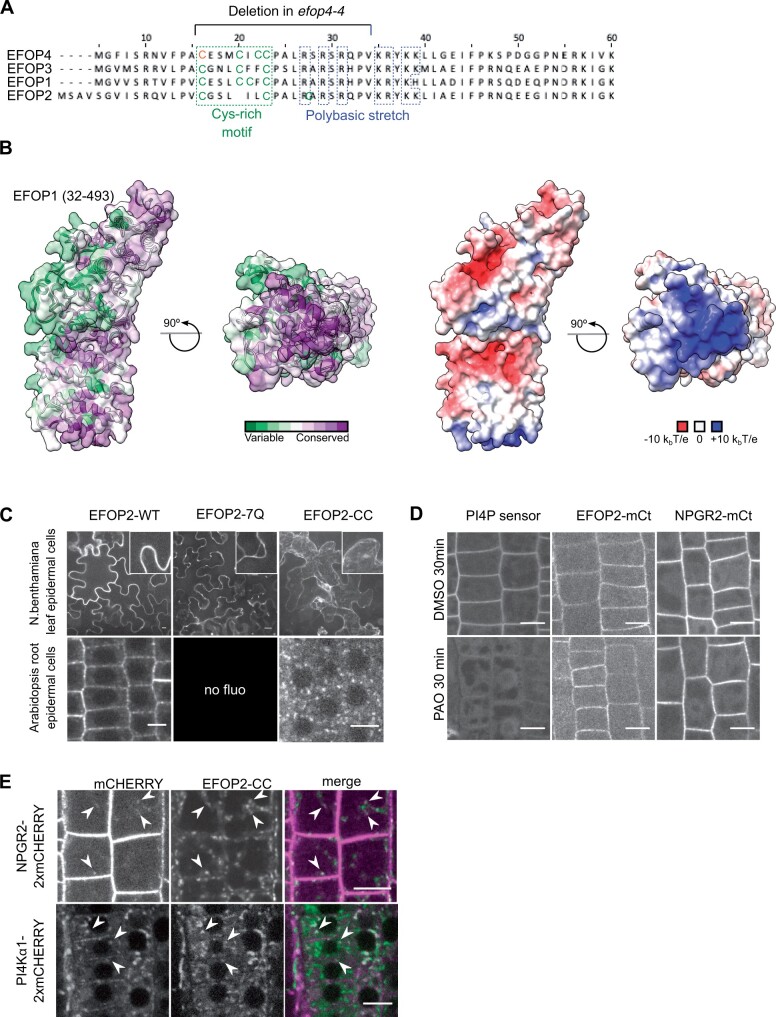
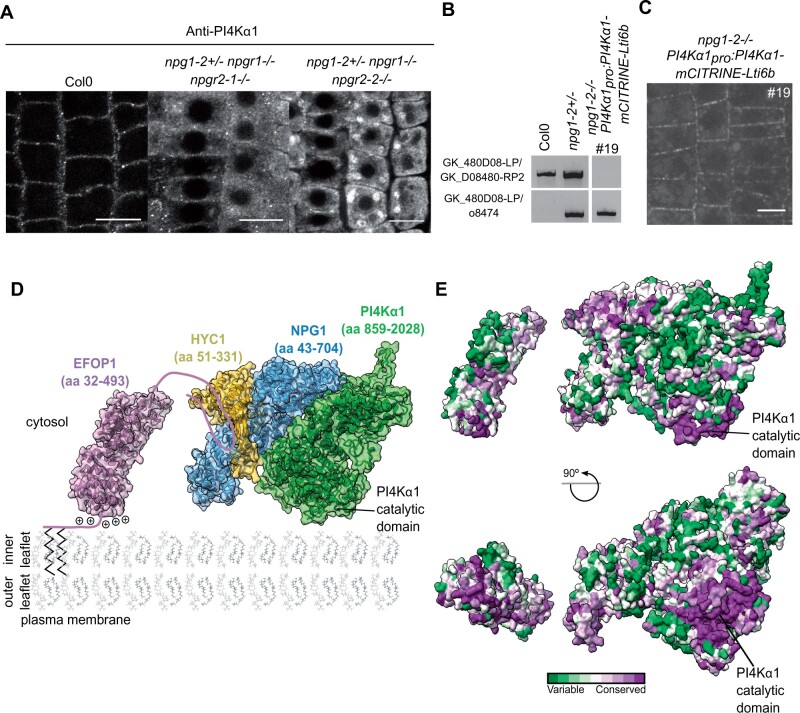
Phosphoinositides are low-abundant lipids that participate in the acquisition of membrane identity through their spatiotemporal enrichment in specific compartments. Phosphatidylinositol 4-phosphate (PI4P) accumulates at the plant plasma membrane driving its high electrostatic potential, and thereby facilitating interactions with polybasic regions of proteins. PI4Kα1 has been suggested to produce PI4P at the plasma membrane, but how it is recruited to this compartment is unknown. Here, we pin-point the mechanism that tethers Arabidopsis thaliana phosphatidylinositol 4-kinase alpha1 (PI4Kα1) to the plasma membrane via a nanodomain-anchored scaffolding complex. We established that PI4Kα1 is part of a complex composed of proteins from the NO-POLLEN-GERMINATION, EFR3-OF-PLANTS, and HYCCIN-CONTAINING families. Comprehensive knockout and knockdown strategies revealed that subunits of the PI4Kα1 complex are essential for pollen, embryonic, and post-embryonic development. We further found that the PI4Kα1 complex is immobilized in plasma membrane nanodomains. Using synthetic mis-targeting strategies, we demonstrate that a combination of lipid anchoring and scaffolding localizes PI4Kα1 to the plasma membrane, which is essential for its function. Together, this work opens perspectives on the mechanisms and function of plasma membrane nanopatterning by lipid kinases.


Figures

Figure 1
Figure 1
PI4Kα1 interacts with proteins from the NPG, HYC, and EFOP families. A, Schematic representation of PI4Kα1 (At1g49340) gene. Boxes and lines represent exons and introns, respectively. The kinase domain is shown in red. The T-DNA positions of the pi4kα1-1 and pi4kα1-2 alleles are indicated. Parts of the protein used for the yeast-two-hybrid screen and the antibody production are also shown. The regions targeted by microRNA#2 and #3 are indicated in green. B, Co-IP of PI4Kα1 with NPGR2. Arabidopsis transgenic plants overexpressing NPGR2–mCITRINE (NPGR2–mCt) or Lti6b–mCITRINE (Lti6b–mCt) were used for IP using anti-GFP beads. Immunoblots used anti-PI4Kα1 (upper) and anti-GFP (lower). C, Venn diagram of proteins identified by mass spectrometry from IP of mCITRINE–PI4Kα1, NPGR2–mCITRINE, mCITRINE–NES–mCITRINE, and myristoylation–2x-mCITRINE. D, Co-IP of NPGR2 with HYC2. Arabidopsis transgenic plants overexpressing HYC2–mCITRINE (HYC2-mCt) or Lti6b–mCITRINE were used for IP using anti-GFP beads. Immunoblots used anti-GFP (lower) and anti-NPGR2 (upper). E, Co-IP of PI4Kα1 with EFOP2 and HYC2. Arabidopsis transgenic plants overexpressing EFOP2–mCITRINE (EFOP2–mCt), HYC2–mCITRINE, or Lti6b–mCITRINE were used for IP using anti-GFP beads. Immunoblots used anti-PI4Kα1 (upper) or anti-GFP (lower). F, Yeast-two hybrid assay of HYC1 with NPG1, HYC2 with NPG1 or NPGR1 and NPGR2. Indicated combinations of interactions between HYCCIN-CONTAINING and NPG proteins were assessed by growth on plates with yeast growth media lacking Leu, Trp, and His (-LTH). Yeast growth on plates lacking Leu and Trp (-LT) shows the presence of the bait and prey vectors. The absence of growth when cycloheximide was added (+CHX) shows the absence of auto-activation of the DB vectors. The addition of 3-amino-1,2,4-triazol (+3AT) shows the strength of the interaction. G, Summary of experiments showing interactions among PI4Kα1, NPG, HYC, and EFOP2 proteins.
Figure 2.
Figure 2.
Template-based modeling and protein–protein docking suggest that the plant PI4Kα1 forms a stable heterotrimeric complex. A, Heterodimer formed by PI4Kα1 (green) and NPG1 (blue) as calculated by a hybrid docking approach using the HDOCK algorithm. Analysis of conserved amino acid residues was performed utilizing the Consurf server and mapped on the solvent-excluded surface of each protein. Calculated protein–protein interfaces indicated by red lines are formed by highly conserved amino acid residues. B, Heterodimer formed by NPG1 (blue) and HYC1 (yellow) as calculated by a hybrid docking approach using the HDOCK algorithm. Analysis of conserved amino acid residues was performed utilizing the Consurf server and mapped on the solvent-excluded surface of each protein. Calculated protein–protein interfaces indicated by red lines are formed by highly conserved amino acid residues. C, Comparison of the experimental structure of the human PI4KIIIα complex (gray, PDB code 6BQ1) with the heterotrimeric Arabidopsis PI4Kα1 complex obtained using template-based modeling and protein–protein docking.
Figure 3
Figure 3
PI4Kα1 loss-of-function leads to pollen lethality. A, Scanning electron microscope micrograph of pollen grains from Col-0, self-fertilized pi4kα1-1 heterozygous plants, self-fertilized pi4kα1-2 heterozygous plants, and self-fertilized pi4kα1-1 homozygous plants expressing PI4Kα1pro:PI4Kα1-3′-UTR (insertion no. 18). Shriveled pollen grains are pseudocolored in yellow and normal pollen grains are pseudocolored in blue. Close-up is shown for pi4kα1-1 pollen on the right. Scale bar: 50 µm. B, Quantification of the percentage of normal (blue) versus deformed/shriveled (yellow) pollen grains from Col-0, self-fertilized pi4kα1-1 heterozygous plants, self-fertilized pi4kα1-2 heterozygous plants, and self-fertilized pi4kα1-1 homozygous plants expressing PI4Kα1pro:PI4Kα1-3′UTR (insertion no. 18). n indicates the number of pollens counted for each genotype. Statistics used chi-square test. n.s, non-significant; ***P < 0.001. C, Observation of Col-0 and pi4kα1-1 shriveled pollen grains by transmission electron microscopy. Right parts show close-up of the region indicated on the left part. c, cytosol; PM, plasma membrane; i, intine; e, exine; PC, pollen coat.
Figure 4
Figure 4
NPG, HYC, and EFOP mutations recapitulate the pi4kα1 gametophytic phenotype including no male transmission and shriveled pollen grain with a thick cell wall. A, Pollen grains observed by scanning electron microscopy of self-fertilized Col-0, npg1-2+/−, npg1-2+/− npgr1−/−, npg1-2+/− npgr1−/− npgr2-2−/−, hyc1+/−, efop3-1−/− efop4-2+/−, and efop3-1−/− efop4-4+/− plants. Deformed pollens and shriveled pollens are pseudocolored in yellow and magenta, respectively. Scale bar: 50 µm. B, Percentage of normal (blue), deformed (magenta) and shriveled (yellow) pollen grains from self-fertilized Col-0, npg1-2+/−, npg1-2+/− npgr1−/−, npg1-2+/− npgr1−/− npgr2-2−/−, hyc1+/−, efop3-1−/− efop4-2+/−, and efop3-1−/− efop4-2+/− plants. n indicates number of pollens counted for each genotype. Statistics used chi-square test. n.s, nonsignificant; ***P < 0.001. C, Observation of pollen grains from self-fertilized Col-0, pi4kα1-1, npg1-2+/− npgr1−/− npgr2-2−/−, hyc1, and efop3-1−/− efop4-2−/− by transmission electron microscopy. Lower part shows close-up of region indicated on upper part. c, cytosol; PM, plasma membrane; i, intine; e, exine; PC, pollen coat.
Figure 5
Figure 5
Mutations of the PI4Kα1 complex induce sporophytic phenotypes. A, Opened siliques of self-fertilized Col-0, hyc2-2 and hyc2-3 heterozygous mutant plants. White arrowheads indicate aborted seeds. B, Percentage of aborted seeds in Col-0, hyc2-2+/−, hyc2-3+/−, hyc2-2−/− HYC2pro:HYC2-mCITRINE (insertion no. 10), and hyc2-2−/− HYC2pro:HYC2-2xmCHERRY (insertion no. 11) siliques. The number of seeds counted is superior to 250 for each genotype. Statistics used chi-square test. n.s., nonsignificant; ***P < 0.001. C, Cleared seeds from hyc2-2 and hyc2-3 heterozygous mutant plants. White arrowheads indicate globular embryos that have stopped development. D, Twenty-seven-day-old Col-0, npg1-2+/−, npgr1−/−, npgr2-2−/−, npg1-2+/− npgr1−/−, npgr1−/− npgr2-2−/−, and npg1-2+/− npgr1−/− npgr2-2−/− plants. Scale bar: 2 cm. E, Forty-one-day-old Col-0, npg1-2+/−, npgr1−/−, npgr2-2−/−, npg1-2+/− npgr1−/−, npgr1−/− npgr2-2−/−, and npg1-2+/− npgr1−/− npgr2-2−/− plants. Scale bar: 2 cm. F, Thirty-eight-day-old Col-0 and plants expressing microRNA2 and microRNA3 against PI4Kα1. Scale bar: 2 cm.
Figure 6
Figure 6
Inducible PI4Kα1 knockdown impacts sporophytic development and has subtle effects on PI4P accumulation at the plasma membrane. A, Pictures and measures of the primary root of 9-day-old seedlings of Col-0 and seedlings expressing the inducible microRNA2 against PI4Kα1 on noninducible (DMSO) and inducible medium (5 μM β-estradiol, β-est) supplemented with sucrose for two independent insertions (#3 in green and #6 in orange). Scale bar: 1 cm. n indicates the number of seedlings measured. Whiskers correspond to the lower and upper quartile, the median and the minimum and maximum (excluding the outliers), respectively. Statistics were done using Wilcoxon test. Bottom, PI4Kα1 protein levels of 9-day-old Col-0 seedlings and seedlings expressing the inducible microRNA2 against PI4Kα1 on noninducible (DMSO) and inducible medium (5-μM β-estradiol) for two independent insertions (#3 and #6). Immunoblot used an anti-PI4Kα1 antibody and an anti-tubuline α (anti-Tub α) as control. The relative density of signal adjusted to the Col-0 DMSO condition is indicated. B, Cytosol/plasma membrane signal intensity ratio of PI4P biosensors mCITRINE-1xPHFAPP1 (P5Y), mCITRINE-1xPHFAPP1-E50A, and mCITRINE-P4MSidM on epidermal root cells of seedlings expressing the inducible microRNA2 against PI4Kα1 on noninducible (DMSO) and inducible medium (5-μM β-estradiol). n indicates the number of seedlings measured. Three cells per seedling were measured. Statistics were done using Wilcoxon test. C, TLC analysis of lipid extract from 9-day-old 32Pi-prelabeled seedlings expressing the inducible microRNA2 against PI4Kα1 on noninducible (DMSO) and inducible medium (5-μM β-estradiol) supplemented with sucrose for two independent insertions (3 and 6). 32Pi labeling was performed overnight (16–20 h), and quantification of 32P-levels in PIP and PA (as control) by phosphoimaging and calculated as percentage of total 32P-lipids. Each sample represents the extract of three seedlings and each treatment was performed in quadruplicate of which averages ± sd are shown.
Figure 7
Figure 7
The PI4Kα1 complex localizes at the plasma membrane. A, Confocal images of PI4Kα1, NPG1, NPGR1, NPGR2, HYC1, HYC2, EFOP1, EFOP2, and EFOP3 fused to mCITRINE (mCt) or 2xmCHERRY under the control of the UBQ10 promoter in root epidermal cells. Scale bar: 10 µm. B, Confocal images of PI4Kα1 using an anti-PI4Kα1 antibody in epidermal root cells on WT seedlings. Control background without primary antibody is shown. Scale bar: 10 µm. C, Immunoblot using anti-PI4Kα1, anti-NPGR2, anti-V-type ATPase, and anti-PIP1,2 aquaporin antibodies on plasma membrane and microsomal fractions from WT seedlings. D, Confocal images of seedlings co-expressing Lti6b-2×mCHERRY (under the control of the 2×35S promoter), NPGR2–mCITRINE, HYC2–mCITRINE, or EFOP2–mCITRINE (under the control of the UBQ10 promoter). Graphics on the left represent intensity of each signal across the cell along the cyan line. Graphics in the middle represent intensity of each signal along the membrane indicated by the orange arrow. Matching pic intensity is indicated by black arrows. Linear regression and adjusted R square for each signal are indicated. Graphics on the right represent residuals in y between signal along the membrane and linear regression. E, Confocal images of PI4Kα1-mCt, mCt-PI4Kα1, NPGR2-mCt, HYC2-mCt, EFOP2-mCt under the control of the UBQ10 promoter in root epidermal cells in control condition (MES) and during plasmolysis (MES+Sorbitol). Scale bar: 10 µm.
Figure 8
Figure 8
The PI4Kα1 complex localizes in highly static nanodomains at the plasma membrane. A, Confocal images of seedlings co-expressing Lti6b–2×mCHERRY (under the control of the 2x35S promoter), NPGR2–mCITRINE, or EFOP2–mCITRINE (under the control of the UBQ10 promoter). Graphics represent intensity of each signal across the cell along the cyan line. Black arrows indicate matching signals. Scale bar: 5 µm. B, Confocal images of TIRF microscopy of NPGR2-mCt, HYC2-mCt, and EFOP2-mCt. Scale bar: 5 µm. C, Confocal images of P4M, PHFAPP1, NPGR2-mCt, and EFOP2-mCt before photobleaching (prebleach) and 120 s after photobleaching. Scale bar: 5 µm. D, Kymographs along the membrane for the time lapse in (C). Scale bar: 5 µm. E, Graphic presenting the recovery of the signal intensity over time after bleaching. The number of zones measured is 37, 32, 30, and 13 for P4M, PHFAPP1, NPGR2-mCt, and EFOP2-mCt, respectively. The fitting curves are represented. F, Graphic presenting the mobile fraction of P4M, PHFAPP1, NPGR2-mCt, and EFOP2-mCt after 2 min post-bleaching taking in account the inherent bleaching due to imaging. Whiskers correspond to the lower and upper quartile, the median and the minimum and maximum (excluding the outliers), respectively.
Figure 9
Figure 9
The EFOP subunit determines PI4Kα1 localization by lipid anchoring. A, N-terminal sequence alignment of EFOPs proteins. Conserved cys-rich motif (green) and polybasic patch (blue) are indicated, as well as, the deletion in efop4-4 CrisPr allele. Bold cysteines are predicted as S-acetylated on the SwissPalm database with high (green) and medium (orange) confidence level. B, Template-based model of the EFOP1 structure (amino acid range 32–493). The left side shows an analysis of conserved amino acid residues mapped on the solvent-excluded surface of EFOP1. The right side shows electrostatic potential mapped on the solvent-excluded surface of EFOP1. The figure shows that the N-terminally located basic patch is highly conserved. C, Confocal images of EFOP2–mCITRINE (wild-type), EFOP2-7Q–mCITRINE, and EFOP2-CC–mCITRINE in N. benthamiana leaf epidermal cells and Arabidopsis root epidermal cells. Scale bar: 10 μm. D, Confocal images of PI4P sensor (PH domain of FAPP1 carrying the mutation E50A), EFOP2–mCITRINE (EFOP2-mCt), and NPGR2–mCITRINE (NPGR2–mCt) treated for 30 min with 30 μM PAO or the equivalent volume of DMSO. Scale bar: 10 μm. E, Confocal images of Arabidopsis root epidermal cells co-expressing EFOP2-CC-mCITRINE and NPGR2-2xmCHERRY or PI4Kα1-2xmCHERRY. White arrows indicate internal structures where the two signals colocalize. Scale bar: 10 μm.
Figure 10
Figure 10
The NPG subunit acts as a scaffold around which HYC and PI4Kα1 structure themselves. A, Confocal images of PI4Kα1 using an anti-PI4Kα1 antibody on epidermal root cells of WT, npg1-2+/− npgr1−/− npgr2-1−/− and npg1-2+/− npgr1−/− npgr2-2−/− seedlings. Scale bar: 10 µm. B, Genotyping of Col0, npg1-2 heterozygous plants and npg1-2 homozygous plants complemented with PI4Kα1pro:PI4Kα1-mCITRINE-Lti6b (insertion no. 19). Upper shows amplification of the gene sequence. Lower shows amplification of the T-DNA border. C, Confocal images of PI4Kα1pro:PI4Kα1-mCITRINE-Lti6b in npg1-2−/− background (insertion no. 19). D, Schematic depiction of the plasma membrane targeting of the plant PI4Kα1 complex. The structure of the heterotrimeric complex composed of PI4Kα1 (green, amino acid region 859–2028), NPG1 (blue, amino acid region 43–704) and HYC1 (yellow, amino acid region 51–331), was obtained using template-based modeling and protein–protein docking. The EFOP1 N-terminal part (purple, amino acid region 32–493) was prepared by template-based modeling. Parts of EFOP1 with no homologous structure or predicted as intrinsically disordered are depicted as continuous lines. The S-acylated N-terminus of EFOP1 is shown together with plus signs depicting the polybasic patch of EFOP1. E, Analysis of conserved amino acid residues mapped on the solvent-excluded surface of the heterotrimeric complex (PI4Kα1–NPG1–HYC1) and EFOP1.
None

Comment in

  • Back to the roots: A focus on plant cell biology.
    Weijers D, Bezanilla M, Jiang L, Roeder AHK, Williams M. Weijers D, et al. Plant Cell. 2022 Jan 20;34(1):1-3. doi: 10.1093/plcell/koab278. Plant Cell. 2022. PMID: 34755878 Free PMC article. No abstract available.

References

    1. Antignani V, Klocko AL, Bak G, Chandrasekaran SD, Dunivin T, Nielsen E (2015) Recruitment of PLANT U-BOX13 and the PI4Kβ1/β2 phosphatidylinositol-4 kinases by the small GTPase RabA4B plays important roles during salicylic acid-mediated plant defense signaling in Arabidopsis. Plant Cell 27: 243–261 - PMC - PubMed
    1. Ashkenazy H, Abadi S, Martz E, Chay O, Mayrose I, Pupko T, Ben-Tal N (2016) ConSurf 2016: an improved methodology to estimate and visualize evolutionary conservation in macromolecules. Nucleic Acids Res 44: W344–350 - PMC - PubMed
    1. Audhya A, Emr SD (2002) Stt4 PI 4-kinase localizes to the plasma membrane and functions in the Pkc1-mediated MAP kinase cascade. Dev Cell 2: 593–605 - PubMed
    1. Audhya A, Foti M, Emr SD (2000) Distinct roles for the yeast phosphatidylinositol 4-kinases, Stt4p and Pik1p, in secretion, cell growth, and organelle membrane dynamics. Mol Biol Cell 11: 2673–2689 - PMC - PubMed
    1. Baird D, Stefan C, Audhya A, Weys S, Emr SD (2008) Assembly of the PtdIns 4-kinase Stt4 complex at the plasma membrane requires Ypp1 and Efr3. J Cell Biol 183: 1061–1074 - PMC - PubMed

Publication types

MeSH terms

Substances