. 2021 May 27;184(11):2927-2938.e11.
doi: 10.1016/j.cell.2021.04.045. Epub 2021 May 4.

High-resolution profiling of pathways of escape for SARS-CoV-2 spike-binding antibodies

Affiliations

High-resolution profiling of pathways of escape for SARS-CoV-2 spike-binding antibodies

Meghan E Garrett et al. Cell. .

Abstract

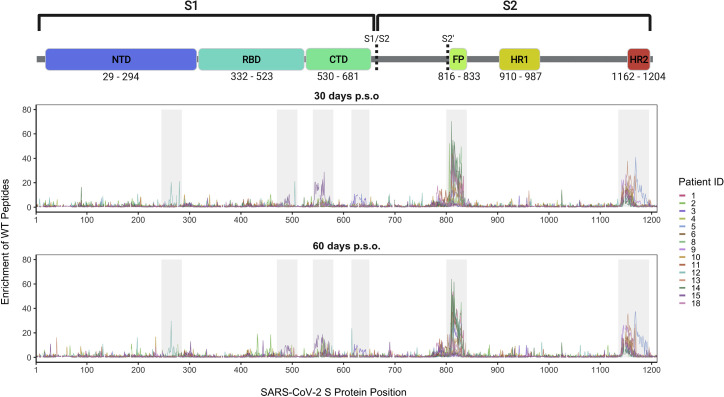
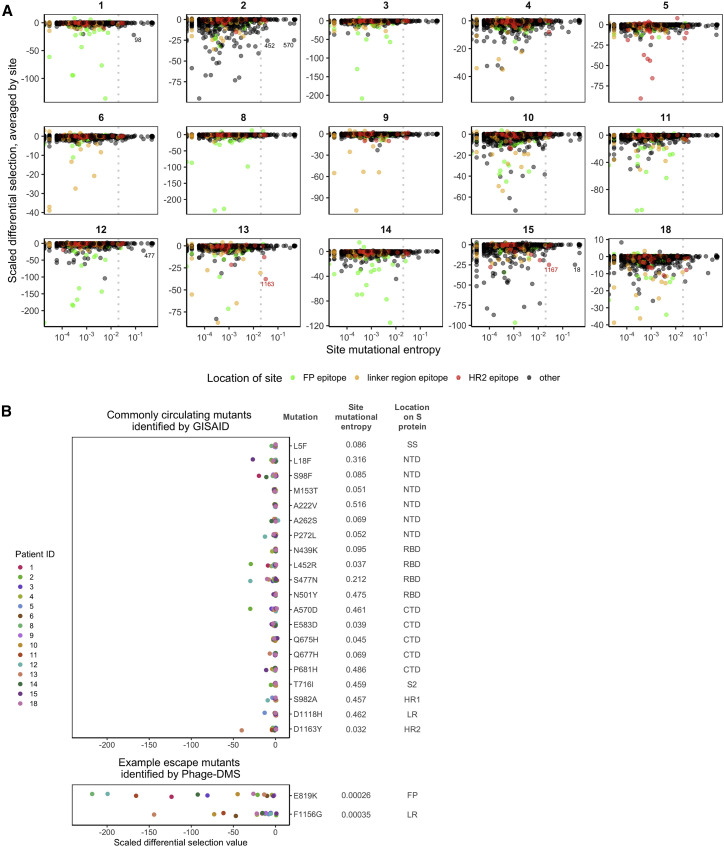
Defining long-term protective immunity to SARS-CoV-2 is one of the most pressing questions of our time and will require a detailed understanding of potential ways this virus can evolve to escape immune protection. Immune protection will most likely be mediated by antibodies that bind to the viral entry protein, spike (S). Here, we used Phage-DMS, an approach that comprehensively interrogates the effect of all possible mutations on binding to a protein of interest, to define the profile of antibody escape to the SARS-CoV-2 S protein using coronavirus disease 2019 (COVID-19) convalescent plasma. Antibody binding was common in two regions, the fusion peptide and the linker region upstream of the heptad repeat region 2. However, escape mutations were variable within these immunodominant regions. There was also individual variation in less commonly targeted epitopes. This study provides a granular view of potential antibody escape pathways and suggests there will be individual variation in antibody-mediated virus evolution.

Keywords: COVID-19; DMS; SARS-CoV-2; Spike; antibodies; deep mutational scanning; epitope mapping; escape mutations; phage display.


Conflict of interest statement

Declaration of interests M.E.G. and J.O. are inventors on a patent application on Phage-DMS. H.Y.C. is a consultant for Merck, Pfizer, Ellume, and the Bill and Melinda Gates Foundation and has received support from Cepheid and Sanofi-Pasteur.

Figures

None
Graphical abstract
Figure 1
Figure 1
Schematic of the design of the Spike Phage-DMS library (A) Structure of the S protein and location of important protein domains. Structure was made in BioRender.com (PDB: 6VXX). (B) Sequences were computationally designed to code for peptides 31aa long and tile stepwise across the Wuhan Hu-1 SARS-CoV-2 S protein ectodomain by 1 aa. There are 20 peptides representing all 20 possible aa at the central position containing either the wild-type residue (shown in black) or a mutant residue (shown in red). Within the 31 aa region surrounding the D614G mutation, peptides were also generated with G614 in addition to the 20 aa variants at the central position. (C) The designed sequences were cloned into a T7 phage display vector and amplified to create the final S protein Phage-DMS library. This library was then used in downstream immunoprecipitation and deep sequencing experiments with human plasma. See Figure S1 for distribution of sequences in the final library.
Figure S1
Figure S1
Distribution of sequenced peptides within biological replicate Spike Phage-DMS libraries, related to Figures 1 and 2 (A and B) Histogram showing the distribution of all sequenced peptides from a representative deep sequencing experiment for Spike Phage-DMS Library 1 (A) and Library 2 (B). Reads were stringently aligned to the reference library, allowing for 0 mismatches, and the proportion of unmapped reads is shown at the top. Additionally, the proportion of all non-sequenced peptides for each library is shown at the top.
Figure S2
Figure S2
Reproducibility of peptide enrichment by plasma from COVID-19 patients, related to Figure 2 (A) Distribution of correlation values between peptide enrichment values for replicate experiments with samples from COVID-19 patients (Pearson’s correlation coefficient, R). Each color corresponds to a unique patient or volunteer, and the shape of each dot represents the type of sample. A dotted line at y = 0.5 represents the cutoff used to determine whether samples were kept in the analysis. (B) Boxplots showing the distribution of correlation values between patient samples that were paired between the day 30 and 60 p.s.o. time points (on the left) or samples that were randomly paired and compared (on the right). (C) Relationship between the biological replicate correlation for a sample and its correlation with its paired time point. Each color corresponds to a unique patient, and the shape of each dot represents the type of sample. Pearson’s correlation coefficient shown.
Figure 2
Figure 2
Linear epitopes bound by COVID-19 patient plasma Lines represent the enrichment of wild-type peptides from the Spike Phage-DMS library from individual plasma samples. Samples from convalescent COVID-19 patient plasma taken at approximately day 30 p.s.o. (top panel) or day 60 p.s.o. (bottom panel) are shown. Lines are colored by patient, with the key to the patient IDs on the right (see Figure S2 for patient inclusion criteria). Grey boxes highlight immunogenic regions where enrichment was detected in at least one individual across time points. Peptides that were included in the design, but absent from the phage library (see Figure S1), are shown as breaks in the line plots. A schematic of S protein domains is shown above, with locations defined based on numbering used in: https://cov.lanl.gov/components/sequence/COV/annt/annt.comp. See also Table S1 and Figures S3 and S4.
Figure S3
Figure S3
Plasma binding and neutralization with RBD-depleted plasma, related to Figure 2 (A and B) Change in plasma binding to RBD (A) and Spike (B) before and after depletion of RBD-binding antibodies, as measured by ELISA area under the curve (AUC). (C) Plasma binding to S2 subunit protein, as measured by ELISA AUC. Dotted lines indicate the lower limit of detection, as determined by pooled pre-pandemic serum. Each point is colored by patient as indicated to the right. (D) Comparison of neutralization titer 50% (NT50) before and after depletion of RBD binding antibodies. The percent residual neutralization for each patient is shown on the right. The dotted line indicates the lower limit of detection (NT50 of 20). Because the lowest dilution of plasma tested is 1:20, we cannot determine NT50 titers smaller than this. (E) Correlation between the most enriched peptide within the FP and HR2 epitope regions and the residual NT50 values for each patient plasma sample. (F) Correlation between plasma binding to S2 and residual NT50 values for each patient. All plasma tested in these assays were from the 30d time point.
Figure 3
Figure 3
Effect of mutations on binding by COVID-19 patient plasma within the FP region Heatmaps depicting the effect of all mutations, as measured by scaled differential selection, at each site within the FP epitope for representative COVID-19 patients (numbered at top). Mutations enriched above the wild-type residue are colored blue, and mutations depleted as compared to the wild-type residue are colored red. The intensity of the colors reflects the amount of differential selection as indicated to the right. The wild-type residue is indicated with a black dot. Line plots showing the enrichment of wild-type peptides for each patient are shown above, with a solid line for the day 30 p.s.o. patient samples and a dashed line for the day 60 p.s.o. patient samples. See Figure S5 for alignment of coronavirus FP sequences.
Figure 4
Figure 4
Effect of mutations on binding by COVID-19 patient plasma within the linker/HR2 region Heatmaps depicting the effect of all mutations, as measured by scaled differential selection, at each site within the linker region/HR2 epitope for representative COVID-19 patients (numbered at top). Mutations enriched above the wild-type residue are colored blue and mutations depleted as compared to the wild-type residue are colored red. The intensity of the colors reflects the amount of differential selection as indicated to the right. The wild-type residue is indicated with a black dot. Line plots showing the enrichment of wild-type peptides for each patient are shown above, with a solid line for the day 30 p.s.o. patient samples and a dashed line for the day 60 p.s.o. patient samples. Peptides missing from the library are shown as gray boxes in the heatmaps and as breaks in the line plots.
Figure S4
Figure S4
Effect of mutations on binding by COVID-19 patient plasma within various regions, related to Figure 2 Heatmaps depicting the effect of all mutations, as measured by scaled differential selection, at each site within the NTD, RBD, and CTD regions. Mutations enriched above the wild-type residue are colored blue and mutations depleted as compared to the wild-type residue are colored red. The wild-type residue is indicated with a black dot. Line plots showing the enrichment of wild-type peptides for each patient are shown above, with a solid line for patient samples taken at day 30 p.s.o. and a dashed line for patient samples taken at day 60 p.s.o. Peptides missing from the library are shown as gray boxes in the heatmaps and as breaks in the line plots.
Figure S5
Figure S5
Multiple sequence alignment of the FP for SARS-CoV-2 and human endemic coronaviruses (OC43, HKU1, NL63, and 229E), related to Figure 3 Alignment was performed using Clustal Omega, and aa are colored according to physiochemical properties. Red indicates small and hydrophobic molecules (excluding Y), blue indicates acidic molecules, magenta indicates basic molecules (excluding H), and green indicates glycine, hydroxyl, sulfhydryl, and amine molecules. GenBank accession numbers: YP_009724390.1, YP_009555241.1, YP_173238.1, YP_003767.1, and NP_073551.1, respectively.
Figure 5
Figure 5
Predicted effects of commonly circulating S protein variants on antibody escape (A) Scatterplot comparing the effect of mutations on patient plasma antibody binding and the frequency of all circulating S protein variants. The mutational entropy of every circulating protein variant, as reported at the http://cov.lanl.govcontent/index website and based on GISAID global sequencing, is plotted on the x axis. The average of the scaled differential selection values for all mutants at each site is plotted on the y axis. Patient IDs are indicated on the top. Each site is colored by its location, as indicated on the bottom. The dotted line denotes the cutoff (0.02) of mutational entropy that GISAID uses to determine variants of interest. Sites with relatively high mutational entropy and scaled differential selection values are labeled. See Figure S6 for the average effect across all patients. (B) Effect of mutant peptides representing commonly circulating S protein variants on binding to COVID-19 patient plasma. We selected sites with a mutational entropy of greater than 0.02, as this is the cutoff used by LANL to determine sites of interest. On top are the 20 sites with the highest mutational entropy values, and on the bottom are two selected sites that were noted as sites of antibody escape within immunodominant epitopes by Phage-DMS. On the right are the mutations examined, named according to the wild-type amino acids, followed by the site number, followed by the mutant amino acids of interest. Mutations chosen at sites of high mutational entropy represent the most common variant found in nature. The scaled differential values found by Phage-DMS for each mutant peptide are shown as dots and are colored by patient as indicated to the left. Data are from samples taken day 60 p.s.o. SS, signal sequence; S2, N-terminal region of S2; LR, linker region.
Figure S6
Figure S6
Effect of commonly circulating S protein variants on antibody escape for all patients, related to Figure 5 Scatterplot comparing the effect of mutations on patient plasma antibody binding and the frequency of all circulating S protein variants. The mutational entropy of every circulating protein variant, as reported at the http://cov.lanl.govcontent/index website and based on GISAID global sequencing, is plotted on the x axis. The average scaled differential selection values for all mutants, averaged across all patients, at each site is plotted on the y axis. Each site is colored by its location, as indicated on the bottom. The dotted line denotes the cutoff (0.02) of mutational entropy which GISAID uses to determine variants of interest.
Figure 6
Figure 6
Epistatic effects of D614G mutation on antibody binding Enrichment values for paired mutant peptides made in either the wild-type Wuhan Hu-1 strain (on the left, D614) or D614G background (on the right, G614) for each patient (numbered at top). All mutant peptides that contained site 614 were included in this analysis (spanning amino acids 599–629). Data are from samples taken day 60 p.s.o. Wilcoxon paired signed-rank test was performed (n = 380 paired mutant peptides). The effect size for all patient samples was small (Wilcoxon r < 0.3), except for patient 10, whose antibodies exhibited a moderate effect (Wilcoxon r = 0.46).

Update of

References

    1. Baum A., Fulton B.O., Wloga E., Copin R., Pascal K.E., Russo V., Giordano S., Lanza K., Negron N., Ni M., et al. Antibody cocktail to SARS-CoV-2 spike protein prevents rapid mutational escape seen with individual antibodies. Science. 2020;369:1014–1018. - PMC - PubMed
    1. Belouzard S., Chu V.C., Whittaker G.R. Activation of the SARS coronavirus spike protein via sequential proteolytic cleavage at two distinct sites. Proc. Natl. Acad. Sci. USA. 2009;106:5871–5876. - PMC - PubMed
    1. Brouwer P.J.M., Caniels T.G., van der Straten K., Snitselaar J.L., Aldon Y., Bangaru S., Torres J.L., Okba N.M.A., Claireaux M., Kerster G., et al. Potent neutralizing antibodies from COVID-19 patients define multiple targets of vulnerability. Science. 2020;369:643–650. - PMC - PubMed
    1. Crawford K.H.D., Eguia R., Dingens A.S., Loes A.N., Malone K.D., Wolf C.R., Chu H.Y., Tortorici M.A., Veesler D., Murphy M., et al. Protocol and Reagents for Pseudotyping Lentiviral Particles with SARS-CoV-2 Spike Protein for Neutralization Assays. Viruses. 2020;12:12. - PMC - PubMed
    1. Dingens A.S., Arenz D., Weight H., Overbaugh J., Bloom J.D. An Antigenic Atlas of HIV-1 Escape from Broadly Neutralizing Antibodies Distinguishes Functional and Structural Epitopes. Immunity. 2019;50:520–532.e3. - PMC - PubMed

MeSH terms