. 2021 May 18;35(7):109136.
doi: 10.1016/j.celrep.2021.109136.

Transcriptional co-activator regulates melanocyte differentiation and oncogenesis by integrating cAMP and MAPK/ERK pathways

Affiliations

Transcriptional co-activator regulates melanocyte differentiation and oncogenesis by integrating cAMP and MAPK/ERK pathways

Jelena Ostojić et al. Cell Rep. .

Abstract

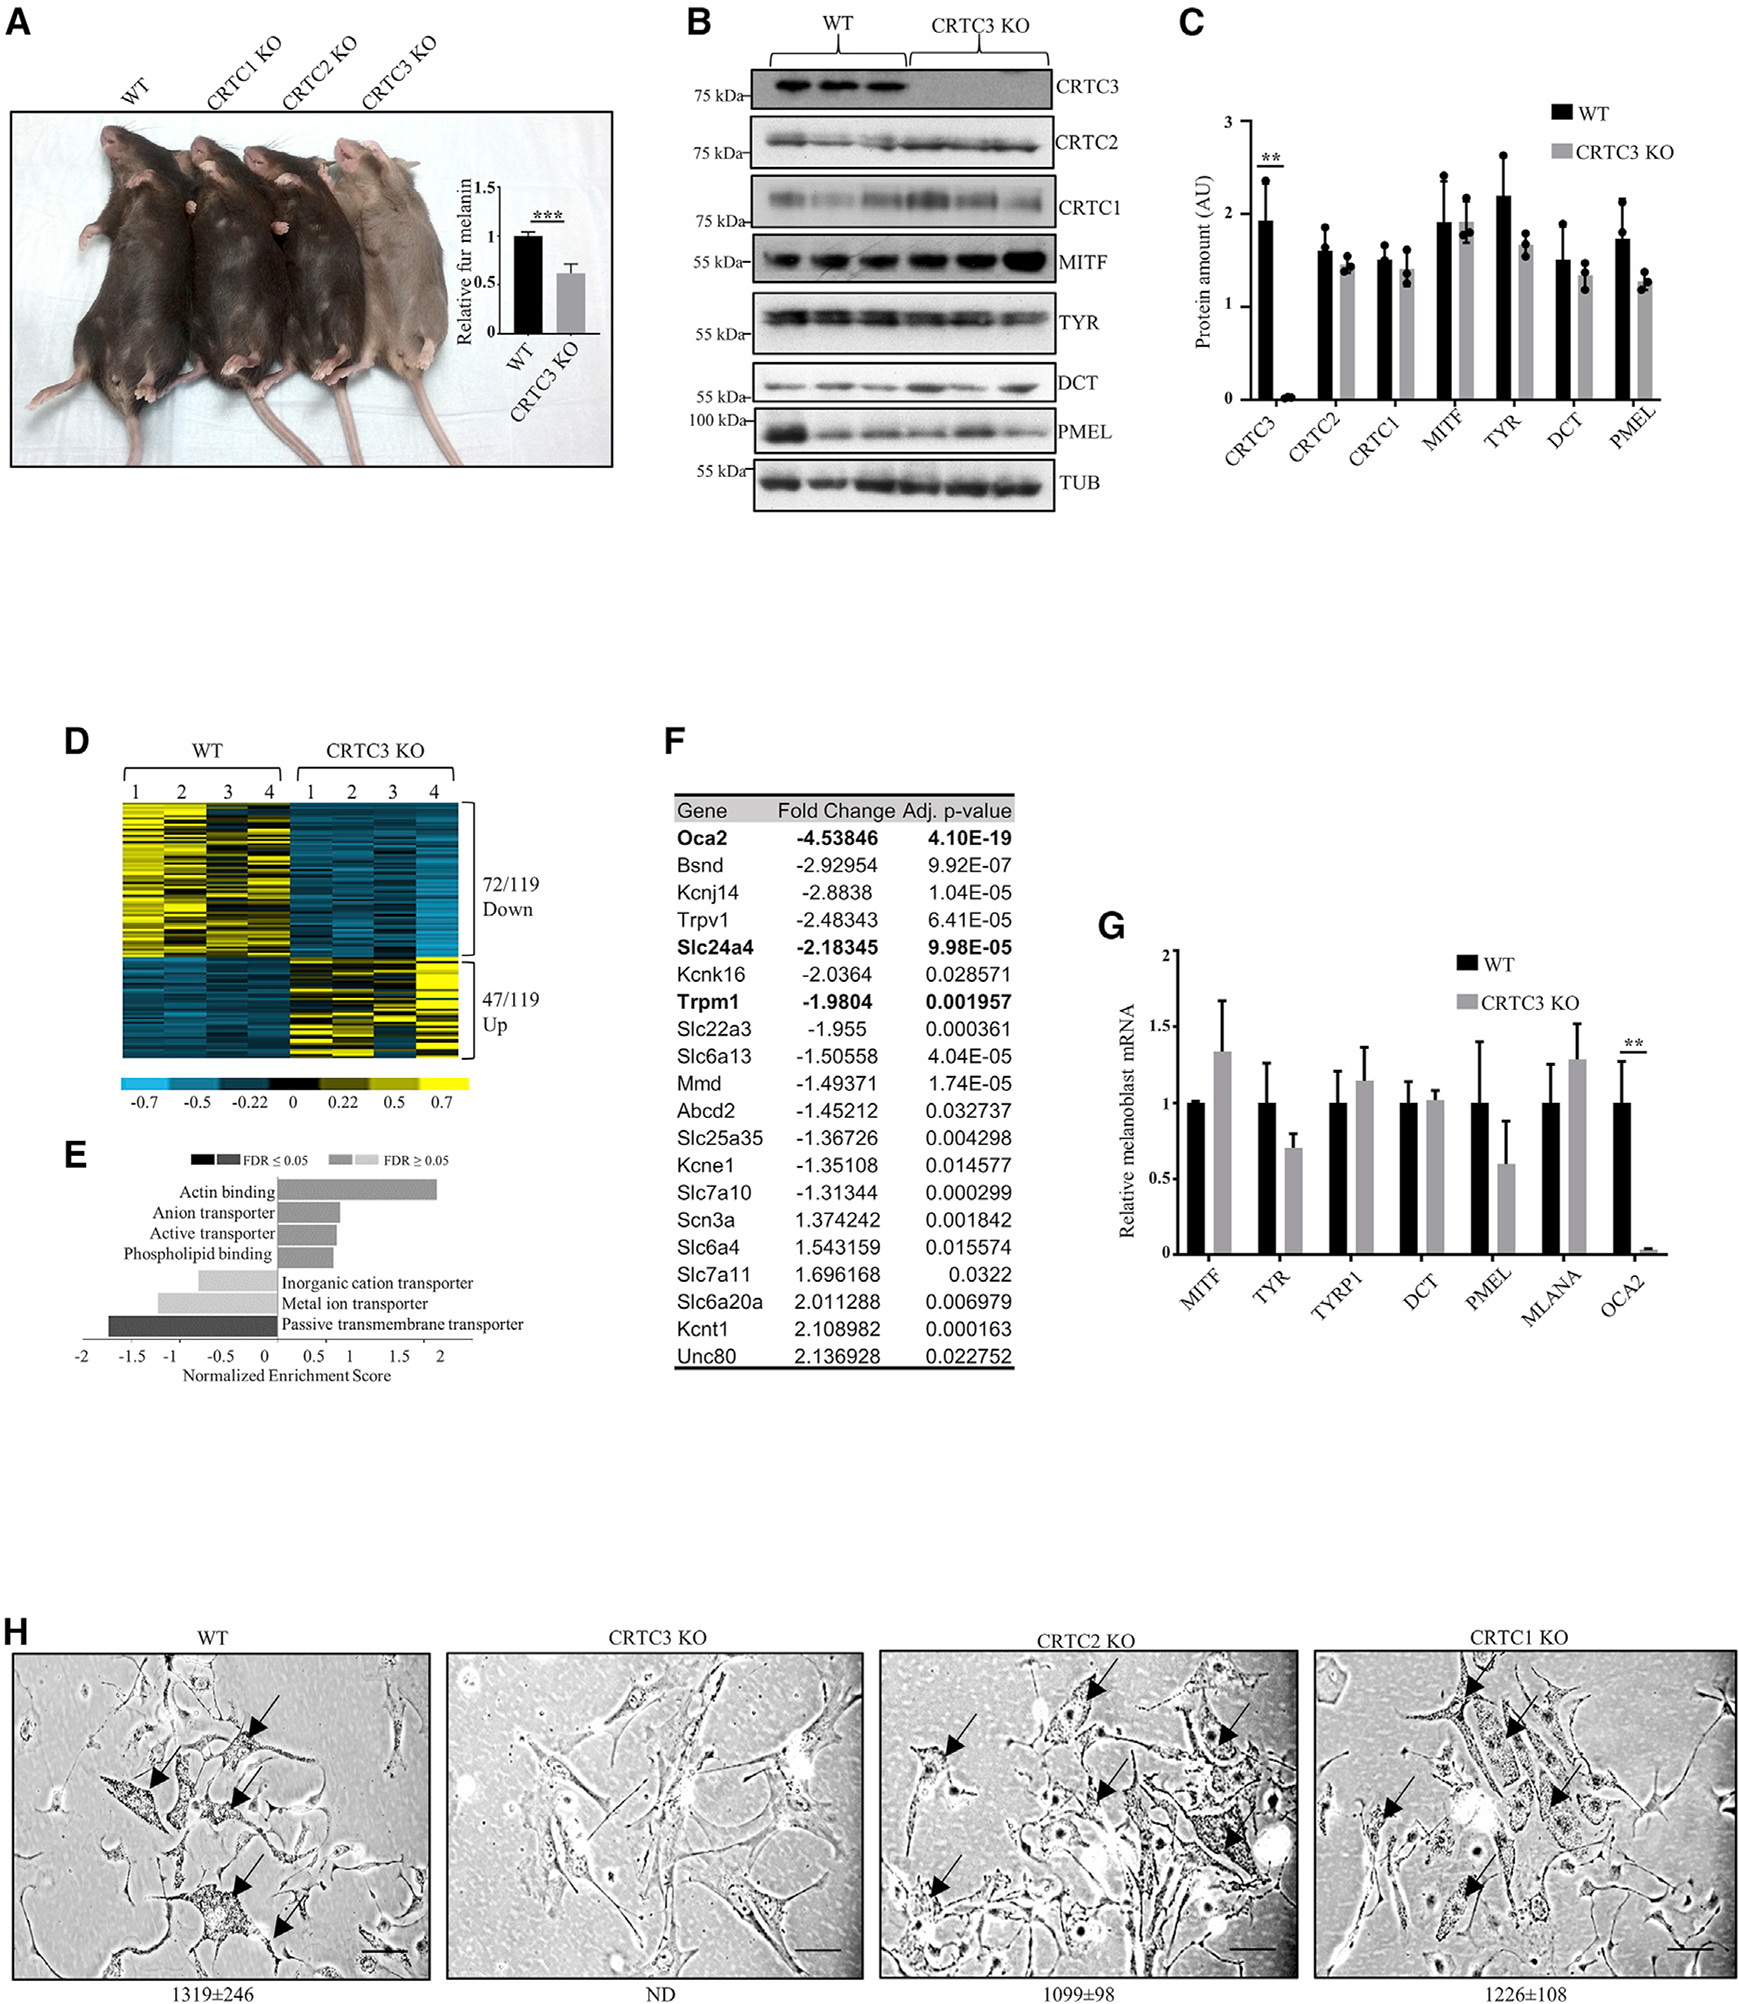
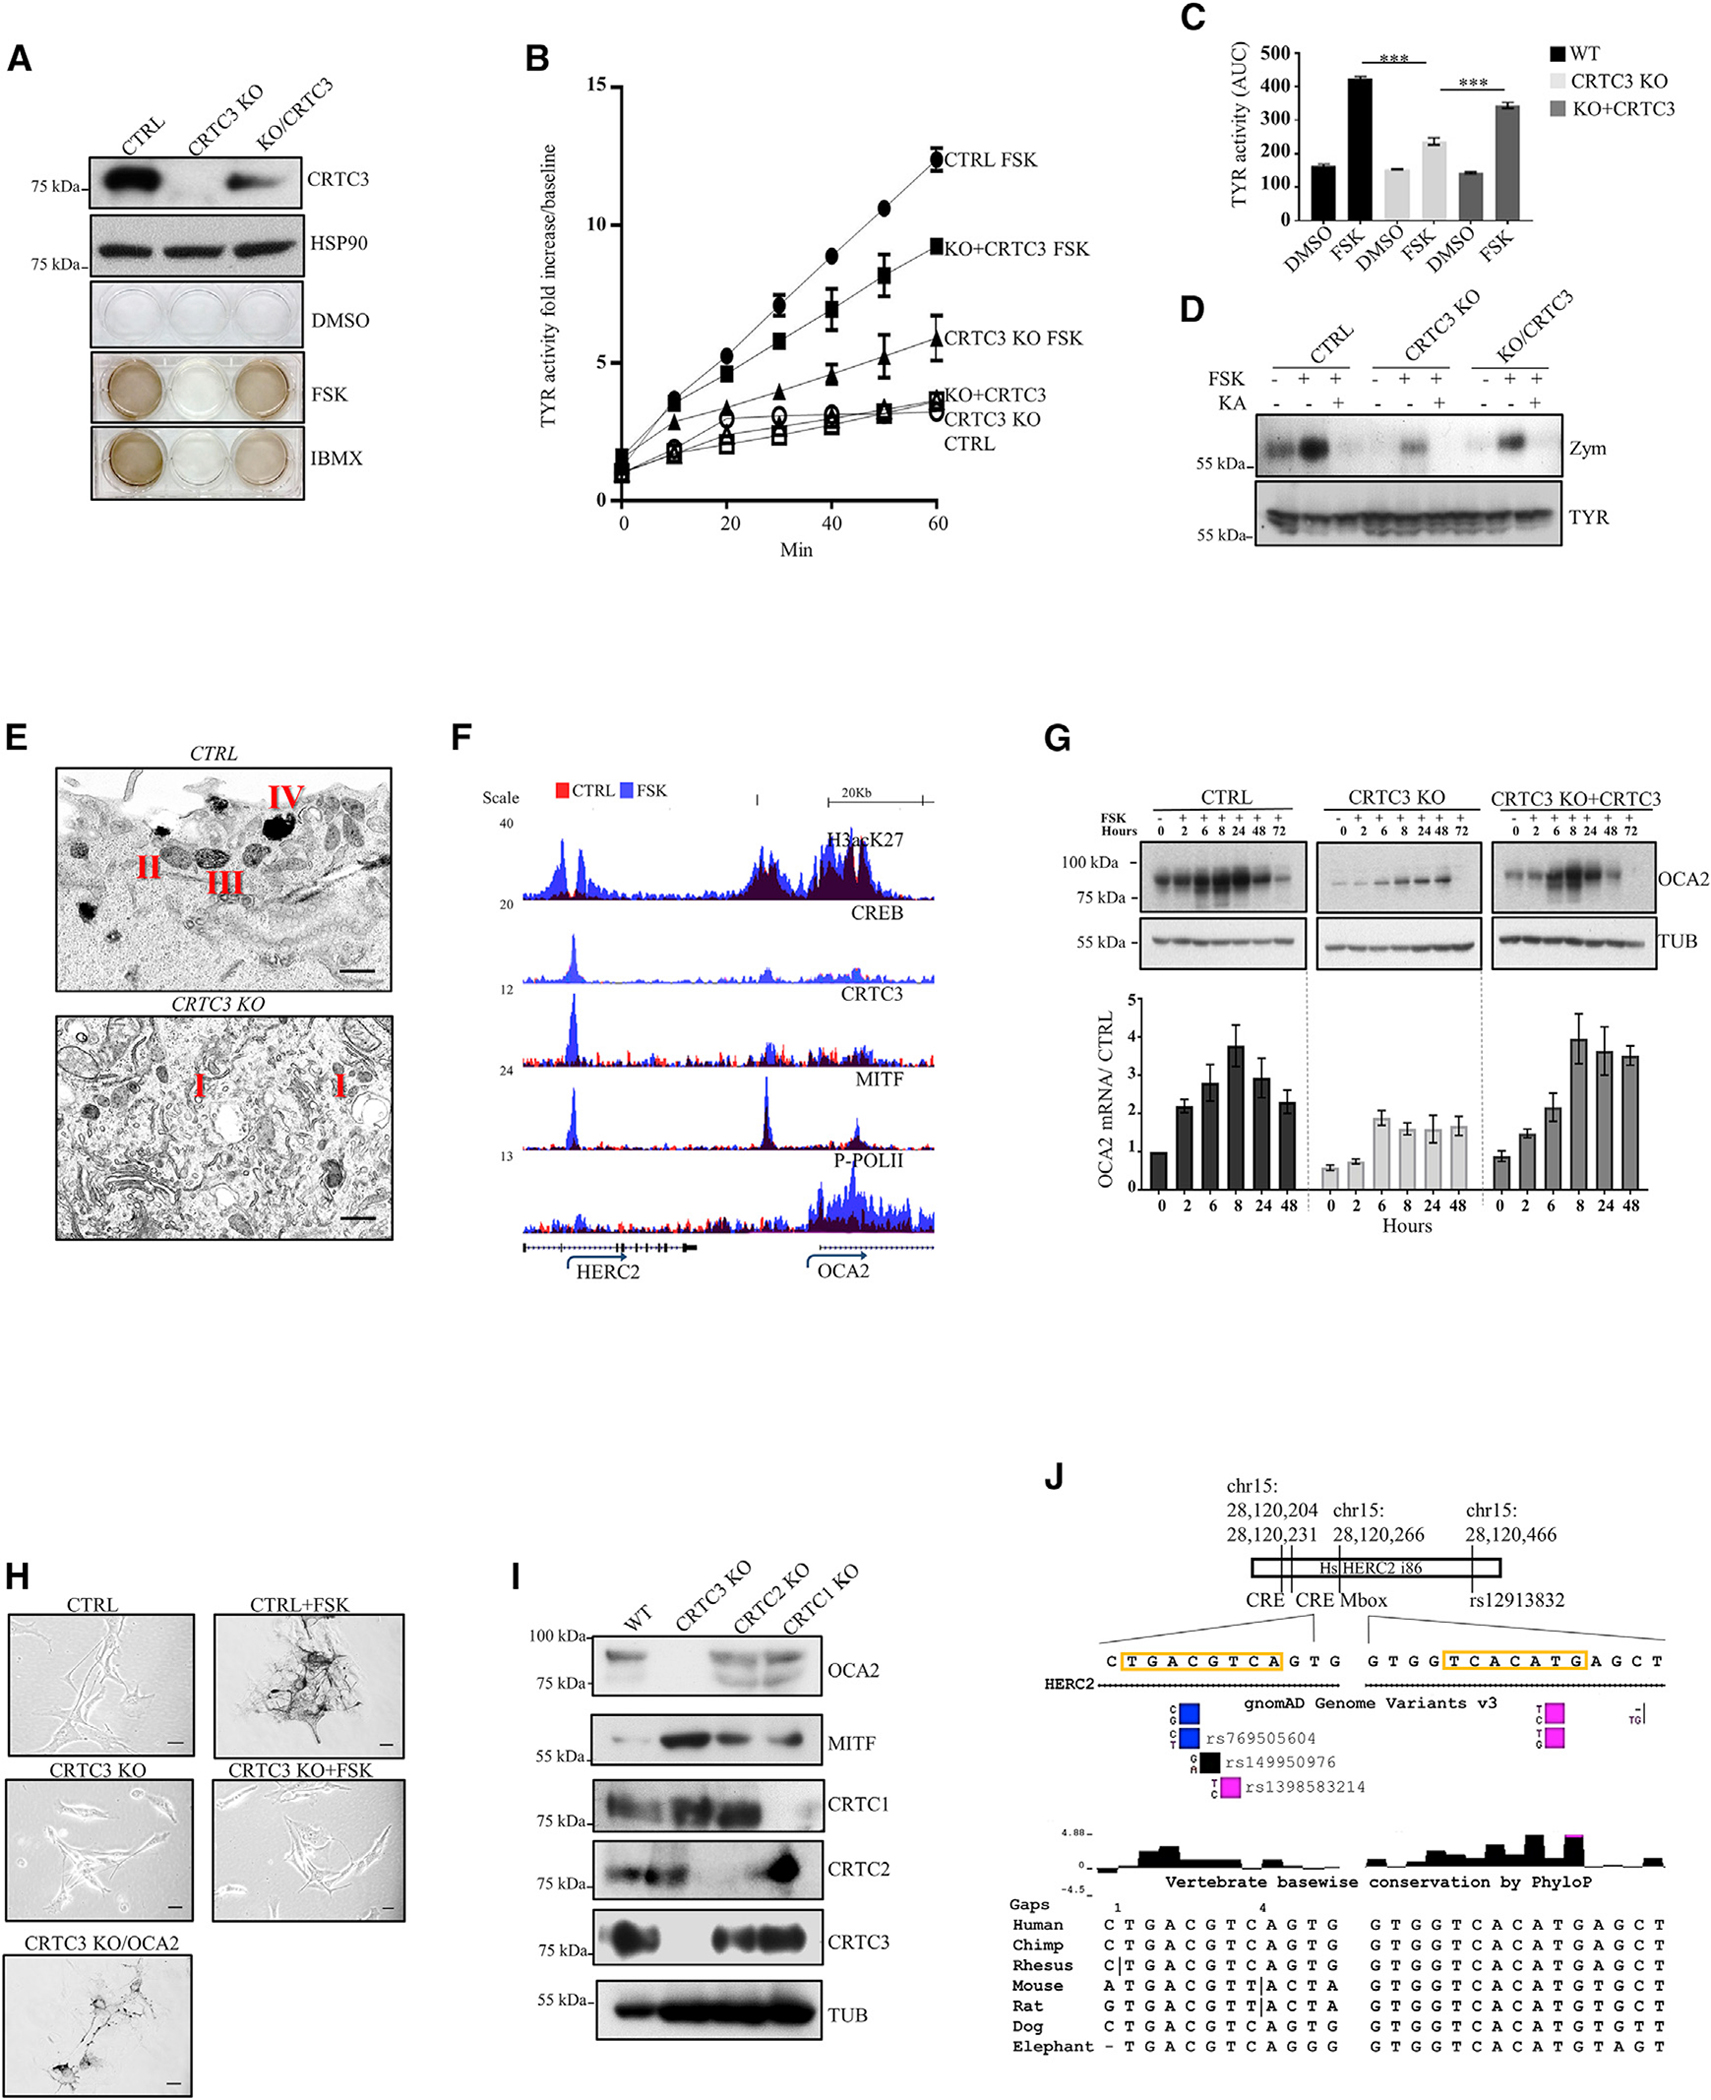
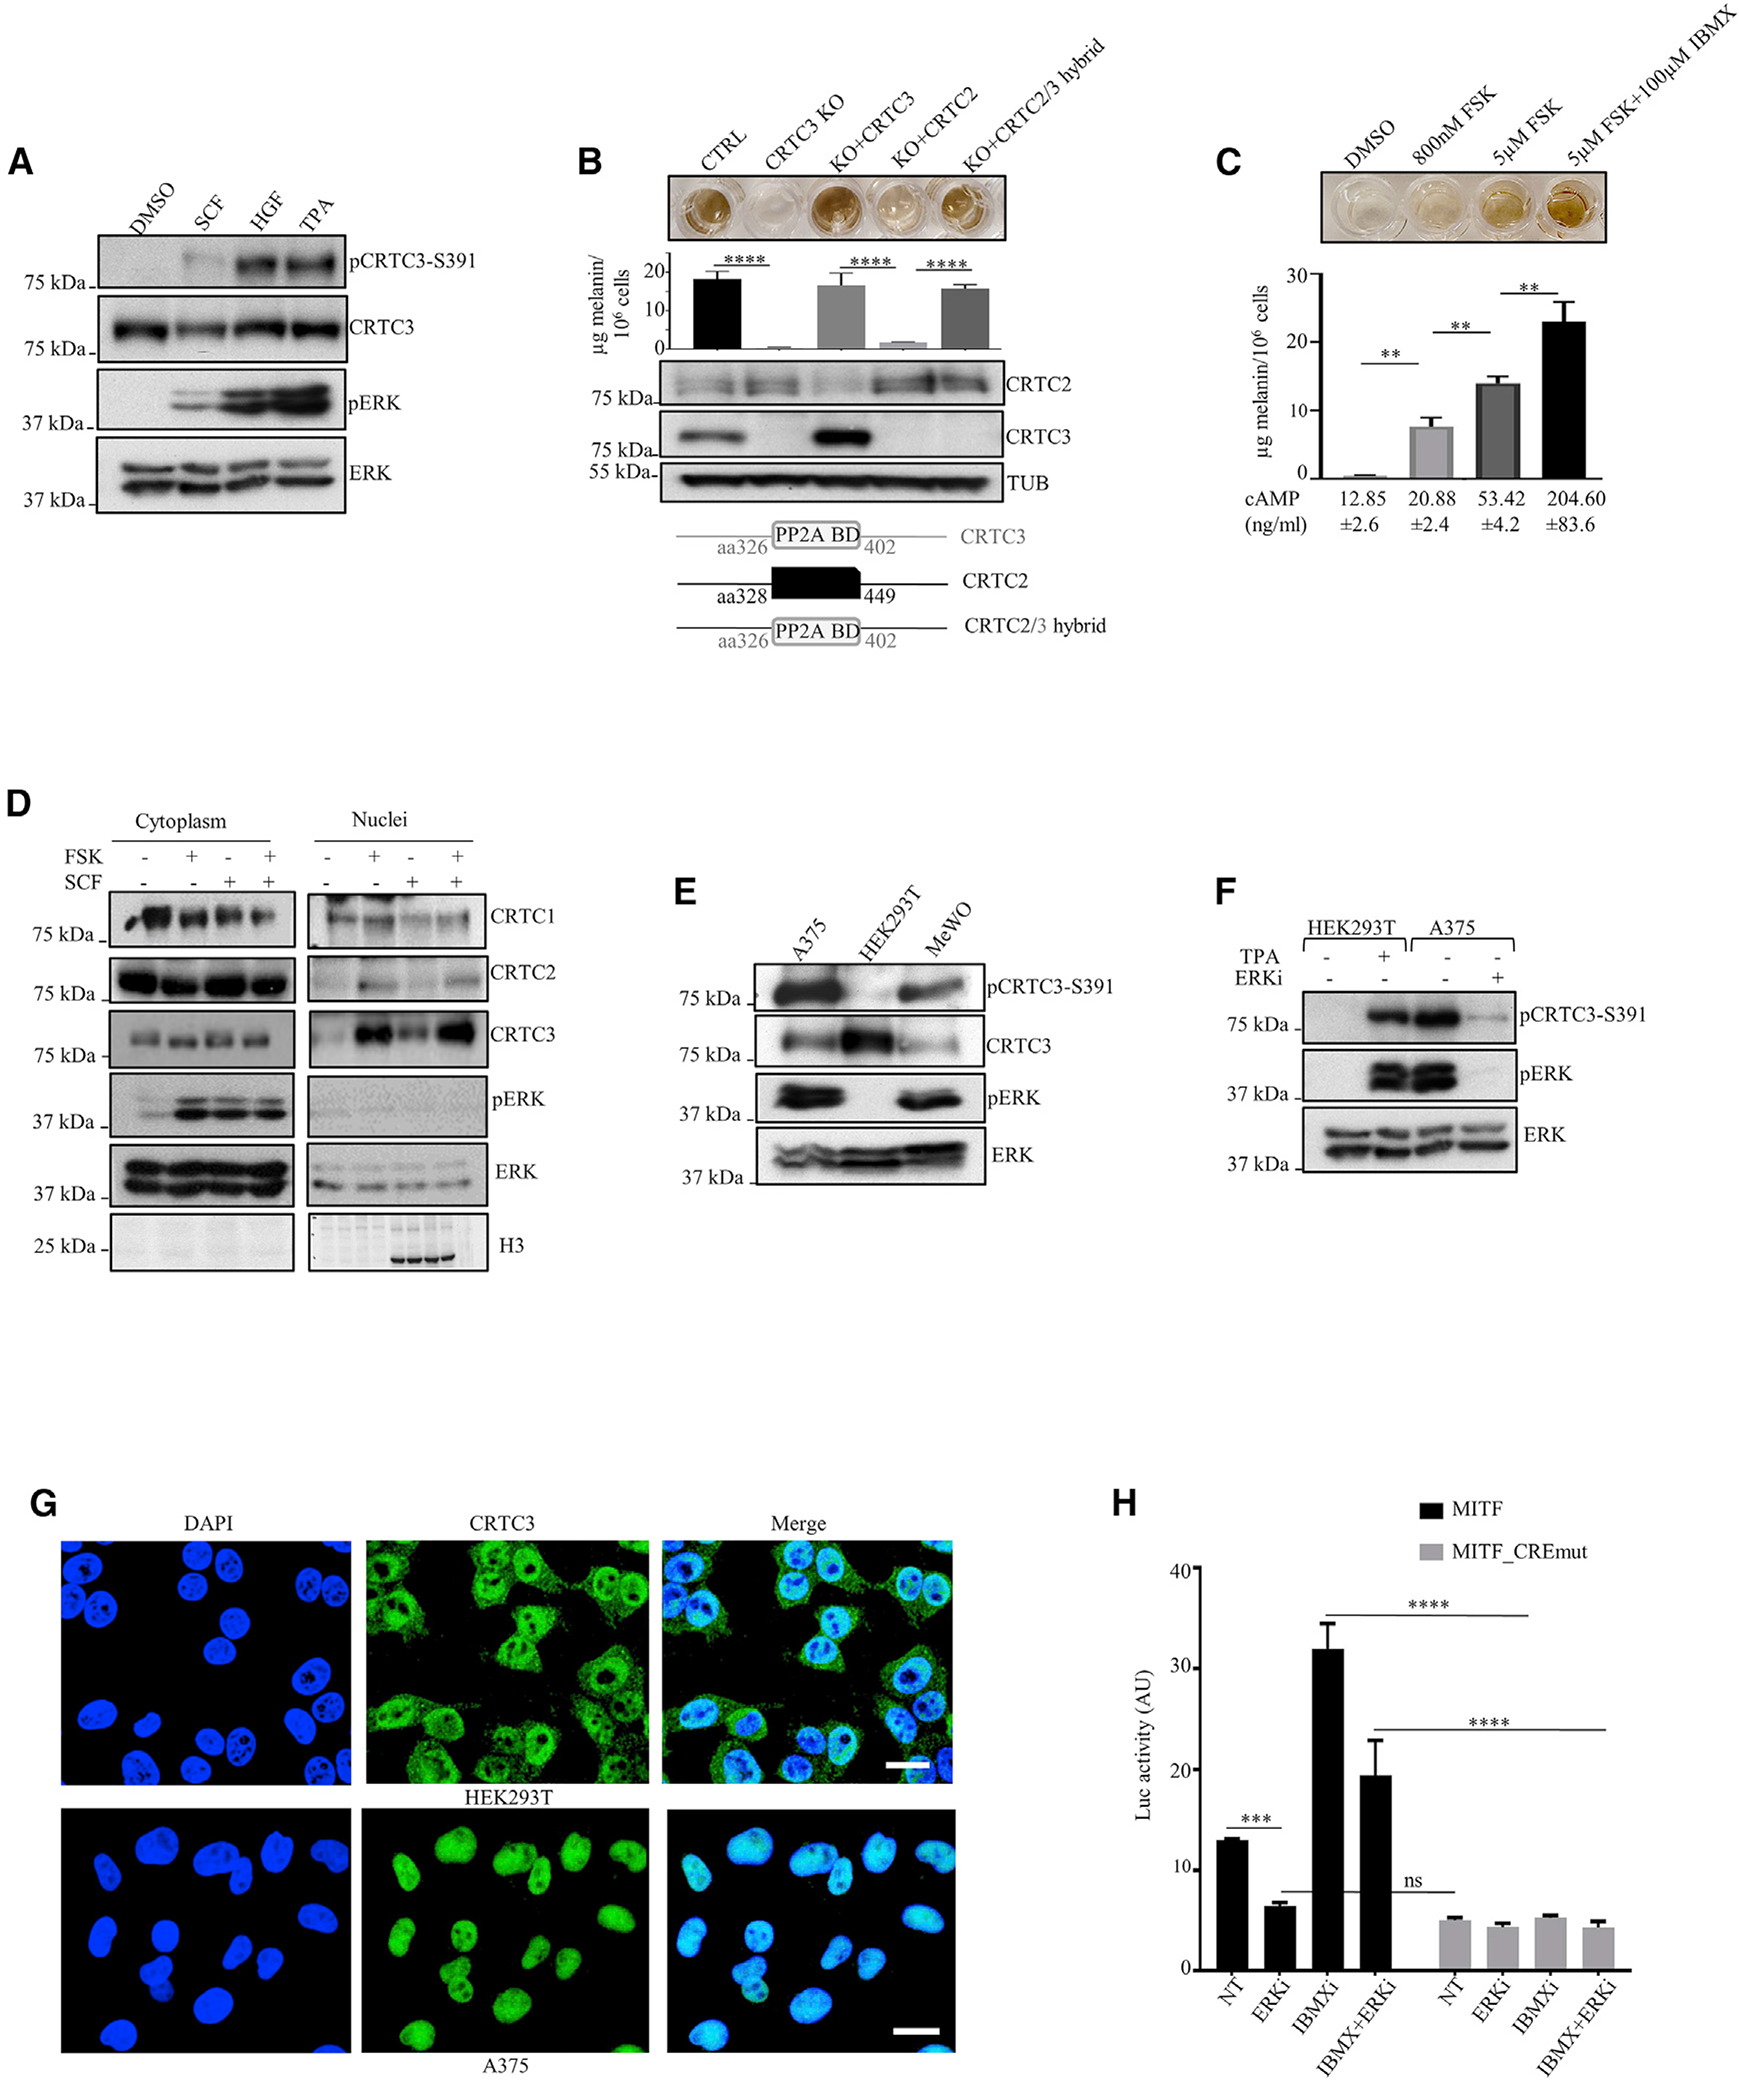
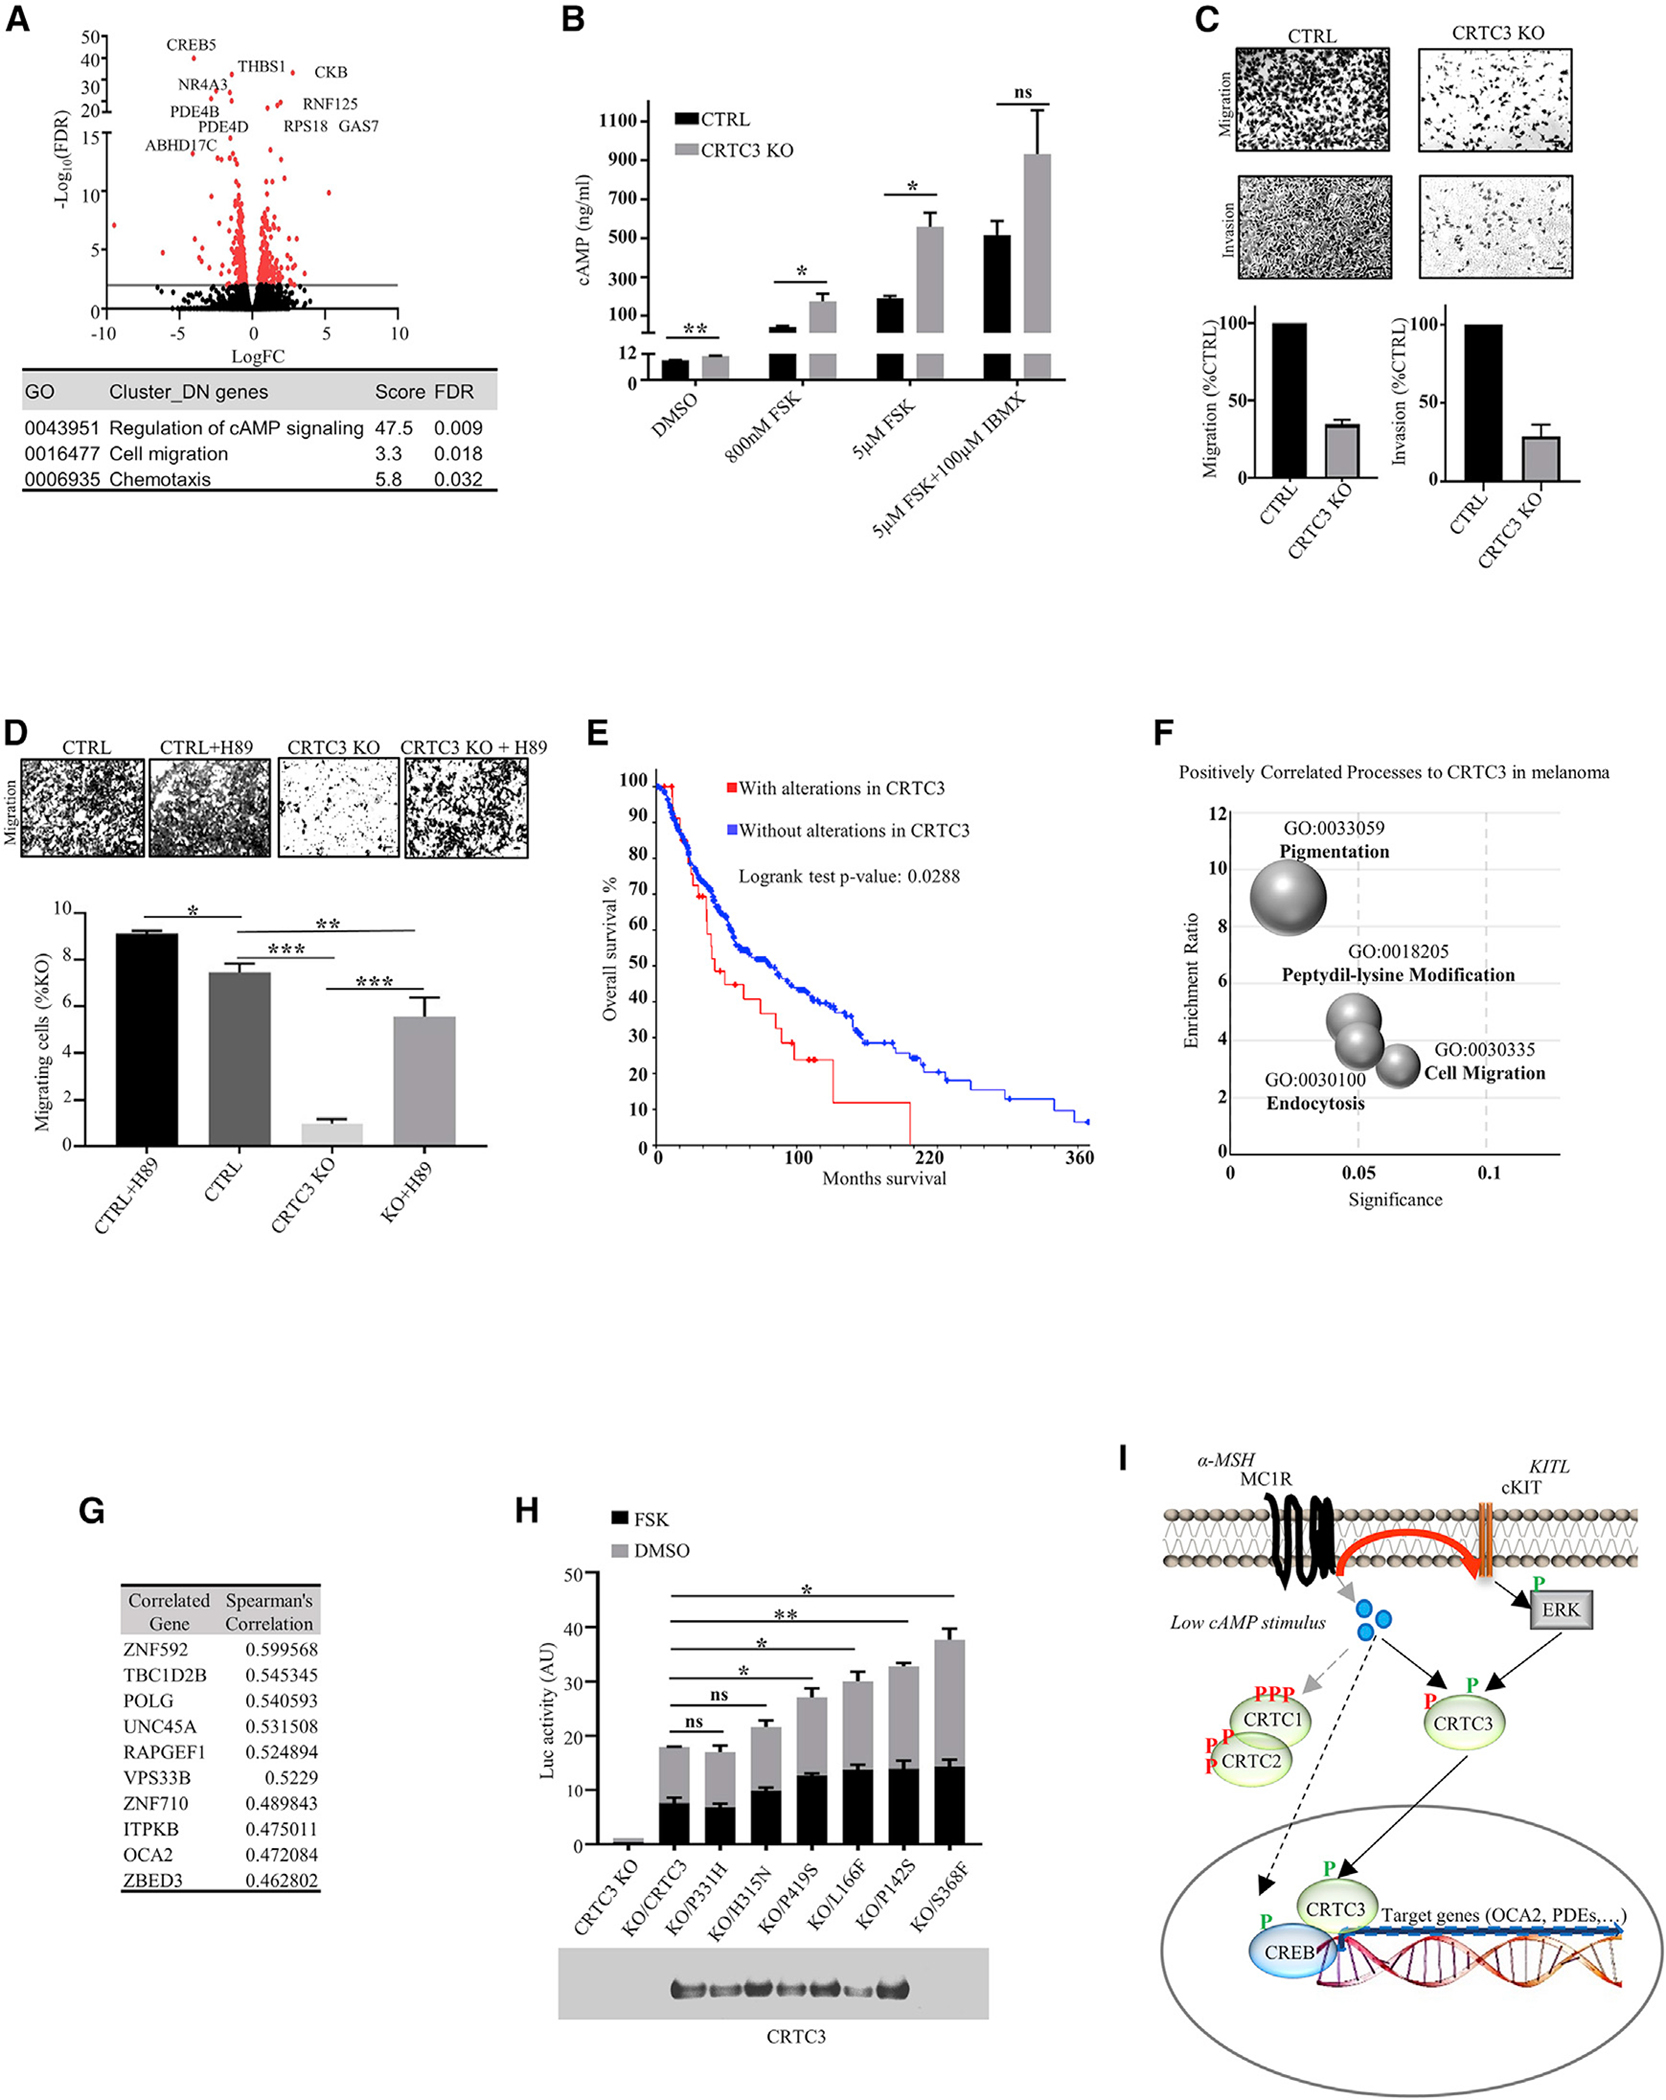
The cyclic AMP pathway promotes melanocyte differentiation by activating CREB and the cAMP-regulated transcription co-activators 1-3 (CRTC1-3). Differentiation is dysregulated in melanomas, although the contributions of CRTC proteins is unclear. We report a selective differentiation impairment in CRTC3 KO melanocytes and melanoma cells, due to downregulation of oculo-cutaneous albinism II (OCA2) and block of melanosome maturation. CRTC3 stimulates OCA2 expression by binding to CREB on a conserved enhancer, a regulatory site for pigmentation and melanoma risk. CRTC3 is uniquely activated by ERK1/2-mediated phosphorylation at Ser391 and by low levels of cAMP. Phosphorylation at Ser391 is constitutively elevated in human melanoma cells with hyperactivated ERK1/2 signaling; knockout of CRTC3 in this setting impairs anchorage-independent growth, migration, and invasiveness, whereas CRTC3 overexpression supports cell survival in response to the mitogen-activated protein kinase (MAPK) inhibitor vemurafenib. As melanomas expressing gain-of-function mutations in CRTC3 are associated with reduced survival, our results suggest that CRTC3 inhibition may provide therapeutic benefit in this setting.

Keywords: CREB; CRTC3; ERK; OCA2; cAMP; melanoma; melanosome; phospho-diesterase; pigmentation.


Conflict of interest statement

Declaration of interests The authors declare no competing interests.

Figures

Figure 1.
Figure 1.. Hypopigmentation in CRTC3 knockout mice
(A) Fur color comparison between mice with individual knockouts of CRTC family members and quantification of melanin content in dorsal hair from WT and CRTC3 KO mice (N = 3 per group, 5 months old). Significance determined by Welch’s t test. (B) Western blots from whole skin of WT and CRTC3 KO mice (post-natal day 2 [P2]) showing expression of CRTCs, melanogenic enzymes, and structural proteins. (C) Quantification of protein levels from (B). Significance determined by Welch’s t test. (D) Heatmap of significant differentially expressed genes in RNA sequencing (RNA-seq) experiments of WT and CRTC3 KO whole skins (P2, N = 4 per group). (E) Clustering of significant differentially expressed genes in RNA-seq experiments. (F) List of transporters from RNA-seq experiments shown in (E). Melanocyte-specific transporters are in bold. (G) qRT-PCR data from sorted melanoblasts of WT and CRTC3 KO mice (P2, N = 4–5 per group). Significance determined by Welch’s t test. (H) Primary melanocytes isolated from skins of WT, CRTC1 KO, CRTC2 KO, and CRTC3 KO mice (P2), cultured for 2 weeks in differentiation media containing 200 pM cholera toxin and 200 nM TPA. Arrows point to intracellular melanin granules that are absent from CRTC3 culture. Bar, 50 μm. Quantification of melanin granules in cells is shown under each panel (N = 10 cells/genotype). Granules were not detected in CRTC3 (ND); differences between WT, CRTC1 KO, and CRTC2 KO are not significant, as determined by Welch’s t test.
Figure 2.
Figure 2.. Loss of CRTC3 impairs OCA2 expression and melanosome maturation
(A) Representative western blot and melanogenesis assay in CTRL, CRTC3 KO, and CRTC3-rescued B16F1 cells following differentiation stimulus with 5 μM FSK or 100 μM 3-isobutyl-1-methylxanthine (IBMX) for 60 h. (B) Tyrosinase activity in whole lysates of B16F1 cells with indicated genotypes and treatments (5 μM FSK, 48 h; n = 3). (C) Quantification of tyrosinase activity from (B). Significance determined by one-way ANOVA and Tukey multiple comparisons tests. (D) Representative tyrosinase in-gel activity (zymography) and western blot showing TYR protein accumulation levels in B16F1 cells of indicated genotypes. Cells were treated with 5 μM FSK or 500 μM TYR inhibitor kojic acid for 48 h. (E) Representative TEM image of melanosome maturation stages in CTRL and CRTC3 KO B16F1 cells after 48 h of 5 μM FSK stimulation. Observed melanosome maturation stages are indicated with Roman lettering. Bar, 400 nm. (F) Browser plot of genomic region containing OCA2 enhancer showing occupancy of acetylated histone H3K27, CREB, CRTC3, MITF, and phospho-POLII in B16F1 cells treated with vehicle or 5 μM FSK for 1 h. Scale indicates normalized tag enrichment. (G) Time course for OCA2 mRNA and protein induction upon 5 μM FSK treatment, assayed through qRT-PCR and western blotting. n = 3. (H) Baseline rescue of melanogenesis in CRTC3 KO B16F1 cells transiently transfected with OCA2. CTRL and CRTC3 KO cells were treated with 5 μM FSK for 60 h to induce melanin synthesis. Bar, 25 μm. (I) Representative western blot of adult dorsal skin from mice of indicated CRTC genotypes showing accumulation of OCA2 and MITF. (J) Schematic representation of the conserved region of intron 86 of the HERC2 gene, containing the SNP rs12913832, which is relevant for pigmentation and melanoma risk in humans. Positions and conservation of the full CRE site and the nearest Mbox site are indicated. Validated SNP variants in the CRE site are shown and colored to indicate allelic prevalence.
Figure 3.
Figure 3.. Selective induction of CRTC3 in response to ERK1/2 activation
(A) Representative western blot showing phosphorylation of CRTC3 at Ser391 upon stimulation of ERK1/2 in B16F1 cells (SCF, stem cell factor [30 ng/ml]; HGF, hepatocyte growth factor [20 ng/ml]; TPA [200nM]). (B) Rescue of melanogenesis in CRTC3 KO B16F1 cells after transfection with indicated constructs. A scheme of the CRTC2/3 hybrid protein shows the PP2A binding domain (PP2A BD) of CRTC3 (amino acids [aa] 326–402) replacing the corresponding sequence in CRTC2 (aa 328–449). For PP2A BD sequence details, see Figure S4H. Cells were treated with 5 μM FSK for 60 h, 48 h after transfection. Melanin quantification is shown n = 3) and significance determined by one-way ANOVA and Tukey multiple comparisons tests. (C) Melanin production related to cAMP content in B16F1 cells stimulated with indicated compounds for 60 h. (n= 3). (D) Western blot of a representative sub-cellular fractionation experiment after treatment with 800 nM FSK or 30 ng/ml SCF for 20 min. (E and F) Representative western blots of indicated human cell lines in the basal state and treatment with 200 nM ERK1/2 inhibitor SCH772984 for 8 h. (G) Immunofluorescence of HEK293T and A375 cells stained with hCRTC3(414–432) antibody and 4′,6-diamidino-2-phenylindole (DAPI). Bar, 20 μM. (H) Luciferase reporter assay in A375 cells transfected with MITF proximal promoter construct (N = 3). Treatments and mutations of regulatory elements are indicated. Cells were pretreated with 200 nM ERK1/2 inhibitor SCH772984 for 6 h before adding 100 μM IBMX for 5 h. Significance was determined by two-way ANOVA and Šidák’s multiple comparisons tests.
Figure 4.
Figure 4.. CRTC3 activity is associated with increased tumorigenic potential and decreased survival
(A) Volcano plot of RNA-seq data showing differentially expressed genes between CTRL and CRTC3 KO A375 cells (n = 2/genotype). Significance determined as adjusted p ≤ 0.05 and Log2 fold changes of ≤−1 or ≥1. Table shows significant cluster enrichment of downregulated genes, listed in Table S4. (B) Quantification of cellular cAMP in CTRL and CRTC3 KO A375 cells treated with indicated compounds for 15 min (N = 3). Significance determined by Welch’s t test. (C) Representative images showing migration (24 h) and invasion (72 h) of CTRL and CRTC3 KO A375 cells (N = 3). 2% fetal bovine serum (FBS) was used as a chemotactic agent. Bar, 100μm. (D) Representative images and quantification of migration (24 h) of CRTC3 KO A375 cells treated with DMSO or PKA inhibitor H89 (10 μM). Bar, 50 μm. Significance was determined by one-way ANOVA and Tukey’s multiple comparisons tests (n = 3). (E) Kaplan-Meyer graph of the overall survival of cutaneous melanoma patients from TCGA, Firehose Legacy with and without alterations in CRTC3 (N = 367). Survival was compared by log rank tests. Graph and statistical analyses were obtained from https://cbioportal.org. All samples containing copy number alteration data were used for the analysis (N = 367/479), and expression cutoff Z score was set to 1.5. Source data are from GDAC Firehose (https://gdac.broadinstitute.org). (F) CRTC3 correlation analysis in human melanoma patients from TCGA, Firehose Legacy (N = 367). Bubble chart shows top positively enriched processes distributed by enrichment ratio and significance. (G) Top 10 genes positively correlated genes with CRTC3 from the cohort in (F). (H) Luciferase reporter assay in B16F1 cells transfected with EVX-luc-2xCRE reporter and WT or mutated CRTC3 constructs. Cells were treated with 5 μM FSK for 6 h, 48 h after transfection. Assayed patient mutations are indicated and shown on sequence alignment Figure S4H. The experiment was run five different times overall. Data represent two replicas run in parallel, with each assayed in technical duplicates and normalized by expression of transfected CRTC3. Both replicas had a comparable expression of CRTC3 constructs, of which one is shown in the western blot insert. Differences in expression of the reporter constructs were compared to WT CRTC3, and significance was determined by Welch’s t test. (I) Model for joint regulation of CRTC3 by cAMP and ERK1/2 in low cAMP state.

References

    1. Altarejos JY, and Montminy M (2011). CREB and the CRTC co-activators: sensors for hormonal and metabolic signals. Nat. Rev. Mol. Cell Biol. 12, 141–151. - PMC - PubMed
    1. Altarejos JY, Goebel N, Conkright MD, Inoue H, Xie J, Arias CM, Sawchenko PE, and Montminy M (2008). The Creb1 coactivator Crtc1 is required for energy balance and fertility. Nat. Med. 14, 1112–1117. - PMC - PubMed
    1. Andrews NC, and Faller DV (1991). A rapid micropreparation technique for extraction of DNA-binding proteins from limiting numbers of mammalian cells. Nucleic Acids Res. 19, 2499. - PMC - PubMed
    1. Bang S, Won KH, Moon H-R, Yoo H, Hong A, Song Y, and Chang SE (2017). Novel regulation of melanogenesis by adiponectin via the AMPK/CRTC pathway. Pigment Cell Melanoma Res. 30, 553–557. - PubMed
    1. Bellono NW, Escobar IE, Lefkovith AJ, Marks MS, and Oancea E (2014). An intracellular anion channel critical for pigmentation. eLife 3, e04543. - PMC - PubMed

Publication types