. 2021 May 18;35(7):109154.
doi: 10.1016/j.celrep.2021.109154.

Human telomerase is directly regulated by non-telomeric TRF2-G-quadruplex interaction

Affiliations

Human telomerase is directly regulated by non-telomeric TRF2-G-quadruplex interaction

Shalu Sharma et al. Cell Rep. .

Abstract

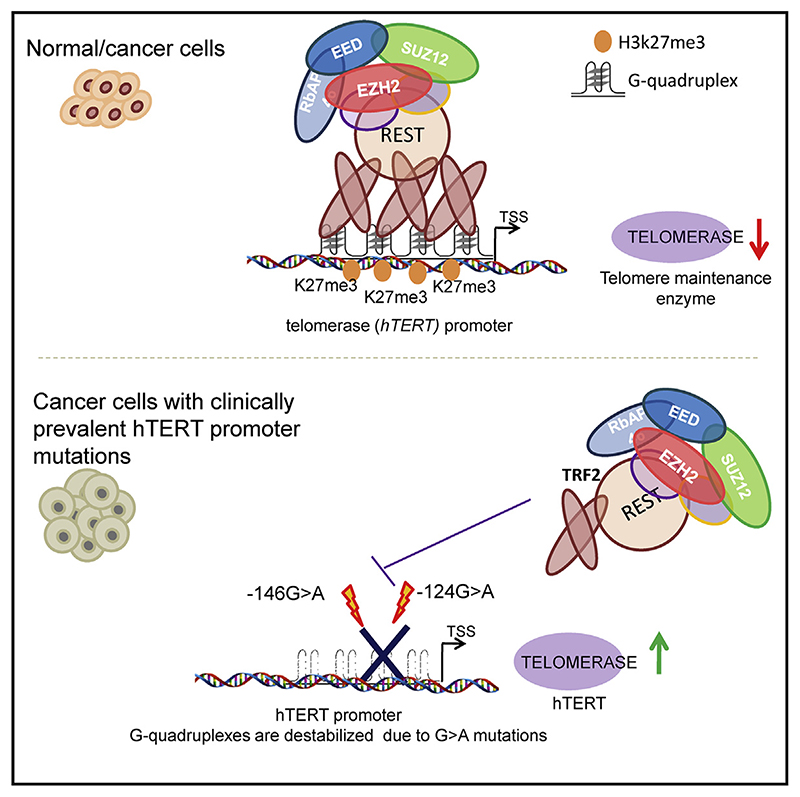
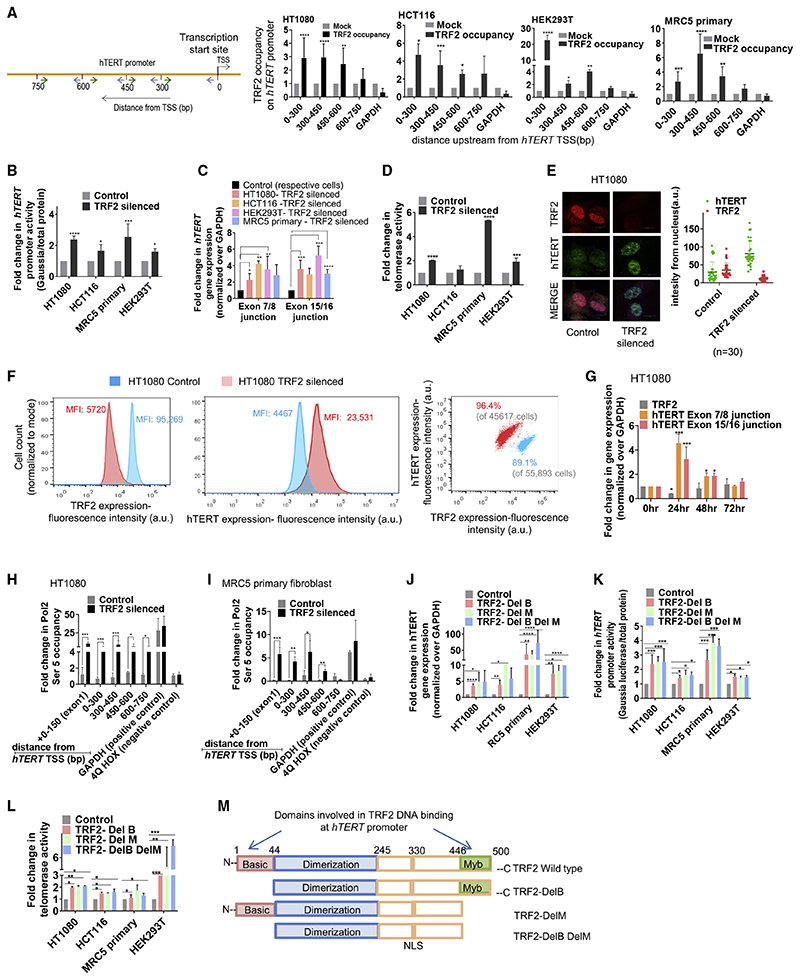
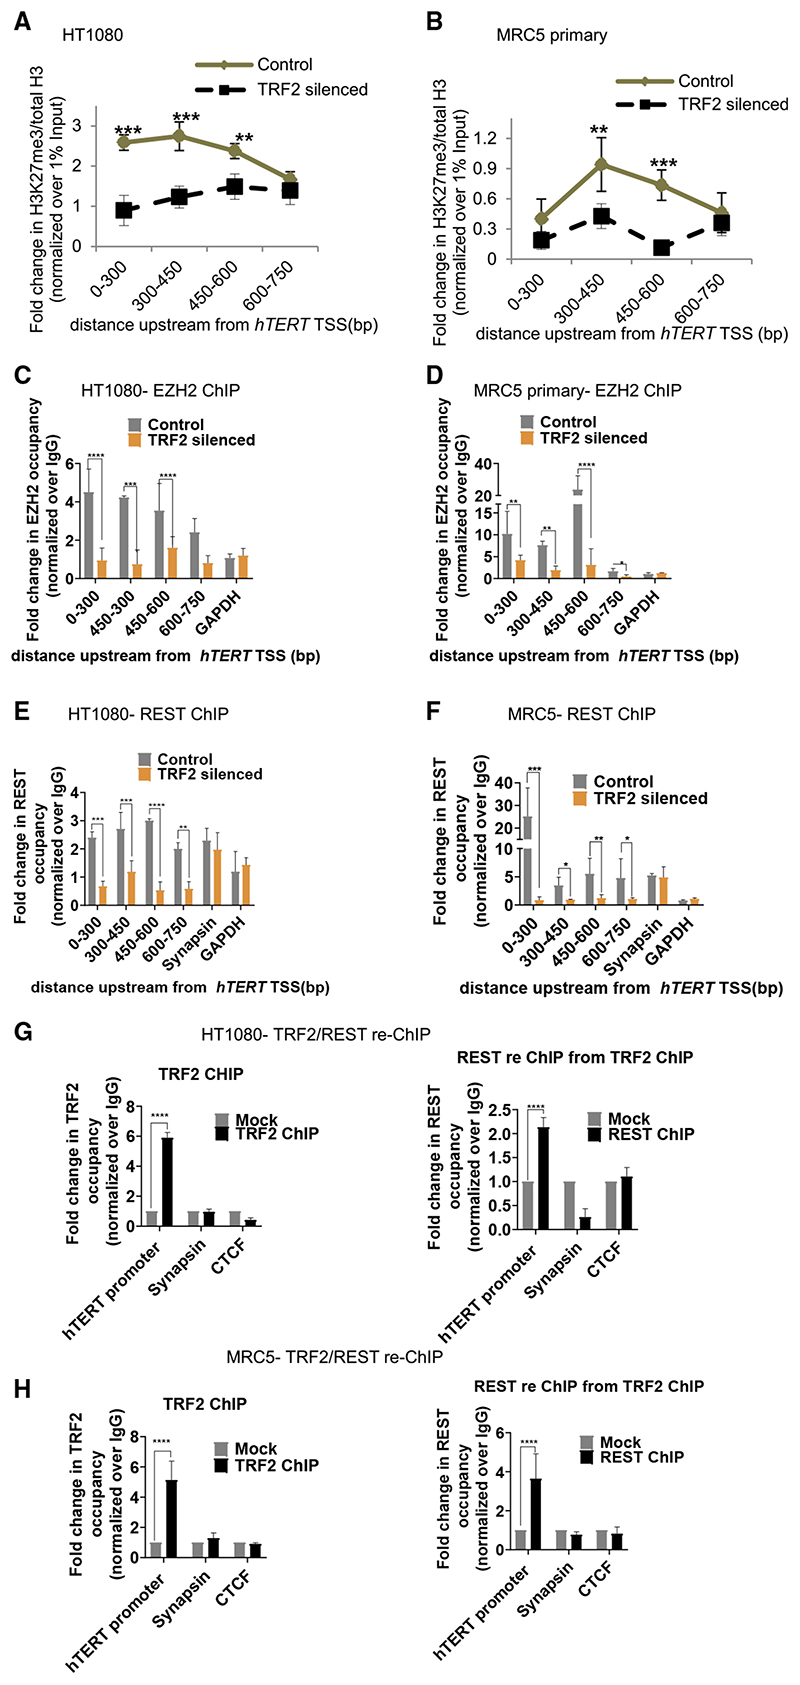
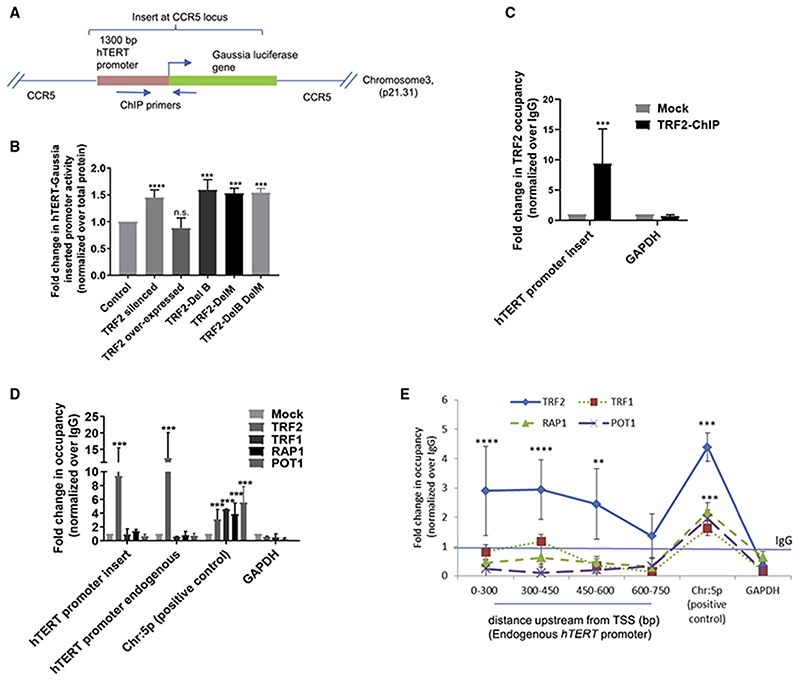
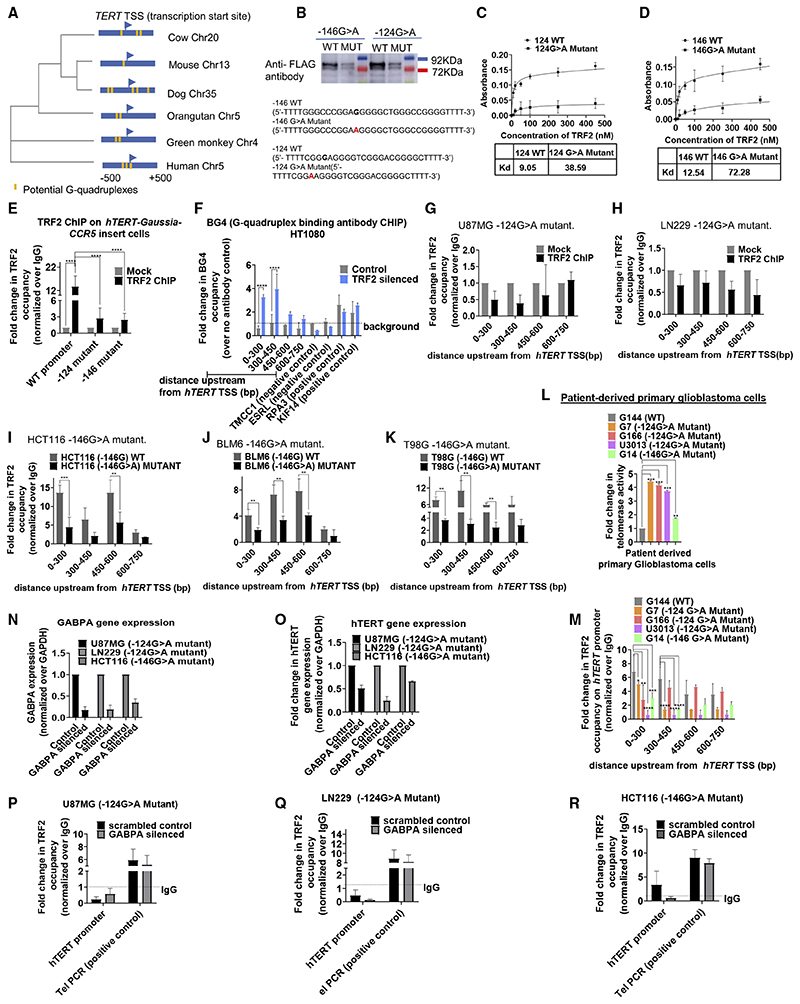
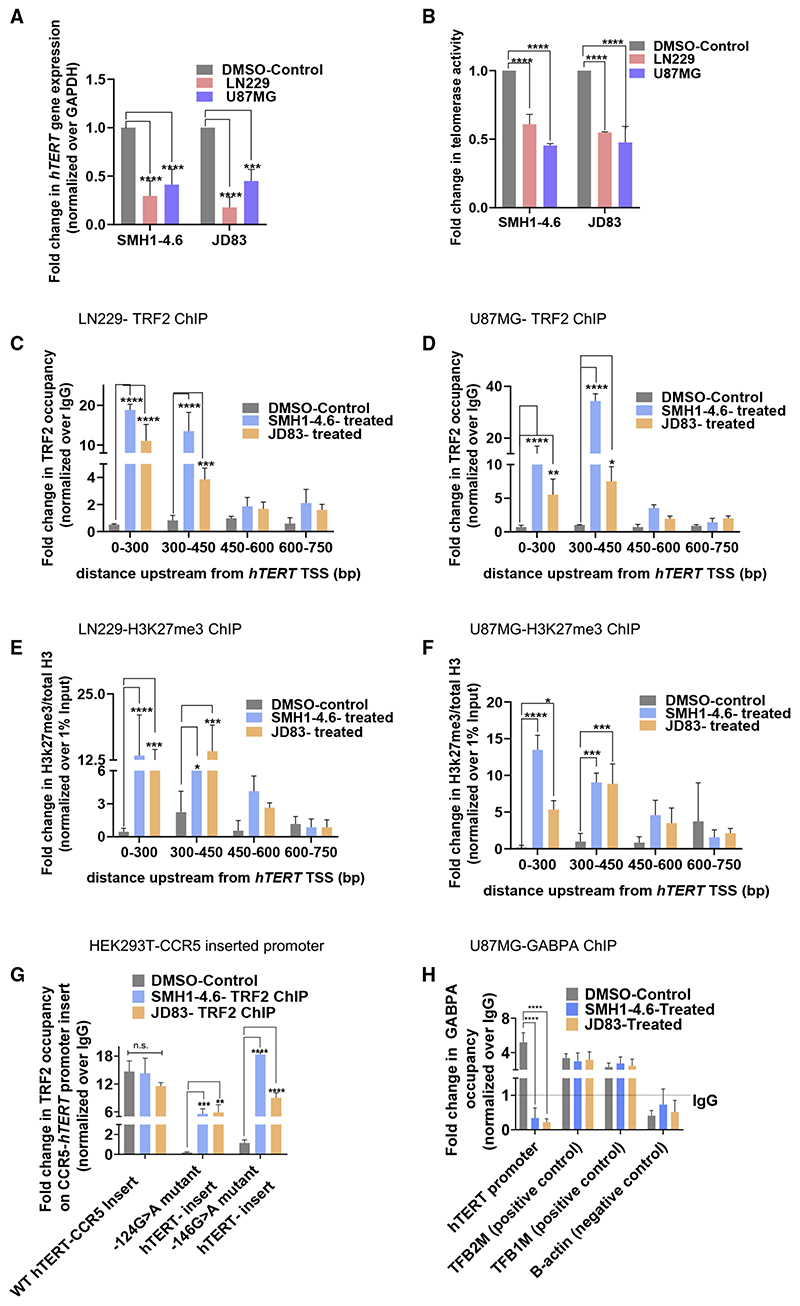
Human telomerase reverse transcriptase (hTERT) remains suppressed in most normal somatic cells. Resulting erosion of telomeres leads eventually to replicative senescence. Reactivation of hTERT maintains telomeres and triggers progression of >90% of cancers. However, any direct causal link between telomeres and telomerase regulation remains unclear. Here, we show that the telomere-repeat-binding-factor 2 (TRF2) binds hTERT promoter G-quadruplexes and recruits the polycomb-repressor EZH2/PRC2 complex. This is causal for H3K27 trimethylation at the hTERT promoter and represses hTERT in cancer as well as normal cells. Two highly recurrent hTERT promoter mutations found in many cancers, including ∼83% glioblastoma multiforme, that are known to destabilize hTERT promoter G-quadruplexes, showed loss of TRF2 binding in patient-derived primary glioblastoma multiforme cells. Ligand-induced G-quadruplex stabilization restored TRF2 binding, H3K27-trimethylation, and hTERT re-suppression. These results uncover a mechanism of hTERT regulation through a telomeric factor, implicating telomere-telomerase molecular links important in neoplastic transformation, aging, and regenerative therapy.

Keywords: G-quadruplexe; PRC2; REST; cancer; epigentics; glioblastoma; hTERT promoter mutations; shelterin proteins; telomerase; telomere repeat binding factor.


Conflict of interest statement

Declaration of interests S.C. is a scientific advisor for Rejuvas Biotech India Pvt. Ltd.

Figures

Graphic abstract
Graphic abstract
Schematic representation of sample collection and analysis. The figure was created using BioRender.com
Figure 1
Figure 1. TRF2 binds at the hTERT promoter and transcriptionally represses hTERT
(A) Scheme showing the hTERT promoter with position of primers designed for ChIP-qPCR (quantitative real-time PCR from ChIP DNA) (indicated by arrows) spanning from 0 to –750 bp of TSS, TRF2 ChIP followed by hTERT promoter-spanning qPCR for TRF2 binding in cancer (HT1080 and HCT116), and MRC5 and HEK293T cells relative to immunoglobulin G (IgG) ChIP (Mock) (see STAR Methods for detail on ChIP DNA qPCR data analysis). (B) Effect of siRNA-induced TRF2 silencing on hTERT promoter activity in cells 48 h after transfection; +33 to –1,267 bp hTERT promoter cloned upstream of Gaussia luciferase. Cells treated with scrambled siRNA as control. (C) Effect of TRF2 silencing on hTERT expression; functional (exon 7/8) and full (exon 15/16) transcripts. Fold change normalized over respective cells treated with scrambled siRNA control. (D) Effect of TRF2 silencing on telomerase activity quantified using telomerase-repeat-amplification-protocol (TRAP) followed by ELISA (see STAR Methods); signal normalized over scrambled treated cells (control). HCT116 cells had relatively high telomerase activity in control than other cells, and the increase following TRF2-silencing was modest. (E) Immunofluorescence staining of hTERT and TRF2 protein in HT1080 cells. TRF2 and hTERT were stained using Alexa fluor-594 (red signal) and Alexa fluor-498 (green signal), respectively. Quantification of nuclear signal (marked by DAPI, blue) from 30 cells (n = 30) shown in respective right panels. (F) Flow cytometry using dual staining for hTERT and TRF2 in HT1080 control (scrambled siRNA-treated) and TRF2-silenced cells. Mean intensity of fluorescence (MIF) for hTERT and TRF2 is shown (left and center panel); right panel shows total cell populations monitored: 89.1% of 55,893 cells were analyzed (gated) for control (scrambled treated) cells (with higher TRF2 and relatively low hTERT); 96.4% of 45,617 cells were analyzed for TRF2-silenced cells (lower TRF2 and relatively high hTERT). The cell counts were normalized to respective modes for comparative representation in the left and center panels. (G) Expression of TRF2 and hTERT(exon7/8 and exon15/16) 24,48, and 72 h following TRF2 siRNA treatment in HT1080 cells. The siRNA complex was removed 6 h after initial transfection. (H and I) Pol2 (Ser5) occupancy spanning hTERT promoter following TRF2 silencing in HT1080 (H) and MRC5 cells (I). Cells treated with scrambled siRNA as control. (J–L) Expression of the full-length hTERT transcript (exon 15/16) (J) and hTERT promoter activity (K) and telomerase activity (L) following expression of TRF2 deletion mutants. Results were normalized to untransfected control cells in each case. (M) Scheme showing the full-length and mutant forms of TRF2 used in the study. All error bars represent ± SDs from mean. p values calculated by paired/unpaired t test and two-way ANOVA in (G) and (J)–(L) (*p < 0.05, **p < 0.01, ***p < 0.005, ****p < 0.0001).
Figure 2
Figure 2. TRF2 recruits the polycomb repressor complex (PRC2) at the hTERT promoter
(A and B) Effect of TRF2 silencing on H3K27me3 occupancy (ChIP-qPCR) spanning 0–750 bpofthe hTERT promoterHT1080 (A) and MRC5 (B) cells. Fold change represented as H3K27me3 ChIP over total H3 ChIP, normalized to 1% input in respective cases (see STAR Methods for detail). (C and D) EZH2 occupancy on the hTERT promoter (spanning 0–750 bp) on silencing TRF2 in HT1080 (C) and MRC5 cells (D). Scrambled siRNA-treated cells as control. (E and F) REST occupancy on the hTERT promoter on silencing TRF2 in HT1080 (E) and MRC5 (F) cells. Synapsin promoter reported for REST binding was used as control forTRF2-inde-pendent REST occupancy. Scrambled siRNA-treated cells as control. (G and H) TRF2 ChIP followed by REST re-ChIP: TRF2 ChIP (left panel) and REST re-ChIP (right panel) in HT1080 (G) and MRC5 (H) cells at the hTERT core promoter (+38 to −237 bp). Sya-napsin, where REST binding is independent of TRF2 used as control for TRF2-REST co-binding in TRF2/REST-re-ChIP. GAPDH across replicates was not detectable following reChIP therefore CTCF used as negative control for reChIP experiments. All error bars represent ± SDs from mean values; p values calculated by paired/unpaired t test, for (A)–(F) two-way ANOVA was used (*p < 0.05, **p < 0.01, ***p < 0.005, ****p < 0.0001).
Figure 3
Figure 3. TRF2 binding on hTERT promoter is independent of telomeres
(A) Scheme showing insertion of Gaussia luciferase downstream ofthe hTERT promoter (+33 to –1,267 bp) at CCR5 locus using CRISPR/Cas9-mediated editing in HEK293T cells (see Supplemental information for characterization of cells). Position of primers designed for ChIP-qPCR indicated by arrows. (B) Effect of TRF2 silencing or expression of full-length TRF2 or TRF2-deletion mutants TRF2-DelB, TRF2-DelM, and TRF2-DelB-DelM on hTERT-promoter Gaussia luciferase activity relative to untreated control cells. Normalized using total protein in each case. (C) qPCR following TRF2 ChIP at the inserted-hTERT promoter at CCR5 locus using primers shown in scheme above (A); normalized over mock (IgG). GAPDH promoter was used as negative control for TRF2 occupancy. (D and E) qPCRfollowing ChIPforTRF1, POT1, and RAP1: at the CCR5-locus-inserted-hTERT promoterand the endogenous hTERT promoter (+38to −237 bp) in HEK293T cells(D) and spanningthe endogenous hTERT promoter in HT1080cells (E). Chromosome 5p region 100 kb downstream ofthehTERT locus reported for physical association with telomeres by looping was used as positive control and GAPDH as negative control. All error bars represent ± SDsfrom mean values; pvalues calculated by paired/unpairedttest; for(B), (D), and (E) two-wayANOVAwas used (*p < 0.05, **p < 0.01, ***p < 0.005, ****p < 0.0001).
Figure 4
Figure 4. TRF2-induced repression of hTERT is G-quadruplex-dependent
(A) Phylogenetic tree based on the sequence spanning ±500 bp of the TERT TSS across vertebrates. Presence and position of putative G-quadruplexes (configuration: stem of three Gs and loop size up to 15 bases) in respective organisms is shown in yellow. (B) Oligonucleotide pull-down from cell lysate of HT1080 cells expressing FLAG-tagged TRF2; 5’-biotin-tagged oligonucleotides from hTERT wild-type (WT) or with mutations (MUT) at the −124th or −146th position were used for pull-down followed by western blot and probed using anti-FLAG antibody. Sequence of respective WT or MUT (base substitution shown in red), with Illi overhangs to minimize steric interactions because of biotin or on ELISA plate (C and D below) given in the bottom panel. (C and D) ELISA experiments using biotin-tagged hTERT promoter oligonucleotides for WT and the corresponding G > A mutation and increasing concentrations of purified TRF2 protein, WT with −124G > A mutant (C), and WT with corresponding 146G > A mutation (D). Significance for each point was calculated by paired t test, p value across all was p < 0.0001 in both (C) and (D). (E) qPCR following TRF2 ChIP at the exogenously inserted WT or with −124/−146G > A mutation, hTERT promoter at the CCR5 locus in HEK293T cells relative to IgG (Mock). Scheme of the inserted hTERT promoter with ChIP-qPCR primer positions as in Figure 3A. (F) qPCR following BG4 ChIP at the hTERT promoter spanning up to 750 bp upstream of TSS: fold-change in BG4 occupancy over experiment using no-antibody control (as per manufacturer’s protocol) shown in TRF2-silenced or scrambled siRNA-treated HT1080 cells (control). Positive and negative controls for BG4 antibody were used as reported earlier. (G and H) TRF2 ChIP-qPCR spanning 0–750 bp upstream of the hTERT promoter in glioblastoma U87MG (G) and LN229 (H) cell lines with −124G > A promoter mutation relative to IgG ChIP (Mock). (I–K) TRF2 ChIP-qPCR spanning the hTERT promoter in cancer cell lines with or without the −146G > A promoter mutation: HCT116 cells (I), BLM6 cells (J), or T98G cells (K). Normalized over respective IgG ChIPs (see STAR Methods for details on data analysis). Single base substitutions were made in each case using CRISPR/Cas9-mediated editing. (Land M) Telomerase activity quantified by ELISA TRAP (see STAR Methods) (L) and TRF2 ChIP-qPCR spanning the hTERT promoter in patient-derived primary glioblastoma cells (M): G144 (wild-type hTERT promoter); G7, G166, U3013 (−124G > A mutant hTERT promoter); and G4 (−146G > A mutant hTERT promoter). (N and O) GABPA (N) and hTERT (O) gene expression following GABPA silencing using qRT-PCR relative to scrambled siRNA control. (P–R) TRF2 ChIP followed by ChIP-qPCR for TRF2 occupancy at the hTERT mutant promoter following GABPA silencing in U87MG −124G > A mutant (P), LN229 −124G > A mutant (Q), or HCT116 −146G > A(R) mutant cells. All error bars represent ± SDs from mean values. p values calculated by paired/unpaired t test, for (C)–(F), (L), and (M) two-way ANOVA was used (*p < 0.05, **p < 0.01, ***p < 0.005, ****p < 0.0001).
Figure 5
Figure 5. G-quadruplex-binding ligands re-suppress activated hTERT in glioblastoma multiforme with mutations in the hTERT promoter
(A and B) hTERT expression (A) and telomerase activity (B) in glioblastoma multiforme (GBM) cell lines U87MG and LN229 (with −124G > A hTERT promoter mutation) following treatment with G-quadruplex-binding ligands SMH1−4.6 and JD83 (2.5 μM) or DMSO for 24 h. (C and D) TRF2 ChIP-qPCR spanning the hTERT promoter following treatment with SMH1−4.6 and JD83 (2.5 μM) or DMSO for 24 h in LN229 (C) or U87MG (D) cells. (E and F) Fold change in repressor histone mark H3K27me3 by ChIP-qPCR spanning the hTERT promoter following treatment with SMH1−4.6 and JD83 (2.5 μM) or DMSO for 24 h in LN229 (E) or U87MG (F) cells. Fold-change shown with respect to total H3 ChIP; respective ChIPs were normalized to 1% input. (G) TRF2 ChIP-qPCR at the exogenously inserted CCR5-locus-hTERT promoter with either the wild-type or −124G/−146G > A hTERT promoter mutations in HEK293T cells following treatment with SMH1−4.6 and JD83 (2.5 μM) or DMSO-treated (control) for 24 h. Normalized to IgG ChIP in each case. (H) GABPA ChIP followed by qPCR at the hTERT core-promoter (+38 to −237 bp); in U87MG (−124G > A mutant) cells following treatment with SMH1−4.6 and JD83 (2.5 μM) or DMSO (control) for 24 h. Normalized to IgG in each case. TFB1M and TFB2M are positive control and B-actin is negative control for GABPA ChIP. All error bars represent ± SDs from mean values. p values calculated by paired/unpaired t test or two-way ANOVA (*p < 0.05, **p < 0.01, ***p < 0.005, ****p < 0.0001).

References

    1. Abbas T, Dutta A. p21 in cancer: intricate networks and multiple activities. Nat Rev Cancer. 2009;9:400–414. - PMC - PubMed
    1. Aguado T, Gutiérrez FJ, Aix E, Schneider RP, Giovinazzo G, Blasco MA, Flores I. Telomere Length Defines the Cardiomyocyte Differentiation Potency of Mouse Induced Pluripotent Stem Cells. Stem Cells. 2017;35:362–373. - PubMed
    1. Ak?nc?lar SC, Khattar E, Boon PLS, Unal B, Fullwood MJ, Ter-gaonkar V. Long-Range Chromatin Interactions Drive Mutant TERT Promoter Activation. Cancer Discov. 2016;6:1276–1291. - PubMed
    1. Arnoult N, Karlseder J. Complex interactions between the DNA-damage response and mammalian telomeres. Nat Struct Mol Biol. 2015;22:859–866. - PMC - PubMed
    1. Artandi SE, DePinho RA. Telomeres and telomerase in cancer. Carcinogenesis. 2010;31:9–18. - PMC - PubMed

Publication types