. 2021 Aug;49(8):706-717.
doi: 10.1124/dmd.120.000341. Epub 2021 May 19.

Negative Regulation of Human Hepatic Constitutive Androstane Receptor by Cholesterol Synthesis Inhibition: Role of Sterol Regulatory Element Binding Proteins

Affiliations

Negative Regulation of Human Hepatic Constitutive Androstane Receptor by Cholesterol Synthesis Inhibition: Role of Sterol Regulatory Element Binding Proteins

Liberta Cuko et al. Drug Metab Dispos. 2021 Aug.

Abstract

The squalene synthase inhibitor squalestatin 1 (Squal1) is a potent and efficacious inducer of CYP2B expression in primary cultured rat hepatocytes and rat liver. To determine whether Squal1 is also an inducer of human CYP2B, the effects of Squal1 treatment were evaluated in primary cultured human hepatocytes, differentiated HepaRG cells, and humanized mouse livers. Squal1 treatment did not increase CYP2B6 mRNA levels in human hepatocytes or HepaRG cells and only slightly and inconsistently increased CYP2B6 mRNA content in humanized mouse liver. However, treatment with farnesol, which mediates Squal1's effect on rat CYP2B expression, increased CYP2B6 mRNA levels in HepaRG cells expressing the constitutive androstane receptor (CAR), but not in cells with knocked-down CAR. To determine the impact of cholesterol biosynthesis inhibition on CAR activation, the effects of pravastatin (Prava) were determined on CITCO-mediated gene expression in primary cultured human hepatocytes. Prava treatment abolished CITCO-inducible CYP2B6 expression, but had less effect on rifampicin-mediated CYP3A4 induction, and CITCO treatment did not affect Prava-inducible HMG-CoA reductase (HMGCR) expression. Treatment with inhibitors of different steps of cholesterol biosynthesis attenuated CITCO-mediated CYP2B6 induction in HepaRG cells, and Prava treatment increased HMGCR expression and inhibited CYP2B6 induction with comparable potency. Transfection of HepG2 cells with transcriptionally active sterol regulatory element binding proteins (SREBPs) reduced CAR-mediated transactivation, and inducible expression of transcriptionally active SREBP2 attenuated CITCO-inducible CYP2B6 expression in HepaRG cells. These findings suggest that Squal1 does not induce CYP2B6 in human hepatocytes because Squal1's inhibitory effect on cholesterol biosynthesis interferes with CAR activation. SIGNIFICANCE STATEMENT: The cholesterol biosynthesis inhibitor squalestatin 1 induces rat hepatic CYP2B expression indirectly by causing accumulation of an endogenous isoprenoid that activates the constitutive androstane receptor (CAR). This study demonstrates that squalestatin 1 does not similarly induce CYP2B6 expression in human hepatocytes. Rather, inhibition of cholesterol biosynthesis interferes with CAR activity, likely by activating sterol regulatory element binding proteins. These findings increase our understanding of the endogenous processes that modulate human drug-metabolizing gene expression.


Figures

Fig. 1.
Fig. 1.
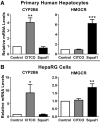
Effects of Squal1 treatment on CYP2B6 and HMGCR mRNA levels in primary cultured human hepatocytes and HepaRG cells. Six preparations of primary cultured human hepatocytes (A) and 6 batches of HepaRG cells (B) were incubated for 48 hours in medium alone (untreated control) or containing 0.1% DMSO (DMSO control), 0.1 µM CITCO, or 0.1 µM Squal1, after which cells were harvested, and CYP2B6 and HMGCR mRNA levels were measured. For each preparation/batch of cells, the mRNA level for the CITCO treatment group was normalized to the mRNA level for the DMSO control group, and the Squal1 group was normalized to the untreated control group. The data are then presented as mean fold of control ± S.E.M. (n = 6). *Significantly different from the theoretical value of 1, P < 0.05; **P < 0.01; ***P < 0.001 by one-sample t test.
Fig. 2.
Fig. 2.
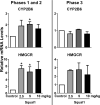
Effects of Squal1 treatment on CYP2B6 and HMGCR mRNA levels in mice with humanized livers. Mice with humanized livers were treated for 5 days with saline (control) or with 2.5, 5, or 10 mg/kg Squal1. After treatment, livers were dissected, and CYP2B6 and human HMGCR mRNA levels were measured. The data shown in the left-hand side of the figure are from two experimental phases (1 and 2), which were performed using the same batch of human hepatocytes, and the data shown in the right-hand side of the panel are from phase 3, which was performed using a different batch of human hepatocytes. Within each phase, the hepatic mRNA levels from the Squal1-treated mice were normalized to the mean control mRNA level. The data for the Squal1 treatment groups are then presented as mean fold of control ± S.E.M. (for phases 1 and 2, n = 4, *significantly different from the theoretical value of 1 by one-sample t test, P < 0.05) or ± range (for phase 3, n = 2, statistical analysis not performed).
Fig. 3.
Fig. 3.
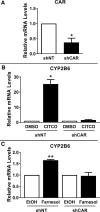
Effect of CAR knockdown on CITCO- and farnesol-inducible CYP2B6 mRNA levels in HepaRG cells. Differentiated HepaRG cells stably expressing an shNT or shCAR were (A) incubated for 48 hours with medium, (B) treated for 48 hours with 0.1% DMSO or 0.1 µM CITCO, or (C) treated for 48 hours with 01% ethanol (EtOH) or 100 µM farnesol and harvested for measurement of CAR (A) or CYP2B6 (B and C) mRNA levels. For each experiment, the mRNA levels of the experimental groups (black bars) were normalized to the corresponding control groups (white bars), and the data are presented as mean fold of control ± S.E.M. (n = 4 batches of cells for A; n = 3 for B and C). *Significantly different from the theoretical value of 1, P < 0.05; **P < 0.01 by one-sample t test.
Fig. 4.
Fig. 4.
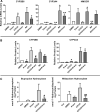
Effects of Prava on CITCO-mediated CYP2B6 induction and Rif-mediated CYP3A4 induction in primary cultured human hepatocytes. (A) Seven preparations of primary cultured human hepatocytes were treated for 48 hours with 0.1% DMSO, 10 µM Prava (DMSO added to bring DMSO concentration to 0.1% in all treatment groups), 0.1 µM CITCO (alone or with Prava), or 10 µM Rif (alone or with Prava) and harvested for measurement of CYP2B6, CYP3A4, and HMGCR mRNA levels. (B) Three preparations of primary cultured human hepatocytes were treated as described for panel A and harvested for targeted measurement of microsomal CYP2B6 and CYP3A4 protein concentrations by nanoLC-MS/MS. SIL peptide standards employed in the measurement and MRMs acquired are shown in Supplemental Table 3. For each hepatocyte preparation, mRNA or protein levels for the various treatment groups were normalized to the level for the DMSO control group. The data are then presented as mean fold of control ± S.E.M. *Significantly different from the theoretical value of 1, P < 0.05; **P < 0.01; ***P < 0.001 by one-sample t test. #Significantly different from the CITCO-treated group, P < 0.05 by one-way ANOVA, and Sidak’s MCT. (C) Primary cultured human hepatocytes were treated with DMSO, Prava, CITCO, or CITCO and Prava as described for panel A, after which they were incubated with medium containing bupropion or midazolam as described in Materials and Methods. The medium samples were then collected and analyzed for concentrations of 6-hydroxybupropion or 1′-hydroxymidazolam. Data are from one human hepatocyte preparation and are shown as mean 6-hydroxybupropion or 1′-hydroxymidazolam concentration (nmol per mg cellular protein) ± S.D. (n = three wells of hepatocytes).#Significantly different from the CITCO-treated group, P < 0.05; ##P < 0.01 by one-way ANOVA and Tukey’s MCT.
Fig. 5.
Fig. 5.
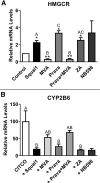
Effects of sterol synthesis inhibitor treatments on HMGCR expression and CITCO-mediated CYP2B6 induction in HepaRG cells. HepaRG cells were incubated for 48 hours in medium alone or containing 0.1% DMSO, 0.1 µM Squal1, 10 mM MVA, 10 µM Prava, Prava and MVA, 10 µM zoledronic acid (ZA), or 1 µM NB-598, each treatment alone or in combination with 0.1 µM CITCO. After treatment, the cells were harvested, and HMGCR and CYP2B6 mRNA levels were measured. (A) Effects of sterol synthesis inhibitor treatments on HMGCR reductase mRNA levels. For each batch of cells, the mRNA levels for the sterol synthesis inhibitor treatments were normalized to the untreated or DMSO control group as appropriate, and the data are then presented as mean fold of control ± S.E.M. (n = 3 cell batches), except for the NB-598 group, where the data are presented as mean fold of control ± range (n = 2). *Significantly different from the theoretical value of 1, P < 0.05; **P < 0.01 by one-sample t test. Groups not sharing a letter are significantly different from each other by one-way ANOVA and Tukey’s MCT, P < 0.05 (ANOVA did not include control or NB-598 groups). (B) Effects of the sterol synthesis inhibitor treatments in the presence of CITCO on CYP2B6 mRNA levels. Data are expressed as mean percentages of the CITCO-treated group ± S.E.M. (n = 3), except for the CITCO and NB-598 group (mean ± range, n = 2). Groups not sharing a letter are significantly different from each other by one-way ANOVA and Tukey’s MCT, P < 0.05 (ANOVA did not include NB-598 group).
Fig. 6.
Fig. 6.
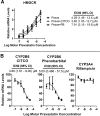
Concentration-dependent effects of Prava treatment on HMGCR expression and CYP2B6 and CYP3A4 induction in HepaRG cells. HepaRG cells were incubated for 48 hours in medium alone (untreated) or containing 0.1% DMSO, 0.1 µM CITCO, 100 µM PB, 30 µM Rif, or 0.1 to 30 µM Prava alone or in combination with CITCO, PB, or Rif. After treatment, cells were harvested, and CYP2B6, CYP3A4, and HMGCR mRNA levels were measured. (A) Concentration-response curves for Prava-inducible HMGCR expression, alone or in the presence of CITCO or PB. Data are presented as fold-increases relative to the appropriate control group (i.e., untreated for Prava and Prava + PB; DMSO for Prava + CITCO) ± S.E.M. (n = 3 cell batches). EC50 values with 95% confidence intervals (CIs) are shown. (B) Concentration-response curves for Prava-mediated inhibition of CITCO- or PB-mediated CYP2B6 induction or Rif-mediated CYP3A4 induction. Data are presented as mean percentages of the mRNA levels measured in the groups treated with CITCO, PB, or Rif alone ± S.E.M. (n = 3). IC50 values with 95% CIs are shown.
Fig. 7.
Fig. 7.
Effects of SREBP cotransfection on human CAR1 activity. HepG2 cells were transiently cotransfected with 5–100 ng of plasmid expressing the transcriptionally active form of SREBP1a, SREBP1c, or SREBP2 (or with pcDNA3.1 as empty expression vector control) and a CAR-responsive luciferase reporter plasmid, alone or in combination with 25 ng of a plasmid expressing human constitutive androstane receptor (hCAR1). At 48 hours after transfection, cells were harvested for measurement of luciferase activities. Data are presented as mean ± S.D. normalized (firefly/Renilla) luciferase activities relative to the activity measured in cells transfected with 5 ng pcDNA3.1 without hCAR1 (n = 6 wells per group, derived from combining data from two independent experiments each with triplicate transfections). *Significantly different from the corresponding pcDNA3.1 or pcDNA3.1 + hCAR1 group transfected with the same amount of plasmid, P < 0.05; **P < 0.01; ***P < 0.001. #Significantly different from group transfected with 5 ng of the same expression plasmid, P < 0.5; ##P < 0.01; ###P < 0.001 by two-way ANOVA and Tukey’s MCT.
Fig. 8.
Fig. 8.
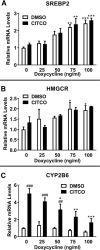
Effects of doxycycline-inducible expression of SREBP2 on HMGCR and CITCO-inducible CYP2B6 expression in HepaRG cells. HepaRG cells engineered for doxycycline-inducible expression of active SREBP2 transcription factor were incubated for 48 hours in medium alone (0 ng/mg doxycycline) or containing 25–100 ng/ml doxycycline. During the last 24 hours of that 48-hour incubation, half of the cells receiving each concentration of doxycycline were cotreated with 0.1% DMSO (white bars) and the other half were cotreated with 0.1 µM CITCO (black bars). After treatment, cells were harvested and SREBP2 (A), HMGCR (B), and CYP2B6 (C) mRNA levels were measured. In each experiment, mRNA levels in the various treatment groups were normalized to levels in untreated cells. Data are presented as mean fold of the 0 ng/ml doxycycline + DMSO treatment group ± S.E.M. (n = 3 cell batches). *Significantly different from the corresponding group treated with 0 ng/ml doxycycline and the same chemical (i.e., DMSO or CITCO), P < 0.05; **P < 0.01; ***P < 0.001 by two-way ANOVA and Tukey’s MCT. ##Significantly different from the corresponding DMSO-treated group that received the same amount of doxycycline, P < 0.01; ###P < 0.001 by two-way ANOVA and Sidak’s MCT.
Fig. 9.
Fig. 9.
Cholesterol biosynthetic pathway focusing on the mevalonate/isoprenoid portion and highlighting metabolites, enzyme inhibitor sites of action, and transcription factors that are relevant to this study. Cholesterol biosynthesis inhibitors are shown in italicized purple text, and their corresponding target enzymes are shown in italicized brown text. Featured metabolites (MVA, FPP, and farnesol) and transcription factors (SREBP2 and CAR) are boxed. Green arrows represent activation, and red T-shaped symbols represent inhibition. Under basal conditions, FPP is converted primarily to squalene, which is subsequently converted to cholesterol, which inhibits the activation of SREBPs. FPP is also converted to such nonsterol isoprenoids as ubiquinone, dolichol, and dolichyl phosphate, but little FPP is dephosphorylated to farnesol under basal conditions. Inhibition of cholesterol biosynthesis with any of the indicated compounds reduces cellular cholesterol levels, which causes SREBP activation and upregulation of many cholesterol biosynthetic pathway genes (indicated by the thick green arrow). Specific inhibition of squalene synthase (e.g., by Squal1) causes both decreased cholesterol biosynthesis (thereby activating SREBPs) and accumulation of FPP, much of which is dephosphorylated to farnesol, which is subsequently converted to progressively oxidized metabolites (i.e., farnesal, farnesoic acid, and several dicarboxylic acids). We propose that farnesol is an endogenous activator of both rat and human CAR. However, Squal1 treatment only causes activation of rat CAR because in human hepatocytes, the activated SREBPs exert a suppressive effect on CAR.

References

    1. Auerbach SS, Ramsden R, Stoner MA, Verlinde C, Hassett C, Omiecinski CJ (2003) Alternatively spliced isoforms of the human constitutive androstane receptor. Nucleic Acids Res 31:3194–3207. - PMC - PubMed
    1. Chen Y, Ferguson SS, Negishi M, Goldstein JA (2003) Identification of constitutive androstane receptor and glucocorticoid receptor binding sites in the CYP2C19 promoter. Mol Pharmacol 64:316–324. - PubMed
    1. Dong BSaha PKHuang WChen WAbu-Elheiga LAWakil SJStevens RDIlkayeva ONewgard CBChan L, et al. (2009) Activation of nuclear receptor CAR ameliorates diabetes and fatty liver disease. Proc Natl Acad Sci USA 106:18831–18836. - PMC - PubMed
    1. Dubaisi S, Barrett KG, Fang H, Guzman-Lepe J, Soto-Gutierrez A, Kocarek TA, Runge-Morris M (2018) Regulation of cytosolic sulfotransferases in models of human hepatocyte development. Drug Metab Dispos 46:1146–1156. - PMC - PubMed
    1. Duniec-Dmuchowski Z, Fang HL, Strom SC, Ellis E, Runge-Morris M, Kocarek TA (2009) Human pregnane x receptor sctivation and CYP3A4/CYP2B6 induction by 2,3-oxidosqualene:lanosterol cyclase inhibition. Drug Metab Dispos 37:900–908. - PMC - PubMed

Publication types

MeSH terms