. 2021 May 19;4(1):595.
doi: 10.1038/s42003-021-02119-9.

CD28 engagement inhibits CD73-mediated regulatory activity of CD8+ T cells

Affiliations

CD28 engagement inhibits CD73-mediated regulatory activity of CD8+ T cells

Yo-Ping Lai et al. Commun Biol. .

Abstract

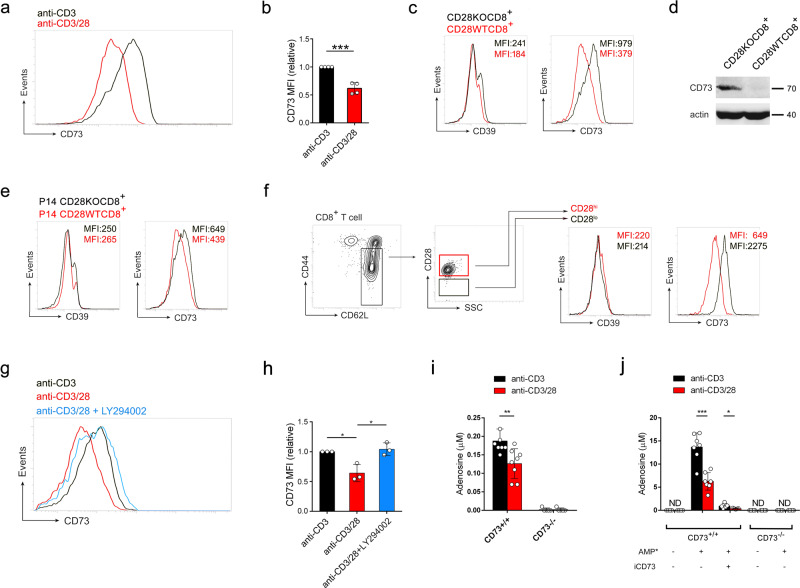
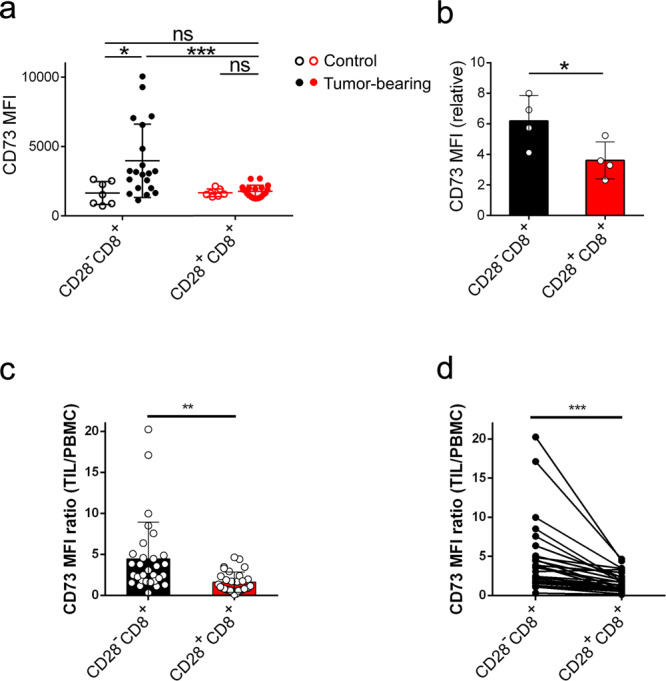
CD28 is required for T cell activation as well as the generation of CD4+Foxp3+ Treg. It is unclear, however, how CD28 costimulation affects the development of CD8+ T cell suppressive function. Here, by use of Hepa1.6.gp33 in vitro killing assay and B16.gp33 tumor mouse model we demonstrate that CD28 engagement during TCR ligation prevents CD8+ T cells from becoming suppressive. Interestingly, our results showed that ectonucleotidase CD73 expression on CD8+ T cells is upregulated in the absence of CD28 costimulation. In both murine and human tumor-bearing hosts, CD73 is upregulated on CD28-CD8+ T cells that infiltrate the solid tumor. UPLC-MS/MS analysis revealed that CD8+ T cells activation without CD28 costimulation produces elevated levels of adenosine and that CD73 mediates its production. Adenosine receptor antagonists block CD73-mediated suppression. Our data support the notion that CD28 costimulation inhibits CD73 upregulation and thereby prevents CD8+ T cells from becoming suppressive. This study uncovers a previously unidentified role for CD28 costimulation in CD8+ T cell activation and suggests that the CD28 costimulatory pathway can be a potential target for cancer immunotherapy.


Conflict of interest statement

The authors declare no competing interests.

Figures

Fig. 1
Fig. 1. CD28 costimulation prevents CD8+ T cells from becoming suppressive by blocking the release of soluble inhibitory factor(s).
a Experimental design for b, c. CFSE-labeled anti-CD3/28-stimulated CD28WTCD8+ or CD28KOCD8+ T cells were added to P14 CD8+ Teff culture (CFSE-) with a ratio of CFSE+:CFSE of 1:3. b CD28KOCD8+ (n = 5, black)- or CD28WTCD8+ (n = 3, red)-pretreated P14 CD28+/+ Teff were added to Hepa 1-6.gp33 cells at an E:T ratio of 1:3. Blank, P14 CD8+ Teff without treatment (n = 4). c Fold increase of tumor size: 3.8 ± 0.65 vs. 1.8 ± 0.49, day 27/day 7 after tumor implantation. Black, receiving CD28KOCD8+ T cells-pretreated P14 CD8+ Teff. Red, receiving CD28WTCD8+ T cells-pretreated P14 CD8+ Teff. n = 5. d Experimental design for eg. e Sup-CD28KOCD8+ (n = 3, black)- and Sup-CD28WTCD8+ (n = 4 at E:T ratio of 1:100 and 1:30, n = 3 at E:T ratio of 1:10, red)-treated P14 CD28+/+ Teff were added to Hepa 1-6.gp33 cells at the indicated E:T ratios. Data were analyzed by a general linear model. f Fold increase of tumor size. Black, receiving Sup-CD28KOCD8+-treated P14 CD8+ Teff (n = 6). Red, receiving Sup-CD28WTCD8+-treated P14 CD8+ Teff (n = 7). g Survival of tumor-bearing mice until 40 days after tumor implantation. Gray, injection with PBS (n = 8). Receiving Sup-CD28KOCD8+ (n = 7, black)- or Sup-CD28WTCD8+ (n = 21, red)-treated P14 CD8+ Teff. h Experimental design for ik. Transwell experiment: Insert: activated CD28KOCD8+ or CD28WTCD8+ T cells; lower chamber: P14 CD8+ Teff cells; Insert:lower chamber cell number ratio = 3:1. i Percent killing of Hepa 1-6.gp33 cells by P14 CD8+ Teff cells at the indicated E:T ratios. Black, exposure to CD28KOCD8+ T cell culture supernatant (n = 6); Red, exposure to CD28WTCD8+ T cell culture supernatant (n = 4 at E:T ratio of 1:3 and 1:1; n = 5 at E:T ratio of 3:1). Data were analyzed by a general linear model. j Further analysis of data in i. Tumor killing at the E:T ratio of 1:1 (P14 CD8+ Teff exposed to CD28KOCD8+ Sup, n = 6; P14 CD8+ Teff exposed to CD28KOCD8+ Sup, n = 4). k Fold increase of tumor size. Transfer of P14 CD8+ Teff cells exposed to CD28KOCD8+ T cell culture supernatants (black) or those exposed to CD28WTCD8+ T cell culture supernatants (red). (n = 3) l Animal survival until 37 days after tumor implantation. Injection with PBS (n = 5, gray). Transfer of P14 CD8+ Teff cells exposed to CD28KOCD8+ T cell culture supernatants (n = 3, black) or to CD28WTCD8+ T cell culture supernatants (n = 9, red). s.c., subcutaneously; i.v., intravenously. Statistical evaluations were performed using the Student’s t-test with data expressed as the mean ± standard error of the mean (b, c, f, j, k). The ability of CD8+ T cells between two groups to in vitro kill tumor at different E:T ratio was analyzed by a general linear model (e, i). The survival difference between groups was analyzed by log-rank test (g, l). *p < 0.05, **p < 0.01, ***p < 0.001; ns, not statistically significant.
Fig. 2
Fig. 2. CD8+ T cells stimulated via TCR without CD28 costimulation suppress effector T cell cytokine production.
a Naïve CD8+ T cells from CD28KO or CD28WT mice were stimulated by anti-CD3/28 antibodies. The cells were labeled with CFSE on day 3 after stimulation and added to CFSE-CD8+ Teff culture with a ratio of CFSE+: CFSE of 1:3. On 36 h after co-culture, CFSE cells in each group were sorted and restimulated with PMA and ionomycin for 6 h. The production of TNF, IFN-γ, perforin, and granzyme B by CD8+ Teff cells was detected by intracellular staining and analyzed by flow cytometry. Numbers on the upper left corner indicate the percentage of intracellular protein-positive cells in the total CD8+ T cell population. The data presented are representative of one of the three independent experiments. b Relative medium fluorescence intensity (MFI) of each intracellular protein in CD8+ Teff cell after co-culture with CD28KOCD8+ (black) or CD28WTCD8+ T cells (red). (n = 4). c Day-3 culture supernatants collected from anti-CD3- (black) or anti-CD3/28- (red) stimulated CD28WTCD8+ T cells were added to CD8+ Teff cells and cultured for 24 h. The production of intracellular proteins by CD8+ Teff cells was assessed by relative MFI (TNF, n = 5; IFN-γ, n = 6; perforin, n = 4; granzyme B, n = 4). d Culture supernatants from anti-CD3/28 (red)-stimulated and anti-CD3 (black)-stimulated CD28WTCD8+ T cells were collected on 24 and 48 h after stimulation. IL-10, IL-6, and IL-17 concentrations in the supernatants were quantified by Cytometric Bead Array. (n = 3). Statistical evaluations were performed using the Student’s t-test with data expressed as the mean ± standard error of the mean (bd). *p < 0.05, **p < 0.01; ns, not statistically significant.
Fig. 3
Fig. 3. Regulatory signature of CD8+ T cells stimulated via TCR without CD28 costimulation.
Naïve CD8+ T cells (3 × 106/mL) from spleens of CD28KO (black) and CD28WT (red) mice were sorted and stimulated with anti-CD3/28 antibodies. On days 0, 2, 4, and 6 after stimulation, cells were harvested and subjected to flow cytometric analysis for the expressions of CD73, CD39, Foxp3, GITR, CTLA-4, LAG3, PD-1, CCR6, CD25, CD101, CD122, FR4, Gelactin-9, Helios and ICOS. The data presented are representative of one of the three independent experiments.
Fig. 4
Fig. 4. CD28 costimulation inhibits CD73 upregulation on TCR-activated CD8+ T cells.
a Naïve CD28WTCD8+ T cells were sorted and stimulated with anti-CD3 antibody in the presence (red) or absence (black) of anti-CD28 antibody. Histogram of CD73 expression on CD8+ T cells on day 5 after stimulation. The data presented are representative of one of the four independent experiments. b As a, relative MFI of CD73 expression. (n = 4). MFI of CD73 in cells stimulated with anti-CD3 antibody (black) was taken as 1.0. MFI of CD73 in cells stimulated with anti-CD3/28 antibodies (red) was normalized against that in cells stimulated with anti-CD3 antibody (relative MFI). c Naïve CD8+ T cells from CD28KO (black) and CD28WT (red) mice were stimulated with anti-CD3/28 antibodies for 5 days and the cells were subjected to flow cytometric analysis for CD39 and CD73 expressions. The data presented are representative of one of the three independent experiments. d Naïve CD8+ T cells from CD28KO and CD28WT mice were stimulated with anti-CD3/28 antibodies for 5 days and the cell lysate was subjected to Western blot analysis for CD73 expression. The blot represents three independent experiments. e Naïve CD8+ T cells from P14 CD28KO (black) and P14 CD28WT (red) mice were stimulated with M2 peptide-pulsed B cell blasts. On day 5 after stimulation, cells were subjected to flow cytometric analysis for CD39 and CD73 expressions. The data presented are representative of one of the three independent experiments. f CD28hi (red) and CD28lo (black) populations sorted from naïve CD28WTCD8+ T cells were stimulated with anti-CD3/28 for 5 days and subjected to flow cytometric analysis of CD39 and CD73 expressions. The data presented are representative of one of the three independent experiments. g Naïve CD28WTCD8+ T cells were stimulated by anti-CD3 (black) or by anti-CD3/28 (red) antibodies in the presence (blue) or absence of LY294002 (3 μM). Histogram of CD73 expression on CD8+ T cells on day 5 after stimulation. The data presented are representative of one of the three independent experiments. h As g, relative MFI with that stimulated with anti-CD3 antibody as 1.0 (black). Anti-CD3/28, red. Anti-CD3/28 + LY294002, blue. (n = 3). i Culture supernatants of anti-CD3 (black)- and anti-CD3/28 (red)-stimulated CD8+ T cells from CD73+/+ (n = 8) and CD73−/− (n = 5) mice were collected after 2-h incubation in serum-free IL-2-containing DMEM and were subjected to UPLC-MS/MS analysis to quantify adenosine. j The capacity of CD8+ T cells to degrade AMP into adenosine was analyzed after 2-h incubation with AMP13C,15N isotope (AMP*, 37.5 μM). Culture supernatants of anti-CD3 (black)- and anti-CD3/28 (red) antibodies-stimulated CD8+ T cells from CD73+/+ (n = 7) and CD73−/− (n = 5) mice were collected after 2-h incubation in serum-free IL-2-containing DMEM and were subjected to UPLC-MS/MS analysis to quantify adenosine13C,15N. Neither pre-incubation of cells with CD73 inhibitor iCD73 (n = 5) before the addition of AMP13C,15N nor stimulated CD73−/− CD8+ T cells produced significant amounts of adenosine13C,15N, confirming the role of CD73 in the production of adenosine. Statistical evaluations were performed using the Student’s t-test with data expressed as the mean ± standard error of the mean (b, h, i, j). *p < 0.05, **p < 0.01, ***p < 0.001.
Fig. 5
Fig. 5. CD28 expression on CD8+ T cells in the tumor microenvironment negatively correlates with CD73 expression.
a Mice were subcutaneously injected with B16.gp33 melanoma cells (2 × 106 cells per mouse). Eight days later, tumor-draining lymph nodes were harvested. Total lymph node cells were subjected to flow cytometric analysis for CD73 expression on CD28CD8+ (solid black) and CD28+CD8+ (solid red) T cells (n = 20, each). Lymph nodes harvested from tumor-free mice (controls) were subjected to flow cytometric analysis for CD73 expression on CD28CD8+ (empty black) and CD28+CD8+ (empty red) T cells (n = 7, each). b As a, on day 20 after B16.gp33 implantation, tumors were dissected and dissociated into single cells. Single-cell suspensions were subjected to flow cytometric analysis for CD73 expression on CD28CD8+ (black) and CD28+CD8+ (red) T cells (n = 4). Relative MFI of CD73 on CD28CD8+ and CD28+CD8+T cells was compared against isotype control. c CD73 expressions on CD28CD8+ (n = 30, black) and CD28+CD8+ (n = 30, red) CD8+ T cells in TILs was compared to their respective counterparts in PBMC (TIL/PBMC) of colon cancer. d CD73 expressions on CD28CD8+ and CD28+CD8+ CD8+ T cells in TILs were compared to their respective counterparts in PBMC from the same individual. CD73 MFI from TILs and PBMC was analyzed by paired student t-test (n = 30). Statistical evaluations were performed using the Student’s t-test with data expressed as the mean ± standard error of the mean (ad). *p < 0.05, **p < 0.01, ***p < 0.001; ns, not statistically significant.
Fig. 6
Fig. 6. CD28 costimulation prevents CD73-mediated adenosine production by activated CD8+ T cells.
a P14 CD8+ Teff cells were pre-cultured with CFSE-labeled activated (I) CD28WTCD8+; (II) CD28KOCD8+; (III) iCD73-pretreated CD28KOCD8+; (IV) CD28KOCD8+ T cells in the presence of A2AR antagonist ZM241385 and A2BR antagonist MRS1754, at a ratio of 3:1. At 40 h after co-culture, CFSE-negative P14 CD8+ Teff in each group was sorted, restimulated with PMA/ionomycin, and subjected to intracellular staining of TNF, IFN-γ, perforin, and granzyme B. Number on the upper right indicates the percentage of the protein-positive population. The data presented are representative of one of the three independent experiments. b P14 CD8+ T cells treated with supernatants from activated CD28KOCD8+ (black), CD28WTCD8+ (red) or iCD73-pretreated CD28KOCD8+ (blue) cell cultures were added to Hepa 1.6.gp33 target at E:T ratios of 1:10, 1:3, and 1:1 (n = 3 each). P14 CD8+ Teff cells without any treatment were used as control (E:T ratios of 1:10, n = 4; 1:3, n = 6; 1:1, n = 4) (gray). c Further analysis of tumor-killing at E:T ratio of 1:10 in b. (P14 CD8+ Teff cells without any treatment, n = 4; the other groups, n = 3). d Survival of tumor-bearing mice. On day 8 after tumor implantation, tumor-bearing mice were intravenously administered P14 CD8+ Teff cells that had been pre-cultured with: (I) activated CD28WTCD8+ (71.7% survival, n = 46, red); (II) activated CD28KOCD8+ (51.4% survival, n = 35, black), significantly reduced survival between days 30 and 48 compared to mice in group I, p < 0.01; (III) iCD73-pretreated activated CD28KOCD8+ (86.2% survival, n = 29, blue), (IV) activated CD28KOCD8+ T cells in the presence of ZM241385 (79.5% survival, n = 39, brown). Statistical evaluations were performed using the Student’s t-test with data expressed as the mean ± standard error of the mean (c). The ability of CD8+ T cells between two groups to in vitro kill tumor at different E:T ratio was analyzed by the general linear model (b). The survival difference between groups was analyzed by log-rank test (d). *p < 0.05, **p < 0.01, ***p < 0.001; ns, not statistically significant.

References

    1. Babcock SK, Gill RG, Bellgrau D, Lafferty KJ. Studies on the two-signal model for T cell activation in vivo. Transpl. Proc. 1987;19:303–306. - PubMed
    1. Jenkins MK, Schwartz RH. Antigen presentation by chemically modified splenocytes induces antigen-specific T cell unresponsiveness in vitro and in vivo. J. Exp. Med. 1987;165:302–319. doi: 10.1084/jem.165.2.302. - DOI - PMC - PubMed
    1. June CH, Ledbetter JA, Gillespie MM, Lindsten T, Thompson CB. T-cell proliferation involving the CD28 pathway is associated with cyclosporine-resistant interleukin 2 gene expression. Mol. Cell. Biol. 1987;7:4472–4481. doi: 10.1128/MCB.7.12.4472. - DOI - PMC - PubMed
    1. Boise LH, et al. CD28 costimulation can promote T cell survival by enhancing the expression of Bcl-XL. Immunity. 1995;3:87–98. doi: 10.1016/1074-7613(95)90161-2. - DOI - PubMed
    1. Janeway CA, Jr., Bottomly K. Signals and signs for lymphocyte responses. Cell. 1994;76:275–285. doi: 10.1016/0092-8674(94)90335-2. - DOI - PubMed

Publication types