. 2021 May 19;11(1):10604.
doi: 10.1038/s41598-021-89834-9.

Altered endothelial dysfunction-related miRs in plasma from ME/CFS patients

Affiliations

Altered endothelial dysfunction-related miRs in plasma from ME/CFS patients

J Blauensteiner et al. Sci Rep. .

Erratum in

Abstract

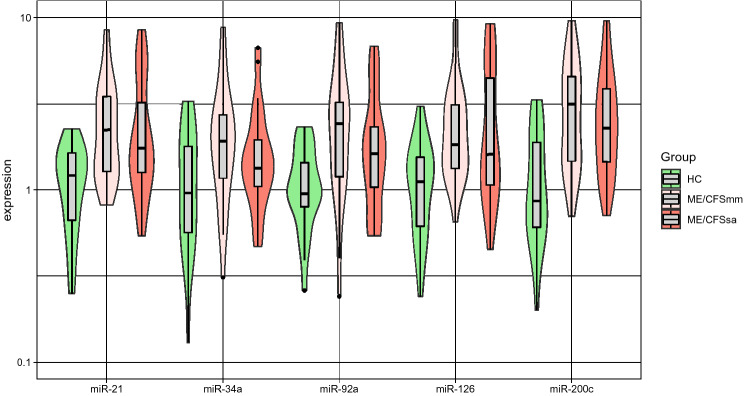
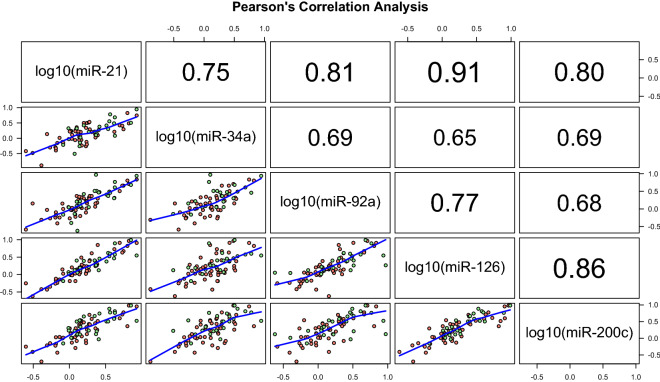
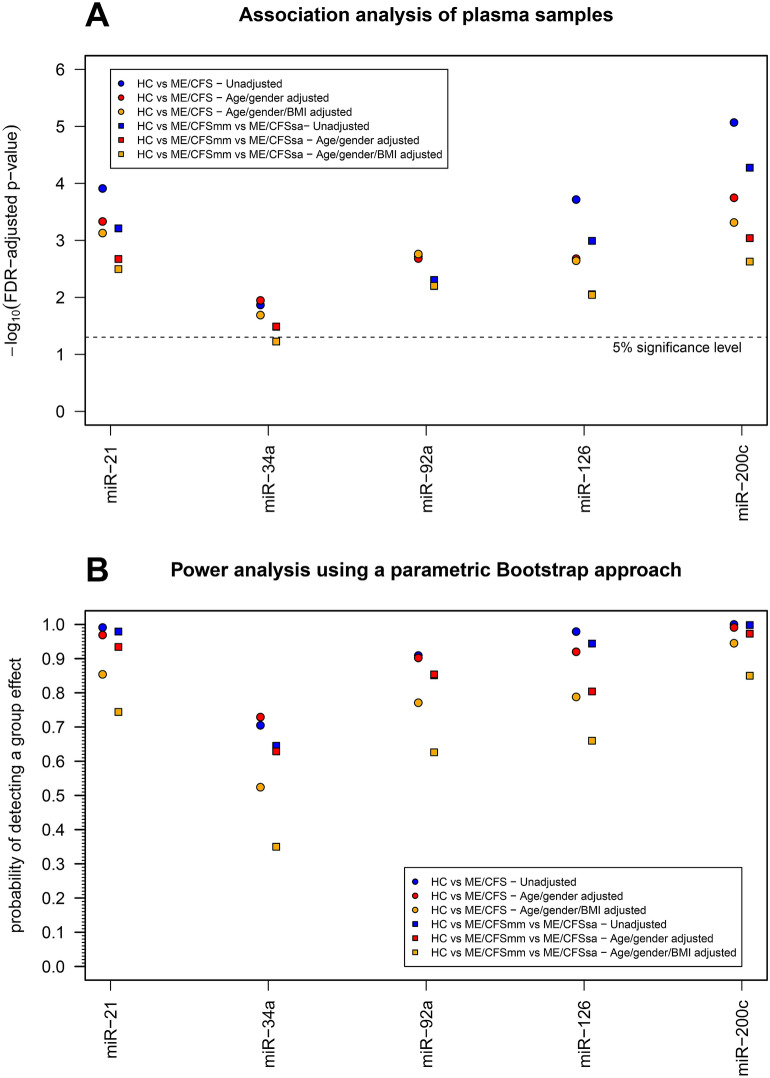
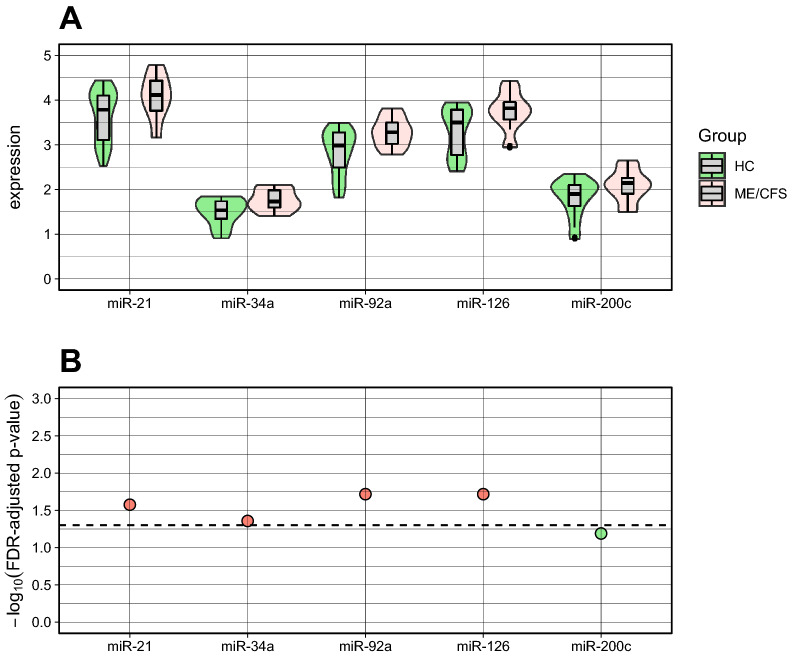
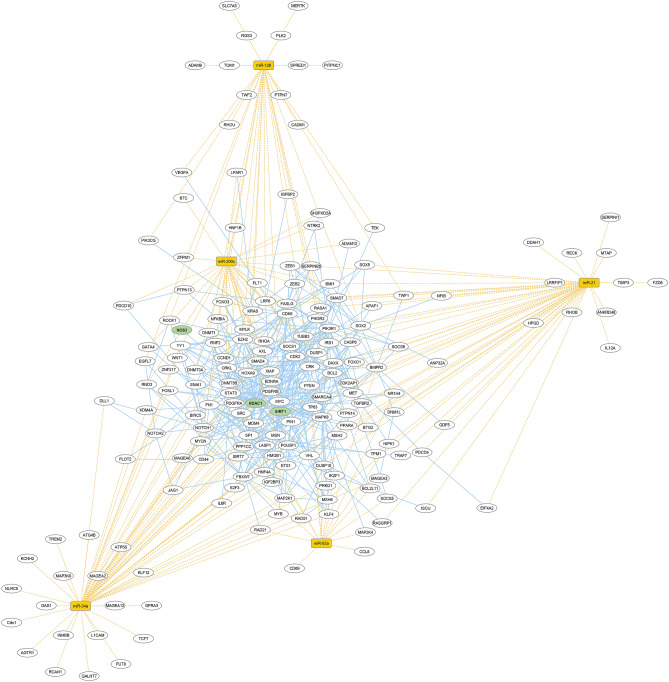
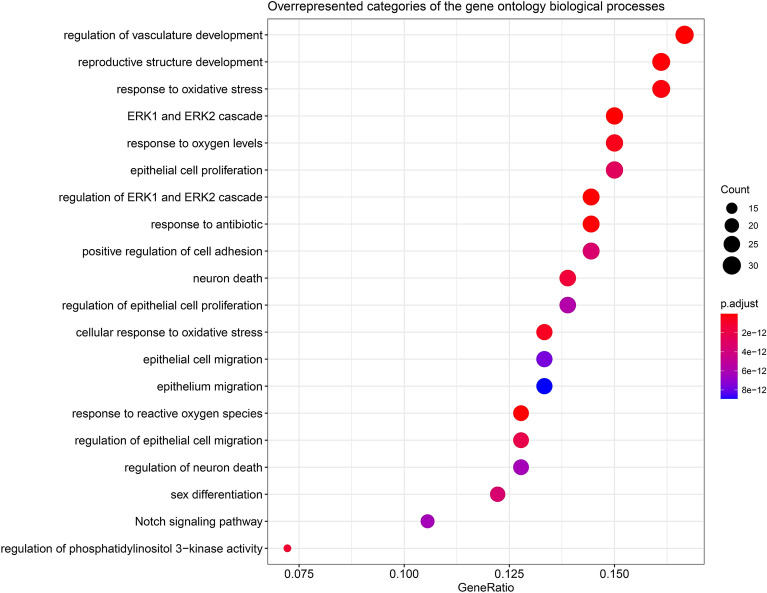
Myalgic encephalomyelitis/chronic fatigue syndrome (ME/CFS) is a complex disease characterized by unexplained debilitating fatigue. Although the etiology is unknown, evidence supports immunological abnormalities, such as persistent inflammation and immune-cell activation, in a subset of patients. Since the interplay between inflammation and vascular alterations is well-established in other diseases, endothelial dysfunction has emerged as another player in ME/CFS pathogenesis. Endothelial nitric oxide synthase (eNOS) generates nitric oxide (NO) that maintains endothelial homeostasis. eNOS is activated by silent information regulator 1 (Sirt1), an anti-inflammatory protein. Despite its relevance, no study has addressed the Sirt1/eNOS axis in ME/CFS. The interest in circulating microRNAs (miRs) as potential biomarkers in ME/CFS has increased in recent years. Accordingly, we analyze a set of miRs reported to modulate the Sirt1/eNOS axis using plasma from ME/CFS patients. Our results show that miR-21, miR-34a, miR-92a, miR-126, and miR-200c are jointly increased in ME/CFS patients compared to healthy controls. A similar finding was obtained when analyzing public miR data on peripheral blood mononuclear cells. Bioinformatics analysis shows that endothelial function-related signaling pathways are associated with these miRs, including oxidative stress and oxygen regulation. Interestingly, histone deacetylase 1, a protein responsible for epigenetic regulations, represented the most relevant node within the network. In conclusion, our study provides a basis to find endothelial dysfunction-related biomarkers and explore novel targets in ME/CFS.


Conflict of interest statement

The authors declare no competing interests.

Figures

Figure 1
Figure 1
miR expression data derived from plasma samples. Violin plots summarizing the expression data from each miR in healthy controls (HC), mild/moderate (mm) and severely affected (sa) ME/CFS patients. Note that the violin plots represent the classical boxplot depicted inside the violin together with a density plot that gives the shape of the violin. The statistical analysis was performed in the R software version 4.0.2 (https://www.r-project.org/).
Figure 2
Figure 2
Correlation analysis between miRs expression data derived from plasma samples. Lower panel shows the scatterplots between the expression of a pair of miR taken in log10-scale where the blue line represents a lowess approximation of the respective relationship between x and y variables, and the dots in light green and salmon color represent healthy individuals and patients with ME/CFS, respectively. The values in upper panel are the Pearson´s correlation coefficient estimates for the corresponding data shown in lower panel. The statistical analysis was performed in the R software version 4.0.2 (https://www.r-project.org/).
Figure 3
Figure 3
Principal component analysis and linear discriminant analysis derived from miR expression data in plasma. The scatterplots show the representation of each study participant in the first two principal components. The scatterplots (A) and (B) are the same but color-coded according to healthy controls (HC) versus patients with ME/CFS and according to healthy controls, mild/moderate (mm) and severely affected (sa) ME/CFS patients, respectively. The barplots (C) represent the frequency of HC and patients with ME/CFS and their corresponding classification probability of being classified as such according to a linear discriminant analysis distinguishing patients from controls specifically. The barplots (D) are similar to ones shown in (C), but for a linear discriminant analysis distinguishing mild/moderate patients from severely affected patients specifically. The statistical analysis was performed in the R software version 4.0.2 (https://www.r-project.org/).
Figure 4
Figure 4
Correlation analysis between miR expression and clinical-related data. A pairwise correlation analysis between data of each miR and data of each clinical, blood and SF-36 variable was conducted using Spearman’s correlation coefficient. A. Correlation analysis using the data of healthy controls only. B. Correlation analysis using the data of patients with ME/CFS only. C. Correlation analysis using data irrespective of the study groups. The statistical analysis was performed in the R software version 4.0.2 (https://www.r-project.org/).
Figure 5
Figure 5
Association analysis between miR expression and study groups. (A) Association analysis adjusting for a global false discovery rate of 5% and controlling for age, gender, and BMI. Each dot represents the −log10(p value) of a specific statistical association test while the dashed line represents −log10(0.05) above which it was consider a statistically significant association (i.e., −log10(p value) > −log10(0.05)). P values were adjusted for a false discovery rate (FDR) of 5%. (B) Power analysis using a parametric Bootstrap approach under the assumption that the estimated models in A were the true ones for the data. In this analysis, the probability of detecting a group effect was estimated by the proportion of simulated data sets in which the group effect was statistically significant after adjusting for an FDR of 5%. The statistical analysis was performed in the R software version 4.0.2 (https://www.r-project.org/).
Figure 6
Figure 6
Analysis of publicly available microarray data derived from PBMCs. (A) Violin plots summarizing the expression data from each miR in PBMCs from healthy controls (HC) and patients with ME/CFS. (B) Association analysis adjusting for a FDR of 5% and controlling for age and gender where the dashed line represents -log10(0.05) and red dots represent the statistically significant associations between ME/CFS and the respective miR. Check legend of Fig. 5 for additional information about how to interpret this plot. The statistical analysis was performed in the R software version 4.0.2 (https://www.r-project.org/).
Figure 7
Figure 7
Visualization of miR-target interaction network. miR-21-5p, miR-34a-5p, miR-92a-3p, miR-126-3p, and miR-200c-3p are displayed in yellow squares, while white ovals represent their targets. Dotted yellow lines and solid blue light ones indicate miR-mRNA and protein–protein interaction, respectively. The graphical representation was generated with Cytoscape software version 3.7.2 using the Organic layout (https://cytoscape.org/).
Figure 8
Figure 8
Biological processes related to miR-21-5p, miR-34a-5p, miR-92a-3p, miR-126-3p, and miR-200c-3p. Dot plot of functional enrichment analysis for the top 20 over-represented biological processes (BPs) related to our selected miRs. Dot sizes represent the number of genes (count) related to a particular BP. Gene Ratio is the number of genes found enriched in each category over the number of total genes associated to that BP. Dot colors represent the adjusted p values. Dot plots were generated in R software version 3.6.1 using the clusterProfiler package version 3.14.3 (https://bioconductor.org/packages/release/bioc/html/clusterProfiler.html).

Similar articles

Cited by

References

    1. Cortes Rivera M, Mastronardi C, Silva-Aldana C, Arcos-Burgos M, Lidbury B. Myalgic encephalomyelitis/chronic fatigue syndrome: A comprehensive review. Diagnostics. 2019;9:91. doi: 10.3390/diagnostics9030091. - DOI - PMC - PubMed
    1. Montoya JG, et al. Cytokine signature associated with disease severity in chronic fatigue syndrome patients. Proc. Natl. Acad. Sci. 2017;114:E7150–E7158. doi: 10.1073/pnas.1710519114. - DOI - PMC - PubMed
    1. Hornig M, et al. Distinct plasma immune signatures in ME/CFS are present early in the course of illness. Sci. Adv. 2015;1:e1400121. doi: 10.1126/sciadv.1400121. - DOI - PMC - PubMed
    1. Pober JS, Sessa WC. Evolving functions of endothelial cells in inflammation. Nat. Rev. Immunol. 2007;7:803–815. doi: 10.1038/nri2171. - DOI - PubMed
    1. Bai B, et al. NLRP3 inflammasome in endothelial dysfunction. Cell Death Dis. 2020;11:776. doi: 10.1038/s41419-020-02985-x. - DOI - PMC - PubMed

Publication types