. 2021 May 19;12(1):2921.
doi: 10.1038/s41467-021-23252-3.

Fast photothermal spatial light modulation for quantitative phase imaging at the nanoscale

Affiliations

Fast photothermal spatial light modulation for quantitative phase imaging at the nanoscale

Hadrien M L Robert et al. Nat Commun. .

Abstract

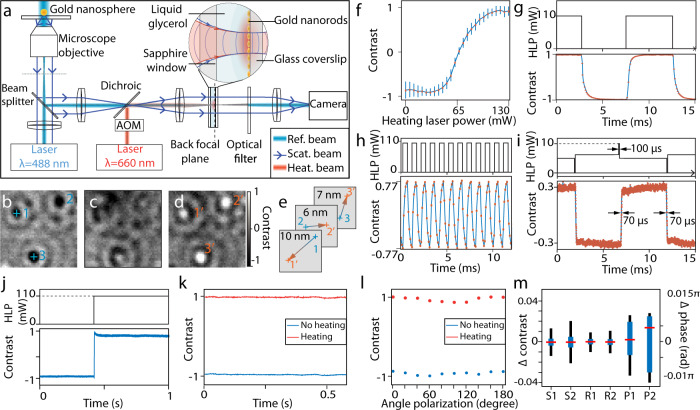
Spatial light modulators have become an essential tool for advanced microscopy, enabling breakthroughs in 3D, phase, and super-resolution imaging. However, continuous spatial-light modulation that is capable of capturing sub-millisecond microscopic motion without diffraction artifacts and polarization dependence is challenging. Here we present a photothermal spatial light modulator (PT-SLM) enabling fast phase imaging for nanoscopic 3D reconstruction. The PT-SLM can generate a step-like wavefront change, free of diffraction artifacts, with a high transmittance and a modulation efficiency independent of light polarization. We achieve a phase-shift > π and a response time as short as 70 µs with a theoretical limit in the sub microsecond range. We used the PT-SLM to perform quantitative phase imaging of sub-diffractional species to decipher the 3D nanoscopic displacement of microtubules and study the trajectory of a diffusive microtubule-associated protein, providing insights into the mechanism of protein navigation through a complex microtubule network.


Conflict of interest statement

The authors declare the following competing interests: H.M.L.R. and M.P. of the Institute of Photonics and Electronics CAS have a patent related to the method of phase modulation. The remaining authors declare no competing interests.

Figures

Fig. 1
Fig. 1. Numerical simulation of the spatial phase modulator.
a Illustration of the structure used. b 2D map of temperature in the xy cross-section and (c) xz cross-section (scale bar indicates 100 µm). The boundaries of the thermo-optic material are indicated by the two white dashed lines. d Resulting refractive index variation in the xy cross-section, and (e) in the xz cross-section. f Phase-shift profile of a plane wave propagating through the structure in z at the position of the red dashed line in (d). g Phase-shift profiles for different thicknesses of the thermo-optic layer. Heating powers of 0.4 µWµm−2, 2.6 µWµm−2, and 14 µWµm−2 were considered for thicknesses of 250 µm, 20 µm, and 5 µm, respectively. h Peak phase-shift and corresponding heating power as a function of the peak temperature change (the glycerol thickness is 20 µm). i Response time of the temperature change as a function of the characteristic dimension according to the model.
Fig. 2
Fig. 2. Experimental characterization of the PT-SLM.
a Layout of the setup (not to scale, details of the phase modulator structure are magnified). AOM = Acousto-Optic Modulator. bd Normalized iSCAT images of 30-nm single gold nanospheres at heating laser powers Pheat (total power incident on the modulator structure) of (b) 0 mW, (c) 65 mW, (d) 110 mW. (Representative images from 21 independent experiments, scale bar indicates 500 nm). Blue and orange crosses and numbers indicate the positions used to assess the lateral distortion. e Change in the fitted position of the three nanoparticles indicated in (b) and (d). f Calibration curve of the particle contrast dependence on the heating power. Data are presented as mean values ± SD for n = 21 experiments. g Time series of the contrast of a gold nanosphere modulated with a rectangular signal at 100 Hz (HLP Heating Laser Power) and (h) at 1 kHz. i Contrast time series for an arbitrary-shaped heating modulation. The upper diagram shows the corresponding temporal profile of the heating beam intensity. j Stability of the nanoparticle contrast at a step heat change. k Reproducibility of the nanoparticle contrast at a 500 Hz squared modulation—time series plots of on/off equilibrium levels. l Polarization dependence of the nanoparticle contrast—time series plots of on/off equilibrium levels. m Box-plot of the S1 (off) S2 (on) stability derived from (j) (n = 10,000 images in one experiment), R1 (off), R2 (on) reproducibility derived from (k) (n = 500 off-on cycles in one experiment), and polarization dependence P1 (off), P2 (on) derived from (l) (n = 20 different polarizations in one experiment); the interquartile range is in blue, max–min range in black, and the median in red.
Fig. 3
Fig. 3. Quantitative phase imaging of gold nanoparticles.
ac From left to right: iSCAT contrast, reconstructed intensity, and phase image of two gold nanoparticles at the focus positions: (a) 0.35 µm (coverslip closer to the microscope objective), (b) 0.6 µm (~best-focus position) and (c) 0.85 µm (coverslip further away from the microscope objective). Representative images out of 50 individual nanoparticles imaged, scale bar indicates 500 nm. d Focus position dependence of the phase for the two particles shown in (ac). A theoretical prediction is shown in red. e Time series of the extracted scattering phase of a 20 nm gold nanoparticle at five different positions (indicated in the inset). f Box plot of the variation of the reconstructed phase at the five positions of nanoparticles in (e) (offset to the mean value of all five positions) and the corresponding vertical displacement (Δposition). The interquartile range is in blue, max–min range in black, and the median in red (n = 60 phase reconstructions for each position).
Fig. 4
Fig. 4. Quantitative phase imaging of microtubules.
a iSCAT image of two microtubules. Representative image from five independent experiments, scale bar indicates 500 nm. bc Separated iSCAT images and phase images of individual microtubules shown in (a). d 3D reconstruction of the crossing microtubules and the cross-section height profile. e AFM image of microtubule crossing and the corresponding height profile.
Fig. 5
Fig. 5. 3D localization of an Ase1 protein on a microtubule using quantitative phase imaging.
a Scatter plot of the protein trajectory in the xy projection, and (b) 3D perspective view. c The cross-section scatter plot of the trajectory in the xy plane (perpendicular to the microtubule); density of localizations is color-coded. The approximate position of the microtubule (radius 12.5 nm) is indicated with the dashed-line inner circle and the estimated trajectory radius of 40 nm is indicated with a solid line. d The protein trajectory after smoothing and down-sampling to the rate of 30 samples per second.

References

    1. Zernike F. Phase contrast, a new method for the microscopic observation of transparent objects part II. Physica. 1942;9:974–986. doi: 10.1016/S0031-8914(42)80079-8. - DOI
    1. Ellis GW. Holomicrography: transformation of image during reconstruction of a posteriori. Science. 1966;154:1195–1197. doi: 10.1126/science.154.3753.1195. - DOI - PubMed
    1. Nomarski G. Nouveau dispositif pour lobservation en contraste de phase differentiel. J. Phys. Radium. 1955;16:S88–S88.
    1. Curtis AS. The mechanism of adhesion of cells to glass. A study by interference reflection microscopy. J. Cell Biol. 1964;20:199–215. doi: 10.1083/jcb.20.2.199. - DOI - PMC - PubMed
    1. Wolf, E. Progress in optics. Vol. 57 (Elsevier, 2012).

Publication types

MeSH terms