. 2021 Sep;31(9):980-997.
doi: 10.1038/s41422-021-00506-9. Epub 2021 May 19.

The metabolite α-KG induces GSDMC-dependent pyroptosis through death receptor 6-activated caspase-8

Affiliations

The metabolite α-KG induces GSDMC-dependent pyroptosis through death receptor 6-activated caspase-8

Jia-Yuan Zhang et al. Cell Res. 2021 Sep.

Abstract

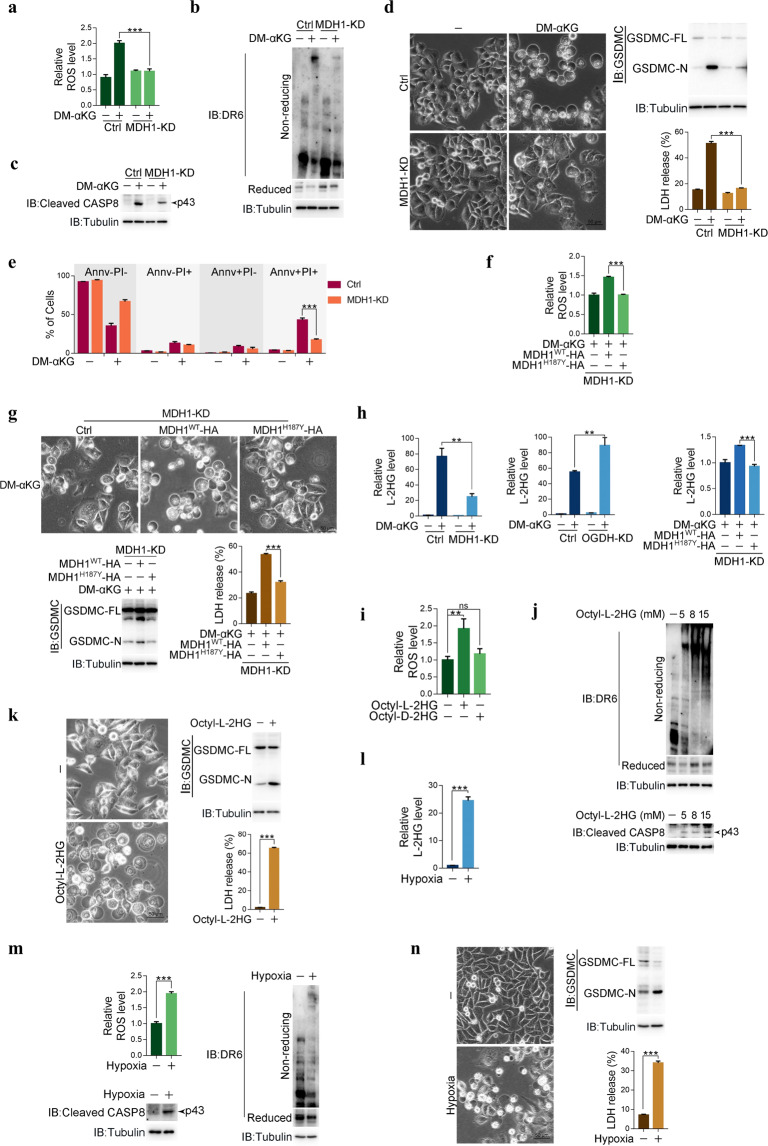
Pyroptosis is a form of regulated cell death mediated by gasdermin family members, among which the function of GSDMC has not been clearly described. Herein, we demonstrate that the metabolite α-ketoglutarate (α-KG) induces pyroptosis through caspase-8-mediated cleavage of GSDMC. Treatment with DM-αKG, a cell-permeable derivative of α-KG, elevates ROS levels, which leads to oxidation of the plasma membrane-localized death receptor DR6. Oxidation of DR6 triggers its endocytosis, and then recruits both pro-caspase-8 and GSDMC to a DR6 receptosome through protein-protein interactions. The DR6 receptosome herein provides a platform for the cleavage of GSDMC by active caspase-8, thereby leading to pyroptosis. Moreover, this α-KG-induced pyroptosis could inhibit tumor growth and metastasis in mouse models. Interestingly, the efficiency of α-KG in inducing pyroptosis relies on an acidic environment in which α-KG is reduced by MDH1 and converted to L-2HG that further boosts ROS levels. Treatment with lactic acid, the end product of glycolysis, builds an improved acidic environment to facilitate more production of L-2HG, which makes the originally pyroptosis-resistant cancer cells more susceptible to α-KG-induced pyroptosis. This study not only illustrates a pyroptotic pathway linked with metabolites but also identifies an unreported principal axis extending from ROS-initiated DR6 endocytosis to caspase-8-mediated cleavage of GSDMC for potential clinical application in tumor therapy.


Conflict of interest statement

The authors declare no competing interests.

Figures

Fig. 1
Fig. 1. α-KG induces pyroptosis by caspase-8 cleavage of GSDMC.
HeLa cells were treated with DM-αKG (15 mM) for 24 h or the indicated times to assess pyroptotic features (including characteristic morphology, GSDMC cleavage, LDH release, and Annv+/PI+ cells), unless specially defined. ac DM-αKG induced pyroptosis in HeLa cells. Pyroptotic morphology and LDH release (a), percentage of Annv+/PI+ cell population (b), and GSDMC cleavage (c) at different concentrations of DM-αKG as indicated in HeLa cells were shown. Red arrows indicate pyroptotic cells in a. Cells were stained with Annexin V (Annv) and propidium iodide (PI), then analyzed by flow cytometry in b. The molecular weight is marked on the right in c. GSDMC-FL, GSDMC full length; GSDMC-N, GSDMC cleavage at N-terminus. d, e Effects of GSDMC on DM-αKG-induced pyroptosis (d) and Annv+/PI+ cell population (e). GSDMC was knocked down first in HeLa cells, the cells were then treated with DM-αKG. f, g Effects of caspase-8 on DM-αKG-induced pyroptosis (f) and Annv+/PI+ cell population (g). Caspase-8 was knocked down first in HeLa cells, the cells were then treated with DM-αKG. h Effect of caspase-8 enzymatic activity on DM-αKG-induced pyroptotic characteristics. Caspase-8 enzymatic dead mutant CASP8C360S was expressed in caspase-8 knockdown (KD) cells. CASP8WT was used as a positive control. i Effect of GSDMCD240A on DM-αKG-induced pyroptotic characteristics. siRNA-resistant GSDMCD240A was expressed in GSDMC knockdown HeLa cells. GSDMCWT was used as a positive control. j The N-terminus of GSDMC (GSDMC-1–240-HBD*-HA) had an ability to induce pyroptosis. GSDMC-WT-HBD*-HA or GSDMC-1–240-HBD*-HA was transfected into HeLa cells as indicated, the cells were then treated with 4-OHT (3 μM) for 2 h. GSDMC-WT-HBD*-HA was used as a negative control. Tubulin was used to determine the amount of loading proteins. All data are presented as means ± SEM of two or three independent experiments. ***P < 0.001; ns, not significant. The data were analyzed using one-way ANOVA followed by Dunnett’s multiple comparison test (a, b, h, i) or two-way ANOVA followed by the Bonferroni test (dg, j).
Fig. 2
Fig. 2. DR6 responds to ROS signals to induce pyroptosis.
HeLa cells were treated with DM-αKG (15 mM) for 6 h to determine the ROS level or 24 h to assess the DR6 oxidation, caspase-8 activation, and pyroptotic features (including cell morphology, GSDMC cleavage, LDH release, and Annv+/PI+ cells), unless specially defined. Inhibitors Trolox (400 μM) and Z-VAD (40 μM) were used to pretreat cells for 2 h. a Determination of ROS levels at the indicated concentrations of DM-αKG (left), with or without pretreatment of Trolox (right). b Effect of Trolox on DM-αKG-induced activation of caspase-8. Active caspase-8 indicated by arrow was at p43 site. c, d Effects of DR6 on DM-αKG-induced pyroptotic morphology, GSDMC cleavage, LDH release (c) and Annv+/PI+ cell population (d). DR6 was knocked down first in HeLa cells, the cells were then treated with DM-αKG. e Effects of Trolox and Z-VAD or caspase-8 and GSDMC on DM-αKG-induced DR6 oxidation. In first two panels, Trolox or Z-VAD was used to pretreat cells. In last two panels, Caspase-8 or GSDMC was knocked down first in cells, the cells were then treated with DM-αKG. DR6 oxidation was observed by running non-reducing gels. f–h Effects of DR6 oxidation mutant DR65CS on DM-αKG-induced DR6 oxidation (f), caspase-8 activation (g) and pyroptotic characteristics (h). siRNA-resistant DR65CS was expressed in DR6 knockdown cells. DR6WT was used as a positive control. The expression levels of DR6WT-HA and DR65CS-HA were indicated in g (bottom). Tubulin was used to determine the amount of loading proteins. All data are presented as means ± SEM of two or three independent experiments. *P < 0.05, **P < 0.01, ***P < 0.001. The data were analyzed using one-way ANOVA followed by Dunnett’s multiple comparison test (a (left), h) or two-way ANOVA followed by the Bonferroni test (a (right), c, d).
Fig. 3
Fig. 3. ROS-induced oxidation promotes DR6 endocytosis.
HeLa cells were treated with DM-αKG (15 mM) for 6 h to observe protein localization under confocal microscope and analyze protein amounts by fractionation, or 24 h to assess DR6 oxidation level and pyroptotic features (including cell morphology, GSDMC cleavage, and LDH release), unless specially defined. Inhibitors Trolox (400 μM), Genistein (20 μM) or MβCD (1 mM) was used to pretreat cells for 2 h. a, b Indication of DR6 puncta in cells (a) and DR6 expression in plasma membrane (PM) (b) in response to DM-αKG stimulation. DR6-GFP was transfected into cells, the cells were then pretreated with Trolox, followed by DM-αKG treatment. Endogenous Rab5a was used as an early endosome marker (a). The amounts of DR6 in PM were quantified and shown in b. c, d Effect of DR6 oxidation on DM-αKG-induced DR6 puncta in cells (c) and DR6 expression in PM (d). siRNA-resistant DR6WT and DR65CS were expressed in DR6 knockdown cells. e, f Effects of Genistein and MβCD on DM-αKG-induced DR6 puncta in cells (e) and DR6 expression in PM (f). DR6-GFP was transfected into cells, the cells were then pretreated with inhibitors, followed by DM-αKG treatment. gi Effects of Genistein and MβCD on DM-αKG-induced caspase-8 activation (g), GSDMC cleavage and LDH release (h), and pyroptotic morphology (i). Cells were pretreated with inhibitors as indicated, followed by DM-αKG treatment. Tubulin was used to determine the amount of loading proteins. All data are presented as means ± SEM of two or three independent experiments. ***P < 0.001. The data were analyzed using two-way ANOVA followed by the Bonferroni test.
Fig. 4
Fig. 4. Oxidized DR6 recruits both caspase-8 and GSDMC to DR6 receptosomes.
HeLa cells were treated with DM-αKG (15 mM) for 6 h to observe protein localization under confocal microscope, or 24 h to assess DR6 oxidation level and the pyroptotic features (including cell morphology, GSDMC cleavage, and LDH release), unless specially defined. Inhibitors Trolox (400 μM) or Genistein (20 μM) was used to pretreat cells for 2 h. a, b Effects of DR6 on the localization of Caspase-8 (a) and GSDMC (b) in the DR6 receptosomes. Caspase-8-HA or HA-GSDMC was transfected into control or DR6 knockdown cells as indicated, the cells were then treated with DM-αKG. Endogenous Rab5a was used as an early endosome marker. c Localization of oxidized DR6 in the TI fractions. Cells were treated with DM-αKG, with or without pretreatment of Trolox or Genistein as indicated. TI, the Triton X-100 insoluble fractions. TS, the Triton X-100 soluble fractions. d–f Analysis of adapter FADD, pro-caspase-8, active caspase-8 and cleaved GSDMC expressions in the TI fractions under different conditions with DM-αKG treatment, including in DR6 knockdown cells (d), pretreatment with Trolox (e, left), or genistein (f), and in DR65CS expressing cells in which DR6 was knocked down first (e, right). DR6WT was used as a positive control. g, h Effects of adapter FADD on DM-αKG-induced caspase-8 activation (g) and pyroptotic features (h). FADD was knocked down in cells. i Detection of DM-αKG-induced pro-caspase-8, cleaved caspase-8 and Bid levels in TS and TI fractions. j Effect of caspase-8 enzymatic activity on DM-αKG-induced expression of FADD, pro-caspase-8, active caspase-8 and GSDMC cleavage in the TI fractions. siRNA-resistant CASP8C360S was expressed in caspase-8 knockdown cells. CASP8WT was used as a positive control. Tubulin was used to determine the amount of loading proteins. All data are presented as means ± SEM of two or three independent experiments. ***P < 0.001. The data were analyzed using two-way ANOVA followed by the Bonferroni test.
Fig. 5
Fig. 5. α-KG inhibits tumor growth and metastasis in mouse models.
In xenograft model, mice were administered with DM-αKG (500 mg/kg) once per day for one week. In metastasis model, mice were administered with DM-αKG (500 mg/kg) once per day for 30 days. a, b Indication of xenograft tumors in terms of size and weight. B16 cells with or without knockdown of DR6 (a) or GSDMC (b) were injected into C57BL/6J mice to form subcutaneous xenografts (n = 7). c The corresponding expression levels of GSDMC in the tumor samples from a were indicated. df Effect of DM-αKG on tumor metastasis. B16 cells with GSDMC (e, n = 6) or DR6 (f, n = 7) knockdown were intravenously injected into C57BL/6J mice. Representative images of metastatic tumors in the lung are indicated by red arrows (d). The corresponding luciferase signal intensities of the metastatic tumors in the mice are shown (e (up), f (up)). Tumor metastasis was quantified using bioluminescence imaging (e (down), f (down)). All data are presented as means ± SEM. *P < 0.05, **P < 0.01; ns, not significant. The data were analyzed using two-way ANOVA followed by the Bonferroni test.
Fig. 6
Fig. 6. α-KG elevates ROS levels through MDH1-catalyzed conversion to L-2HG.
HeLa cells were treated with DM-αKG (15 mM) for 6 h to determine the ROS level and L-2HG level, or 24 h to assess DR6 oxidation, pyroptotic features (including cell morphology, GSDMC cleavage, LDH release, and Annv+/PI+ cells), unless specially defined. Cells were treated with Octyl-L-2HG (5 mM) or Octyl-D-2HG (5 mM) for 1 h to determine the ROS level, or 2 h to assess DR6 oxidation and pyroptotic features. ac Effects of MDH1 on DM-αKG-induced ROS level (a), DR6 oxidation (b), and caspase-8 activation (c). MDH1 was knocked down first in HeLa cells, the cells were then treated with DM-αKG. d, e Effects of MDH1 on DM-αKG-induced pyroptotic morphology, GSDMC cleavage, LDH release (d) and percentage of Annv+/PI+ cells (e). MDH1 was knocked down first in HeLa cells, the cells were then treated with DM-αKG. f, g Effect of MDH1 enzymatic activity on DM-αKG-induced ROS level (f) and pyroptosis (g). MDH1 was knocked down in HeLa cells, and siRNA-resistant MDH1H187Y was then transfected into cells. MDH1WT was used as a positive control. h Effects of MDH1 (left) and its enzymatic activity (right), or OGDH (middle) on the levels of L-2HG. MDH1 (left) or OGDH (middle) was knocked down in HeLa cells as indicated. In MDH1 knockdown cells, siRNA-resistant MDH1H187Y was expressed, and MDH1WT was used as a positive control (right). i–k Effects of octyl-L-2HG on ROS level (i), DR6 oxidation and caspase-8 activation (j) and pyroptosis (k). HeLa cells were treated with L-2HG at indicated concentrations (j). ln Effects of hypoxia on L-2HG level (l), ROS level, DR6 oxidation and caspase-8 activation (m) and pyroptosis (n). Cells were under hypoxia (0.1% O2) for 6 h to determine ROS level, 24 h to analyze L-2HG level, and 48 h to assess DR6 oxidation, caspase-8 activation and pyroptotic features. Tubulin was used to determine the amount of loading proteins. All data are presented as means ± SEM of two or three independent experiments. **P < 0.01, ***P < 0.001; ns, not significant. The data were analyzed using two-tailed Student’s t-test in kn, and one-way ANOVA followed by Dunnett’s multiple comparison test in f, g, h (right), i or two-way ANOVA followed by the Bonferroni test in a, d, e, h (left and middle).
Fig. 7
Fig. 7. The acidic environment facilitates cell sensitivity to α-KG-induced pyroptosis.
Different cancer cell lines, namely, U251, SK-MEL-1, MCF7, and MDA-MB-231 were treated with DM-αKG (15 mM) for 6 h to determine the L-2HG and ROS levels or 24 h to assess DR6 oxidation, caspase-8 activation, and pyroptotic features (including cell morphology, GSDMC cleavage, and LDH release), unless specially defined. a–e Effects of different pH on DM-αKG-induced GSDMC cleavage (a), L-2HG levels (b), ROS levels (c), DR6 oxidation (d), and caspase-8 activation (e). Different cancer cells were cultured in medium with different pH values as indicated. fh Effects of lactic acid on DM-αKG-induced L-2HG levels (f), ROS levels (g), and GSDMC cleavage (h). Lactic acid (20 mM) together with DM-αKG were used to treat different cancer cells as indicated. i, j SK-MEL-1 cells were injected into nude mice to form subcutaneous xenografts (n = 6). Lactic acid (15 mg/kg) or DM-αKG (500 mg/kg) was intratumorally injected alone or combinedly every other day (four times). The xenograft tumors, tumor weights (i, n = 6) and GSDMC cleavage (j, n = 3) were indicated. Tubulin was used to determine the amount of loading proteins. All data are presented as means ± SEM of two or three independent experiments. *P < 0.05, **P < 0.01, ***P < 0.001. The data were analyzed using one-way ANOVA followed by Dunnett’s multiple comparison test in i or two-way ANOVA followed by the Bonferroni test in b, c, f, g.
Fig. 8
Fig. 8. A working model of α-KG-induced pyroptosis.
Under acidic environment, the metabolic enzyme MDH1 promiscuously catalyzes the conversion of α-KG to L-2HG, which then boosts ROS level. This signal is responded by the plasma membrane-localized death receptor DR6 by inducing the oxidation of DR6. Oxidized DR6 internalizes into the cytosol, and then recruits both pro-caspase-8 and GSDMC to the DR6 receptosome, in which active caspase-8 cleaves GSDMC, thereby inducing pyroptosis. This story demonstrates a novel pathway from ROS-initiated DR6 endocytosis to caspase-8-cleaved GSDMC for pyroptosis induction.

References

    1. Shi J, Gao W, Shao F. Pyroptosis: gasdermin-mediated programmed necrotic cell death. Trends Biochem. Sci. 2017;42:245–254. doi: 10.1016/j.tibs.2016.10.004. - DOI - PubMed
    1. Shi J, et al. Cleavage of GSDMD by inflammatory caspases determines pyroptotic cell death. Nature. 2015;526:660–665. doi: 10.1038/nature15514. - DOI - PubMed
    1. Kayagaki N, et al. Caspase-11 cleaves gasdermin D for non-canonical inflammasome signalling. Nature. 2015;526:666–671. doi: 10.1038/nature15541. - DOI - PubMed
    1. He WT, et al. Gasdermin D is an executor of pyroptosis and required for interleukin-1β secretion. Cell Res. 2015;25:1285–1298. doi: 10.1038/cr.2015.139. - DOI - PMC - PubMed
    1. Wang Y, et al. Chemotherapy drugs induce pyroptosis through caspase-3 cleavage of a gasdermin. Nature. 2017;547:99–103. doi: 10.1038/nature22393. - DOI - PubMed

Publication types