. 2021 Aug;39(8):949-957.
doi: 10.1038/s41587-021-00933-4. Epub 2021 May 19.

In vivo adenine base editing of PCSK9 in macaques reduces LDL cholesterol levels

Affiliations

In vivo adenine base editing of PCSK9 in macaques reduces LDL cholesterol levels

Tanja Rothgangl et al. Nat Biotechnol. 2021 Aug.

Abstract

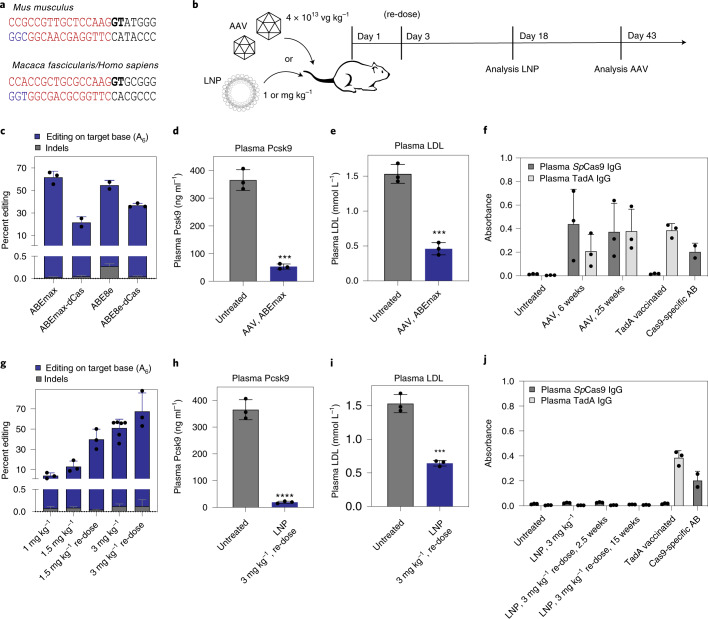
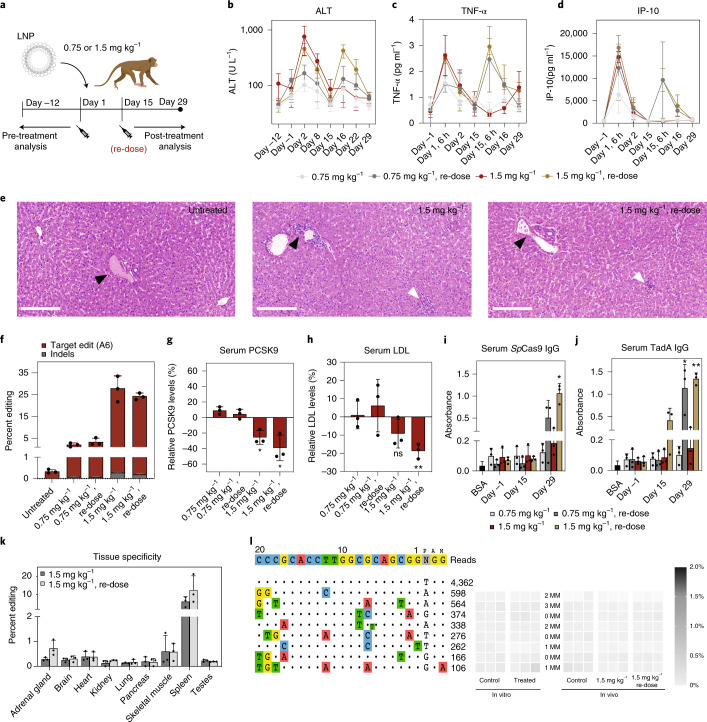
Most known pathogenic point mutations in humans are C•G to T•A substitutions, which can be directly repaired by adenine base editors (ABEs). In this study, we investigated the efficacy and safety of ABEs in the livers of mice and cynomolgus macaques for the reduction of blood low-density lipoprotein (LDL) levels. Lipid nanoparticle-based delivery of mRNA encoding an ABE and a single-guide RNA targeting PCSK9, a negative regulator of LDL, induced up to 67% editing (on average, 61%) in mice and up to 34% editing (on average, 26%) in macaques. Plasma PCSK9 and LDL levels were stably reduced by 95% and 58% in mice and by 32% and 14% in macaques, respectively. ABE mRNA was cleared rapidly, and no off-target mutations in genomic DNA were found. Re-dosing in macaques did not increase editing, possibly owing to the detected humoral immune response to ABE upon treatment. These findings support further investigation of ABEs to treat patients with monogenic liver diseases.


Conflict of interest statement

P.J.C.L., M.D., Y.K.T. and S.C.S. are employees of Acuitas Therapeutics. K.H., J.A.W., D.V.V. and A.P.K. are employees and shareholders of Synthego Corporation. D. Weissman is named on patents that describe the use of nucleoside-modified mRNA as a platform to deliver therapeutic proteins. M.J., G.S. and L.V. are named on patents and patent applications related to CRISPR–Cas technologies. The remaining authors declare no competing financial interests.

Figures

Fig. 1
Fig. 1. In vivo adenine base editing of the Pcsk9 locus in the mouse liver.
a, sgRNA target sequences in the mouse and macaque/human PCSK9 gene. The exonic region (exon 1) is highlighted in red; the intronic region is highlighted in black. The GT splice donor recognition site is highlighted in bold letters. The NGG-PAM site is indicated in blue. b, Schematic outline of the mouse experiments. Vectors were administered intravenously via tail vein injection in adult C57BL/6J mice. c, Percent editing after treatment with different ABE variants. Insertions and deletions are summarized as ‘Indels’. Values represent mean ± s.d. of n = 3, n = 2, n = 2 and n = 3 animals. d, Plasma Pcsk9 protein levels as determined by ELISA. ***P = 0.0002. e, Plasma LDL cholesterol levels. ***P = 0.0003. f, Background-subtracted absorbance (A450 – A540) representing the relative amount of anti-Cas9- or anti-TadA-specific plasma IgG antibodies as determined by ELISA. Positive control: plasma of TadA vaccinated animals or commercial Cas9-specific antibody at a concentration of 200 ng ml−1 (n = 2). g, Percent editing after treatment with different doses of LNP-encapsulated mRNA/sgRNA. Insertions or deletions are summarized as ‘Indels’. h, Plasma Pcsk9 protein levels as determined by ELISA. ****P < 0.0001. i, Plasma LDL cholesterol levels. ***P = 0.0004. j, Background-subtracted absorbance (A450 – A540) representing the relative amount of anti-Cas9- or anti-TadA-specific plasma antibodies as determined by ELISA. Positive control: plasma of TadA vaccinated animals or commercial Cas9-specific antibody at a concentration of 200 ng ml−1 (n = 2). Unless otherwise stated, values represent mean ± s.d. of n = 3 animals. Means were compared using two-tailed unpaired t-tests. vg, vector genomes.
Fig. 2
Fig. 2. LNP-mediated ABE mRNA delivery leads to transient base editing without inducing substantial off-target deamination in the transcriptome.
a, LNPs co-formulated with ABE mRNA and sgRNA_mP01 were systemically delivered. The top panel depicts ABEmax mRNA expression assessed by RT–qPCR. The middle panel depicts editing rates assessed by Sanger sequencing. The bottom panel depicts Pcsk9 mRNA levels assessed by RT–qPCR. The line represent mean of n = 2 animals per time point. b, Expression and localization of ABEmax mRNA 2 h or 12 h after injection of 3 mg kg−1 LNP assessed by smFISH in the liver. Twelve hours after injection, mRNA is predominantly cytoplasmatic. Blue, DAPI; white, ABEmax mRNA. Scale bar, top panel, 100 µm; scale bar, bottom panel, 20 µm. smFISH was performed once. c, Top, RNA-wide A-to-I editing assessed by whole-transcriptome sequencing. Each dot represents one editing event. The total number of editing events is indicated above. Each lane represents one individual biological replicate per animal. In vitro RNA-seq data are from HEK293T cells that were co-transfected with plasmids expressing ABEmax and sgRNA_mP01. Means of all replicates per sample were compared using one-tailed unpaired t-test for ex vivo samples and one-way ANOVA for in vivo samples. Bottom, telative TadA transcript expression in transcripts per million (TPM). NS, not significant.
Fig. 3
Fig. 3. In vivo adenine base editing of Pcsk9 does not induce substantial off-target mutations in DNA.
a, Total number of A-to-G (including T-to-C) edits per genome. Clones from untreated control (n = 3), LNP-treated (n = 6) and AAV-treated (n = 6) mice. Box plots are standard Tukey plots. The centerline represents the median; the lower and upper hinges represent the first and third quartiles; and the whiskers represent ±1.5× the interquartile range. Two-tailed unpaired t-tests were used to compare means. b, Relative contributions of single-base substitutions in clones shown in a. Values represent mean ± s.d. Two-tailed unpaired t-tests were used to compare means. c, Heat map showing the cosine similarity of mutational signatures of control clones (untreated and CBE-treated) and ABE-treated clones (LNP and AAV) to a predetermined TadA signature. 1 (match) and 0 (no similarity). For details on the clones, see Supplementary Fig. 6. In positive control clones, a TadA-specific trinucleotide mutation pattern was computationally added. d, sgRNA-dependent off-target sites of sgRNA-mP01 identified by CIRCLE-seq. The top ten off-target sites were analyzed by NGS in Hepa1-6 cells 5 d after transfection with plasmids encoding ABEmax and sgRNA_mP01 (in vitro) and in primary hepatocytes isolated from LNP-treated mice (3 mg kg−1, re-dose), AAV-treated mice (ABEmax) and untreated C57BL/6J mice. The second off-target site could not be determined (n.d.) owing to repetitiveness of the locus. Values represent the highest A-to-G conversion frequency within the protospacer. n = 3 biological replicates per treatment. e, Alb-Cre × Trp53flox/flox mice treated with AAVs expressing ABEmax and sgRNA_mP01 5 weeks after birth. Depicted is the HCC-free survival of mice. n = number of animals per group. f, Histopathology of liver samples from wild-type C57BL/6J animals and Alb-Cre × Trp53flox/flox animals. C57BL/6J animals untreated (n = 3), treated with LNP (n = 3) or treated with AAV (n = 3) were analyzed after 18 or 25 weeks, respectively. Alb-Cre × Trp53flox/flox animals untreated (n = 28), treated with control AAV (C-terminal part of the split system and a non-targeting sgRNA) (n = 18) or treated with the PCSK9-targeting AAV (n = 25) were analyzed after 1 year. H&E staining was performed on all animals; three pictures per animal were taken. Representative images are shown. (H&E; scale bar, 50 µm).
Fig. 4
Fig. 4. In vivo adenine base editing of the PCSK9 locus in the liver of macaques.
a, Schematic outline of the experiments. Levels of ALT (b), TNF-α (b) and IP-10 (c). Day 15 is before re-dosing; Day 15, 6 h is 6 h after re-dosing. e, Histopathology of liver samples from untreated, 1.5 mg kg−1 single-dosed and 1.5 mg kg−1 re-dosed animals. Three different liver lobes of all animals of the high-dose groups were examined by a trained pathologist. Only very mild lobular mixed inflammatory cell infiltration was observed (white arrowhead). Black arrowheads indicate portal tracts. H&E; scale bar, 200 μm. f, Percent editing in treatment groups (six liver biopsies per animal analyzed). g, PCSK9 levels. Serum from two time points before (Day –12 and Day −1) and after (Day 22 and Day 29) treatment was analyzed. *P = 0.020 (1.5 mg kg−1); *P = 0.027 (1.5 mg kg−1 re-dose). h, LDL levels. Serum from two time points before (Day –12 and Day –1) and after (Day 22 and Day 29) treatment was analyzed. NS = 0.091; **P = 0.008. i, Background-subtracted absorbance (A450 – A540) representing the relative amount of anti-Cas9-specific IgG antibodies. 5% BSA coating was used to determine background levels. Means were compared to Day −1. *P = 0.0095. j, Background-subtracted absorbance (A450 – A540) representing the relative amount of anti-TadA-specific IgG antibodies. Means were compared to Day −1. *P = 0.0336, **P = 0.0026. k, Editing rates in DNA isolated from other tissues than the liver. l, sgRNA-dependent off-target sites of sgRNA_hP01 in the human genome identified using CIRCLE-seq. The top eight hits with orthologous sites in M. fasciularis were analyzed by NGS in vitro (HepG2 cells transfected with plasmids encoding ABEmax and sgRNA_hP01) and in vivo (3 mg kg−1 single-dosed and re-dosed). Values represent the highest A-to-G conversion frequency within the protospacer. n = 3 biological replicates per treatment. Control: DNA isolated from untreated HepG2 cells and macaque blood cells before treatment. MM, mismatches between the human and M. fasciularis genome. Values represent mean ± s.d. of n = 3 animals. Means were compared using one-tailed paired t-test.

Comment in

References

    1. Jinek M, et al. A programmable dual-RNA-guided DNA endonuclease in adaptive bacterial immunity. Science. 2012;337:816–821. doi: 10.1126/science.1225829. - DOI - PMC - PubMed
    1. Hsu, P. D., Lander, E. S. & Zhang, F. Development and applications of CRISPR–Cas9 for genome engineering. Cell10.1016/j.cell.2014.05.010 (2014). - PMC - PubMed
    1. Mao, Z., Bozzella, M., Seluanov, A. & Gorbunova, V. Comparison of nonhomologous end joining and homologous recombination in human cells. DNA Repair10.1016/j.dnarep.2008.06.018 (2008). - PMC - PubMed
    1. van den Bosch, M., Lohman, P. H. M. & Pastink, A. DNA double-strand break repair by homologous recombination. Biol. Chem.10.1515/BC.2002.095 (2002). - PubMed
    1. Liu, M. et al. Methodologies for improving HDR efficiency. Front. Genet.10.3389/fgene.2018.00691 (2019). - PMC - PubMed

Publication types