. 2021 Jun;594(7863):398-402.
doi: 10.1038/s41586-021-03552-w. Epub 2021 May 19.

Interpreting type 1 diabetes risk with genetics and single-cell epigenomics

Affiliations

Interpreting type 1 diabetes risk with genetics and single-cell epigenomics

Joshua Chiou et al. Nature. 2021 Jun.

Abstract

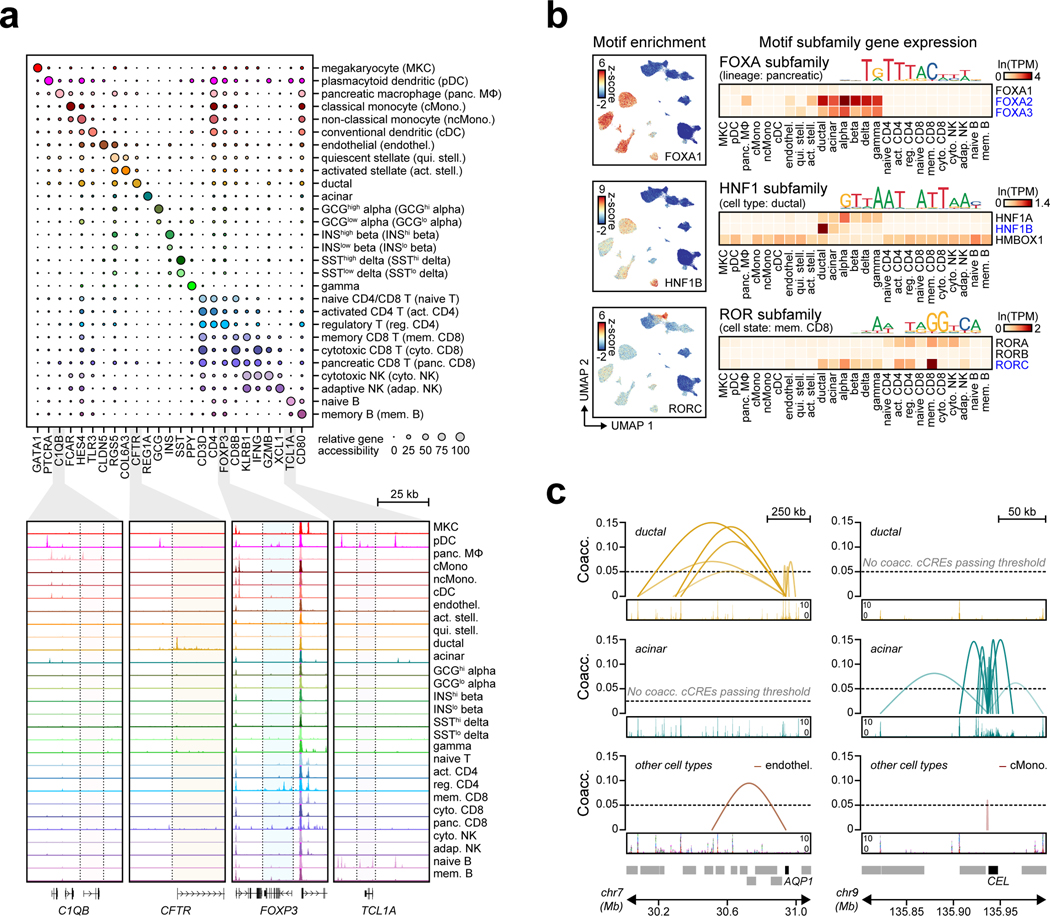
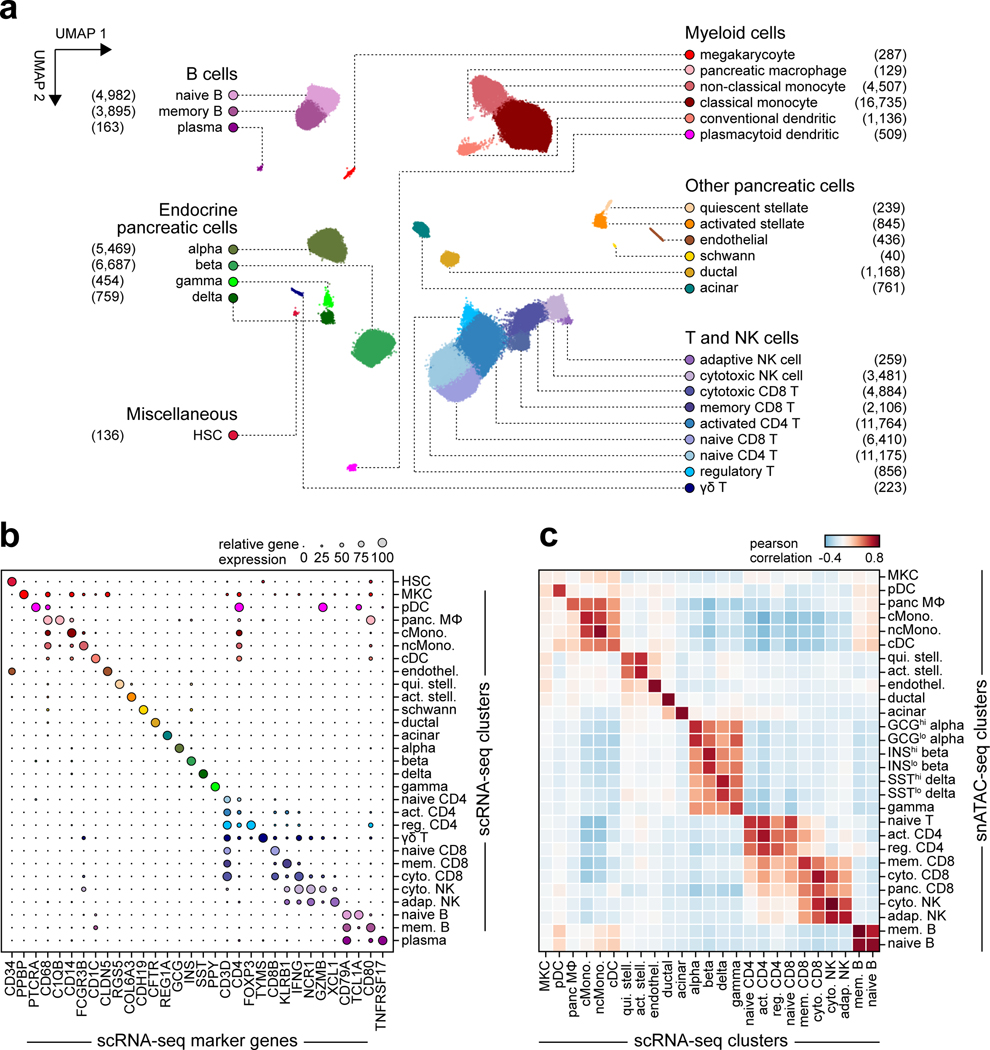
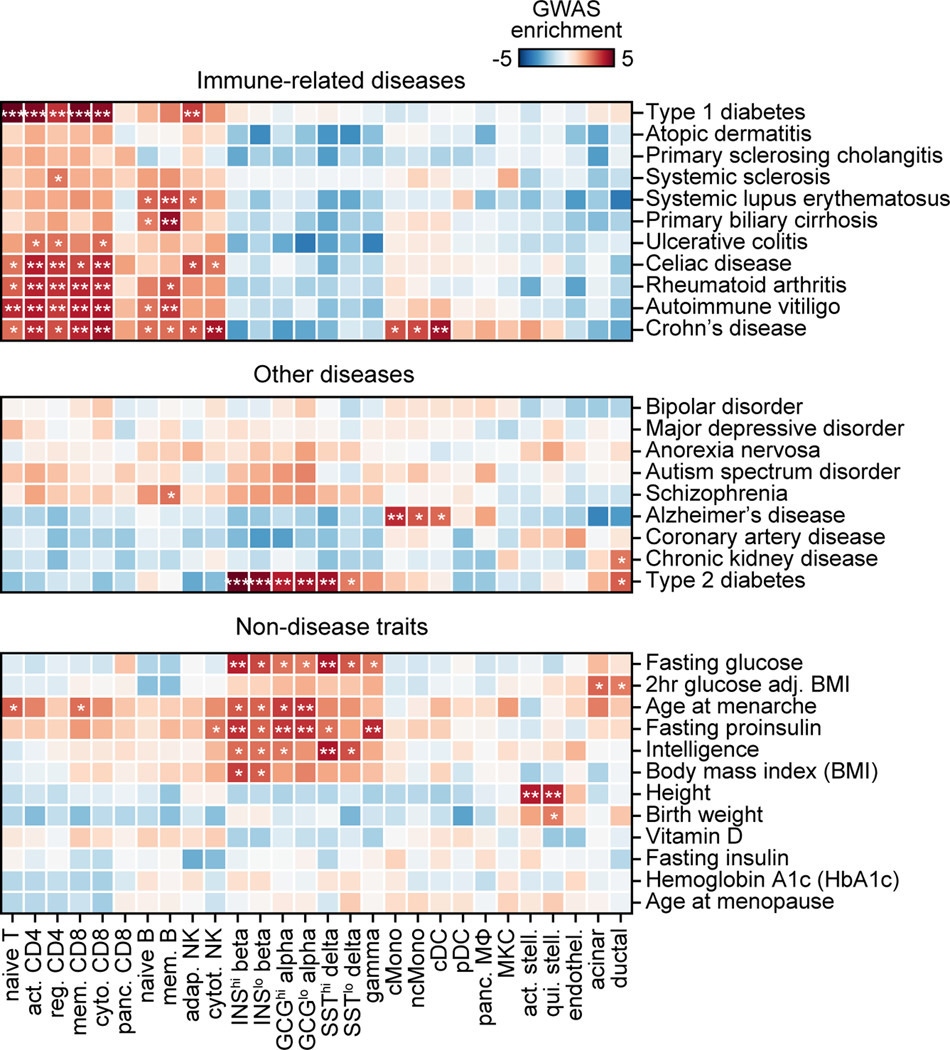
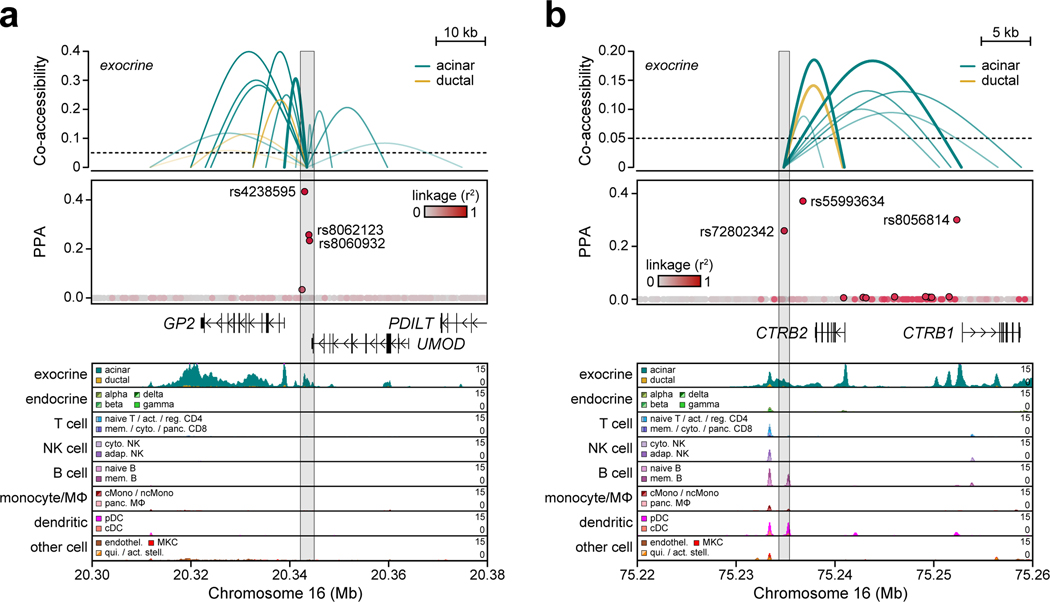
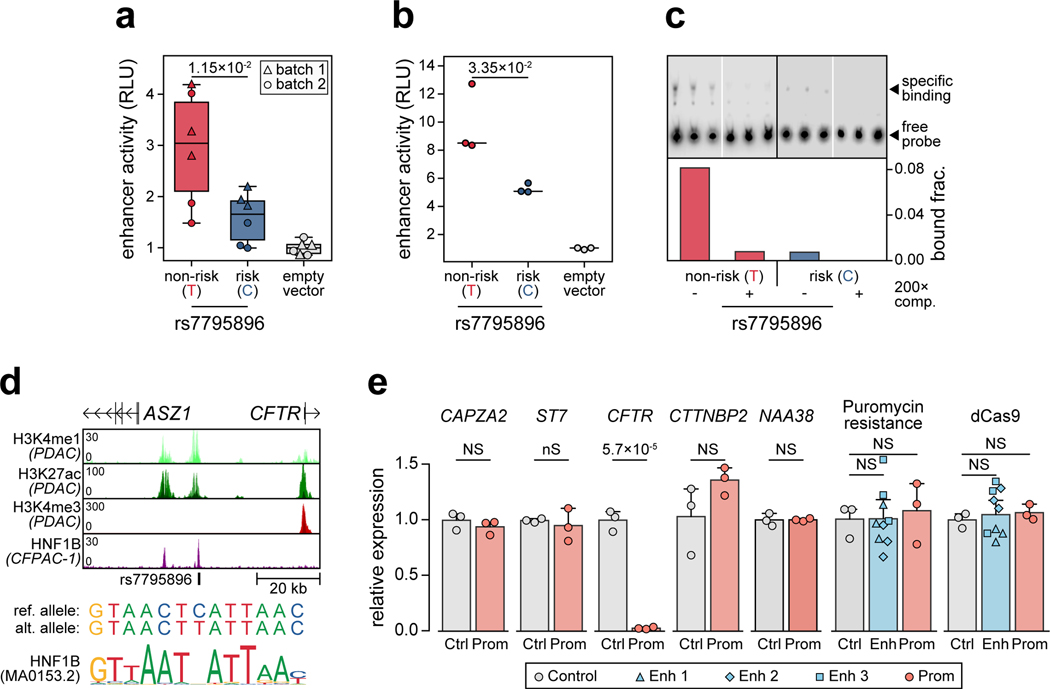
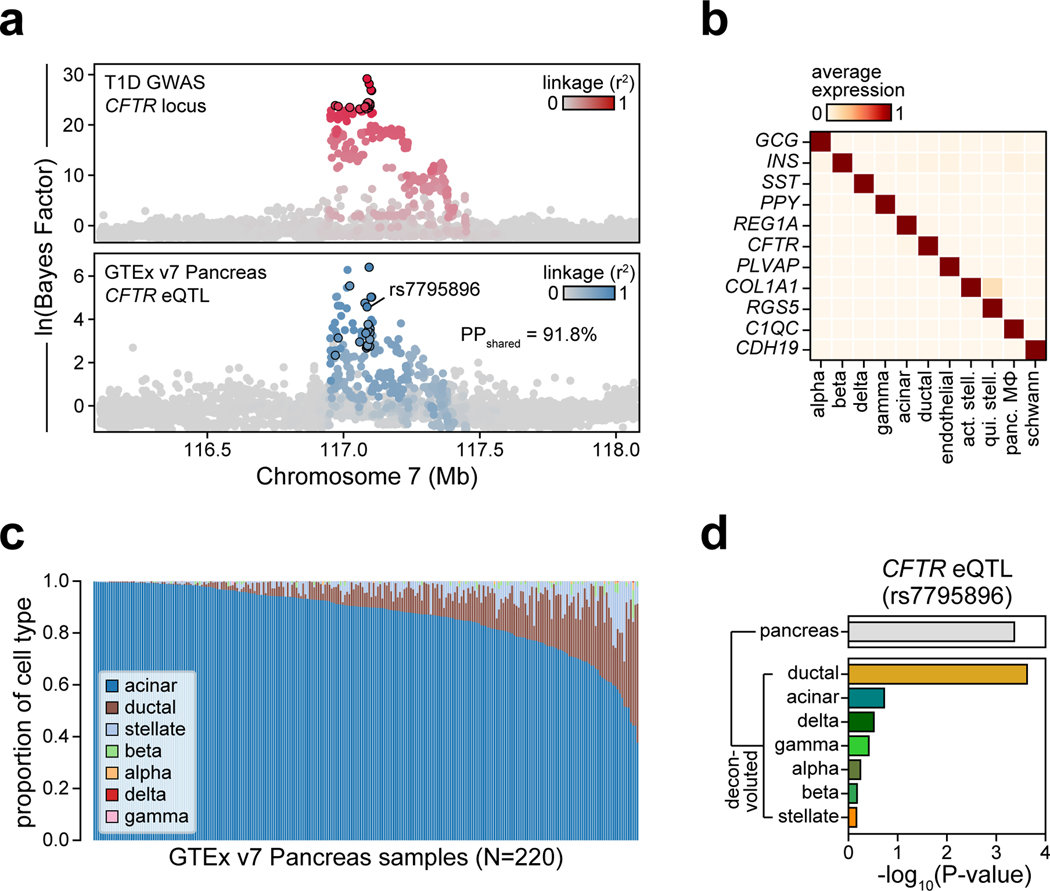
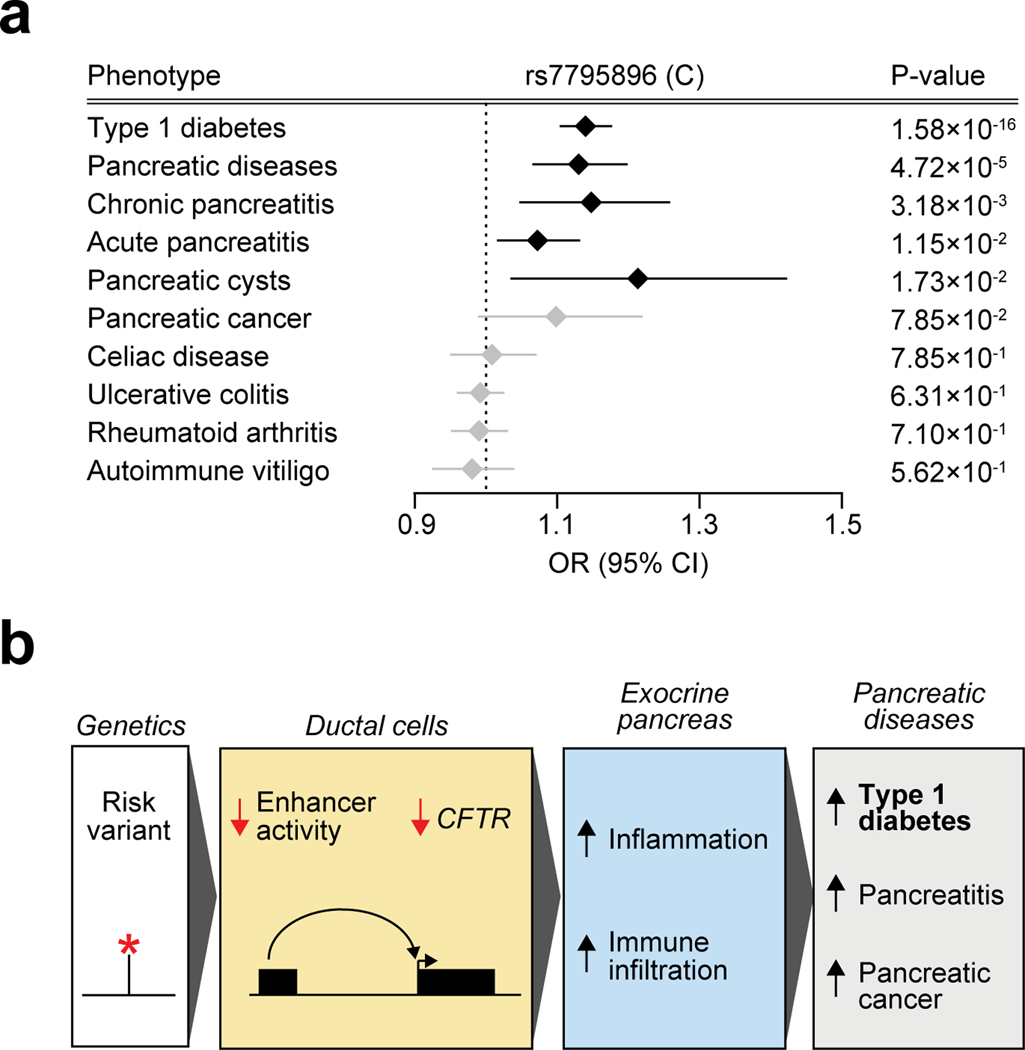
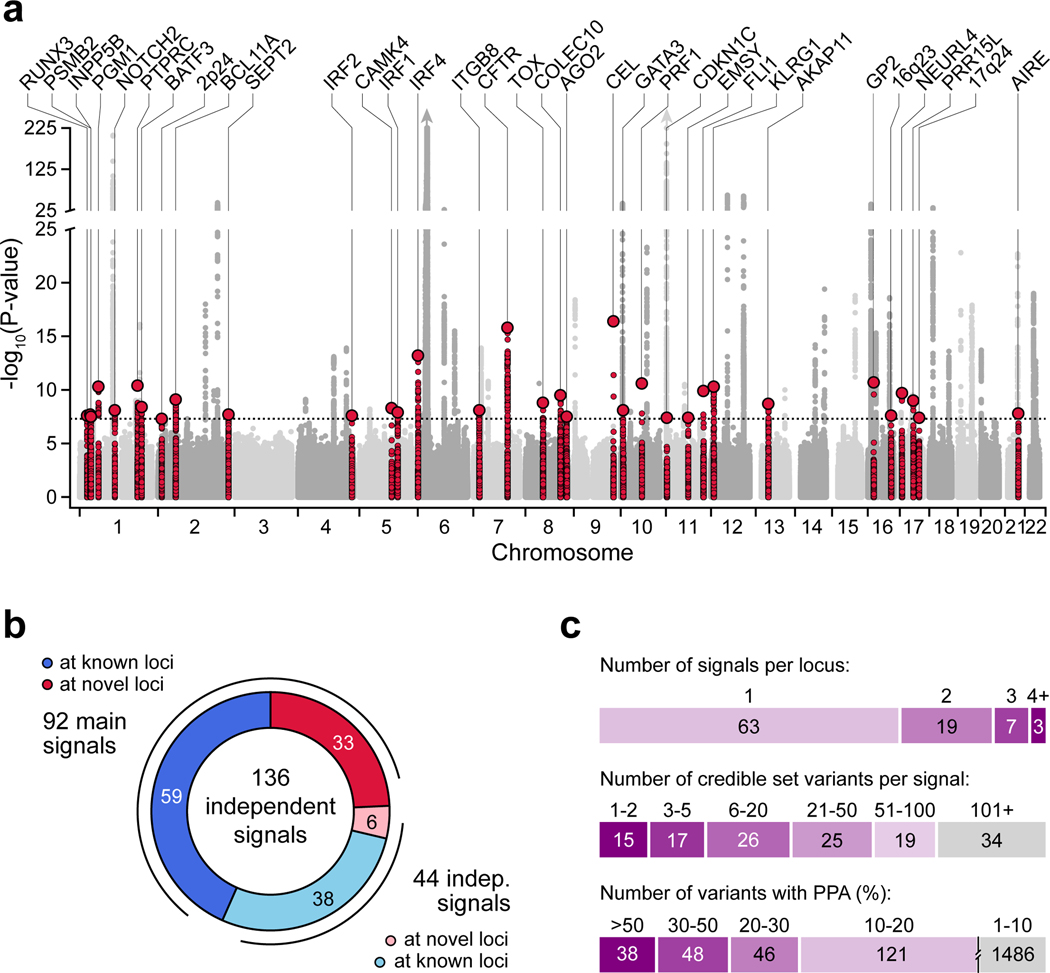
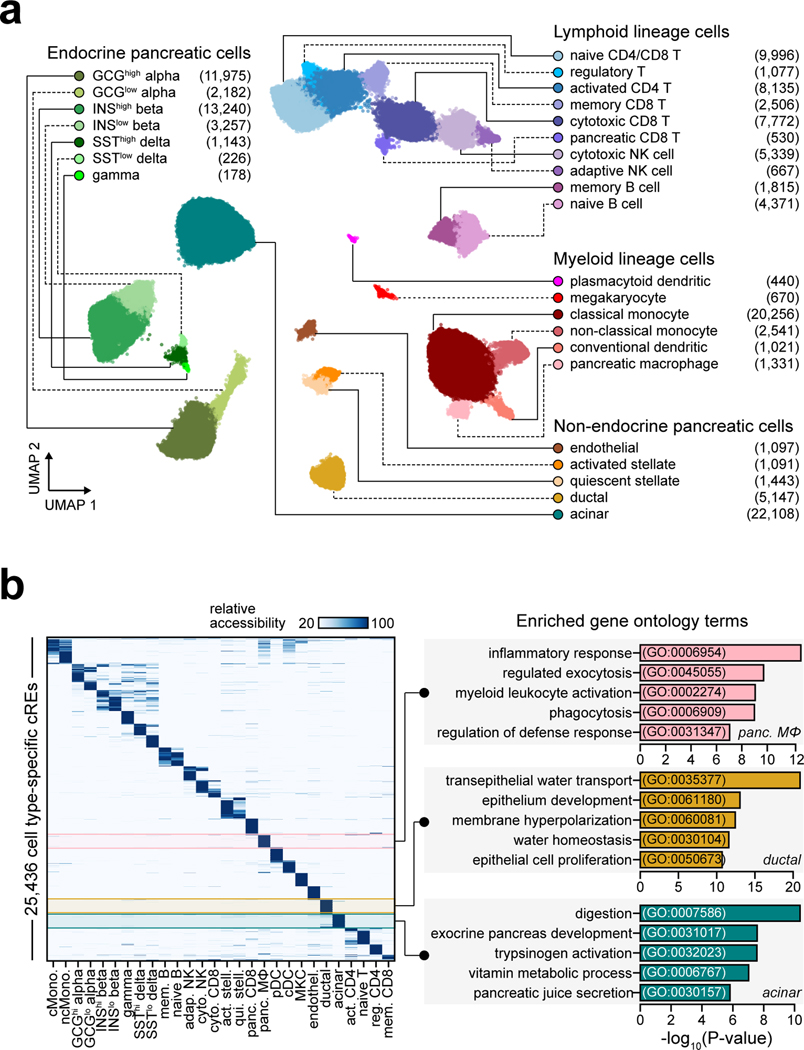
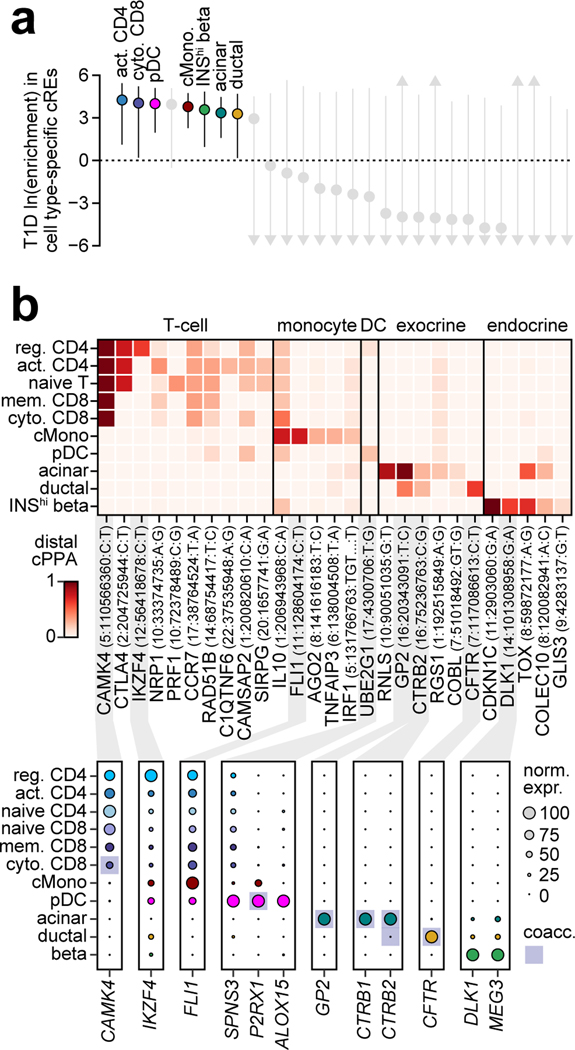
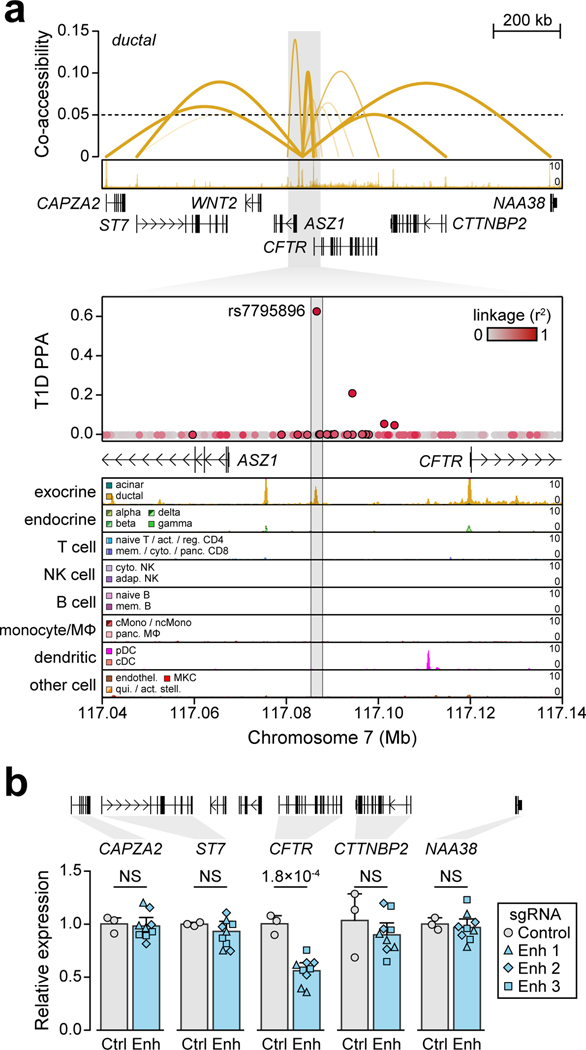
Genetic risk variants that have been identified in genome-wide association studies of complex diseases are primarily non-coding1. Translating these risk variants into mechanistic insights requires detailed maps of gene regulation in disease-relevant cell types2. Here we combined two approaches: a genome-wide association study of type 1 diabetes (T1D) using 520,580 samples, and the identification of candidate cis-regulatory elements (cCREs) in pancreas and peripheral blood mononuclear cells using single-nucleus assay for transposase-accessible chromatin with sequencing (snATAC-seq) of 131,554 nuclei. Risk variants for T1D were enriched in cCREs that were active in T cells and other cell types, including acinar and ductal cells of the exocrine pancreas. Risk variants at multiple T1D signals overlapped with exocrine-specific cCREs that were linked to genes with exocrine-specific expression. At the CFTR locus, the T1D risk variant rs7795896 mapped to a ductal-specific cCRE that regulated CFTR; the risk allele reduced transcription factor binding, enhancer activity and CFTR expression in ductal cells. These findings support a role for the exocrine pancreas in the pathogenesis of T1D and highlight the power of large-scale genome-wide association studies and single-cell epigenomics for understanding the cellular origins of complex disease.


Figures

Extended Data Figure 1.
Extended Data Figure 1.. Independent association signals at T1D risk loci.
Bayes factors (natural log-transformed) for independent association signals at the known PTPN2 locus (left) and the novel BCL11A locus (right). Variants are colored based on linkage disequilibrium (r2) with the index variant for each signal.
Extended Data Figure 2.
Extended Data Figure 2.. Rare variants with large effects on T1D risk.
(a) The relationship between minor allele frequency and T1D odds ratios (OR) for index variants at 136 T1D signals. Signals with common index variants and larger effect size estimates (PTPN22 1:114377568:A:G and INS 11:2182224:A:T) or rare index variants (MAF<0.005) are labeled. Points and lines represent estimates for OR and 95% CI. (b) Comparison of OR across cohorts for rare variants. Missing values indicate that the variant was not tested in the cohort. Points and lines represent estimates for OR and 95% CI.
Extended Data Figure 3.
Extended Data Figure 3.. Genetic correlations between T1D and other traits.
Genetic correlations between T1D and immune-related diseases (left), other diseases (middle), and non-disease traits (right), adj.=adjusted, circ.=circumference. Two-sided p-values are adjusted for multiple comparisons with false discovery rate (FDR). Colors indicate significance: red – correlation is significant after FDR correction (FDR<0.1), black – correlation is nominally significant (p<0.05) but not significant after FDR correction, and grey – correlation is not significant. Points and lines represent genetic correlation estimates and 95% CI.
Extended Data Figure 4.
Extended Data Figure 4.. Annotations derived from single cell chromatin accessibility of T1D-relevant tissues.
(a) Relative gene accessibility (column-normalized chromatin accessibility reads in gene bodies) showing examples of marker genes used to identify cluster labels. Aggregated chromatin accessibility profiles in a 50 kb window around selected marker genes (bottom). (b) Single cell motif enrichment z-scores (left) and expression of motif subfamily members (right) for examples of TFs with lineage-, cell type-, or cell state-specific motif enrichment and expression. TFs with matching motif enrichment and expression are highlighted. (c) Co-accessibility between AQP1 and cCREs in ductal cells (left) and CEL and cCREs in acinar cells (right).
Extended Data Figure 5.
Extended Data Figure 5.. Single cell RNA-seq reference map of PBMCs and pancreatic islets.
(a) Clustering of 90,495 expression profiles from single cell RNA-seq experiments of peripheral blood mononuclear cells and pancreatic islets from published studies. Cells are plotted on the first two UMAP components and colored based on cluster assignment. The number of cells in each cluster is shown next to its corresponding label. HSC, hematopoietic stem cell. γδ T, gamma delta T. pDC, plasmacytoid dendritic. (b) Relative gene expression (average expression for all cells within a cluster and scaled from 0–100 across clusters) showing examples of marker genes used to assign cluster labels. (c) Pearson correlation coefficient between gene expression and promoter accessibility specificity scores using a list containing the top 100 most specific genes for each scRNA-seq cluster found in snATAC-seq.
Extended Data Figure 6.
Extended Data Figure 6.. GWAS enrichment for T1D compared to other diseases and traits
Stratified LD score regression coefficient z-scores for autoimmune and inflammatory diseases (top), other diseases (middle), and non-disease quantitative endophenotypes (bottom) for cCREs active in immune and pancreatic cell types. Two sided p-values were calculated from z-scores and multiple test correction was performed using FDR. ***FDR<0.001 **FDR<0.01 *FDR<0.1.
Extended Data Figure 7.
Extended Data Figure 7.. Fine mapped variants linked to exocrine-specific genes
(a) The GP2 locus contains three variants in a distal cCRE co-accessible with the GP2 promoter in acinar cells which account for the majority of the causal probability (cPPA=0.98). Chromatin accessibility at both the distal cCRE and the GP2 promoter is highly specific to acinar cells. (b) Variant rs72802342 at the CTRB1/2/BCAR1 locus overlaps a distal cCRE co-accessible with the CTRB2 and CTRB1 promoters in acinar cells. Chromatin accessibility at the CTRB1 and CTRB2 promoters is highly specific to acinar cells. Variants contained in the 99% credible set are circled in black.
Extended Data Figure 8.
Extended Data Figure 8.. rs7795896 has allelic effects on ductal enhancer activity.
(a) Relative luciferase units (RLU) for reporter containing 594 bp sequence surrounding rs7795896 in Capan 1 (n=6; 2 batches × 3 transfections). Center line, median; box limits, 25th and 75th percentiles; whiskers extend to 1.5× the IQR from the 25th and 75th percentiles. P-value by two-sided, two-way ANOVA. (b) Luciferase reporter assay in Capan-1 cells transfected with pGL4.23 minimal promoter plasmids containing rs7795896 in the forward orientation. Relative luciferase units (RLU) represent Firefly:Renilla ratios normalized to control cells transfected with the empty pGL4.23 vector. P-value by two-sided Student’s t-test. (c) Electrophoretic mobility shift assay with nuclear extract from Capan-1 using probes for rs7795896 alleles, with or without 200× unlabeled competitor probe (200× comp.). Quantification of the bound fraction (specific binding / free probe). Data are from n=1 experiment. (d) rs7795896 overlaps histone marks of active enhancers (H3K4me1, H3K27ac; region: chr7:117,050,000–117,125,000, hg19) but not promoters (H3K4me3) in pancreatic ductal adenocarcinoma cell lines (PDAC: Capan-1, Capan-2, and CFPAC-1). rs7795896 overlaps a ChIP-seq peak for the transcription factor HNF1B in CFPAC-1 cells and a predicted HNF1B motif. (e) Relative expression for genes in a 2 Mb window around rs7795896 with non-zero expression and the puromycin resistance and dCas9 genes. Ctrl n=3 biological replicates; Enh n=9, 3 sgRNAs × 3 biological replicates; Prom n=3 biological replicates. Data are mean ± 95% CI. P-values by two-sided Student’s t-test (Prom vs Ctrl) or two-sided ANOVA (Enh vs Ctrl); NS, not significant.
Extended Data Figure 9.
Extended Data Figure 9.. rs7795896 affects CFTR expression levels in ductal cells.
(a) Bayesian colocalization of T1D signal and CFTR pancreas eQTL. Variants in the T1D credible set are circled. (b) Expression of pancreatic cell type marker genes from scRNA-seq. (c) Proportions of selected pancreatic cell types estimated by MuSiC for 220 bulk pancreas RNA-seq samples from the GTEx v7 release using single cell expression profiles. (d) -log10 transformed two-sided uncorrected p-values from linear regression interaction between dosage and cell type proportion for the CFTR pancreas eQTL.
Extended Data Figure 10.
Extended Data Figure 10.. Relationship between T1D and other pancreatic diseases.
(a) rs7795896 GWAS association for T1D (from full meta-analysis), pancreatic disease, and autoimmune disease. Points and lines represent odds ratio estimates and 95% CI. Two-sided p-values from GWAS meta-analysis are unadjusted for multiple comparisons. (b) Variants regulating genes with specialized exocrine pancreas function influence T1D risk, and we hypothesize these effects are mediated through inflammation and immune infiltration.
Figure 1.
Figure 1.. Genome-wide association and fine-mapping identifies novel T1D risk signals.
(a) Genome-wide T1D association (two-sided -log10 transformed p-values from meta-analysis, unadjusted for multiple comparisons). Novel loci are colored (±250 kb of the index variant) and labeled based on the nearest gene. Dotted line indicates genome-wide significance (P=5×10⁻⁸). (b) Breakdown of 136 T1D risk signals, including 92 main signals (59 known and 33 novel), and 44 independent signals (38 at known and 6 at novel loci). (c) Number of signals per locus (top), 99% credible set variants from fine-mapping (middle), and variants with posterior probability of association (PPA) at various thresholds (bottom).
Figure 2.
Figure 2.. Reference map of single cell chromatin accessibility from T1D-relevant tissues.
(a) Leiden clustering of single cell accessible chromatin profiles from 131,554 cells. Cells are plotted on the first two UMAP components, clusters are grouped into categories of cell types, and the number of cells per cluster are in parentheses. (b) Relative accessibility (row-normalized) for 25,436 cCREs most specific to each cluster (left), and enriched gene ontology terms for cCREs specific to pancreatic macrophages, ductal, and acinar cells (right).
Figure 3.
Figure 3.. Cell type-specific enrichment and mechanisms of T1D risk variants.
(a) T1D enrichment within cell type-specific cCREs. Labeled cell types have positive enrichment and 95% CI lower bound >0. Data are natural log enrichment ± 95% CI from fgwas. (b) T1D signals with highest cumulative PPA (cPPA) in cCREs for disease-enriched cell types (>0.20 cPPA for T cells and monocytes, >0.10 cPPA for other groups), and >0.01 cPPA away from the next closest group (top). Column-normalized expression for genes with TPM>1 in the highlighted cell type(s) and within ±500 kb of the index variant. Genes co-accessible with cCREs containing risk variants are annotated in rectangles (bottom).
Figure 4.
Figure 4.. Fine-mapped T1D variant regulates CFTR in pancreatic ductal cells.
(a) Variant rs7795896 at the CFTR locus mapped in a cCRE co-accessible with CFTR and other genes. Zoomed-in view shows the cCRE is ductal-specific. (b) Expression of genes co-accessible with the distal cCRE in CRISPR-inactivated enhancer (Enh; n=9, 3 sgRNAs × 3 biological replicates) compared to non-targeting control (Ctrl; n=3 biological replicates) in Capan-1. Data are mean ± 95% CI. P-values by two-sided ANOVA; NS, not significant.

References

    1. Claussnitzer M. et al. A brief history of human disease genetics. Nature 577, 179–189 (2020). - PMC - PubMed
    1. ENCODE Project Consortium. An integrated encyclopedia of DNA elements in the human genome. Nature 489, 57–74 (2012). - PMC - PubMed
    1. Katsarou A. et al. Type 1 diabetes mellitus. Nat. Rev. Dis. Primer 3, 17016 (2017). - PubMed
    1. Onengut-Gumuscu S. et al. Fine mapping of type 1 diabetes susceptibility loci and evidence for colocalization of causal variants with lymphoid gene enhancers. Nat. Genet 47, 381–386 (2015). - PMC - PubMed
    1. Barrett JC et al. Genome-wide association study and meta-analysis find that over 40 loci affect risk of type 1 diabetes. Nat. Genet 41, 703–707 (2009). - PMC - PubMed

ADDITIONAL REFERENCES

    1. Purcell S. et al. PLINK: a tool set for whole-genome association and population-based linkage analyses. Am. J. Hum. Genet 81, 559–575 (2007). - PMC - PubMed
    1. McCarthy S. et al. A reference panel of 64,976 haplotypes for genotype imputation. Nat. Genet 48, 1279–1283 (2016). - PMC - PubMed
    1. 1000 Genomes Project Consortium et al. A global reference for human genetic variation. Nature 526, 68–74 (2015). - PMC - PubMed
    1. Das S. et al. Next-generation genotype imputation service and methods. Nat. Genet 48, 1284–1287 (2016). - PMC - PubMed
    1. Zhou W. et al. Efficiently controlling for case-control imbalance and sample relatedness in large-scale genetic association studies. Nat. Genet 50, 1335–1341 (2018). - PMC - PubMed

Publication types

Substances