. 2021 Jun;594(7861):117-123.
doi: 10.1038/s41586-021-03556-6. Epub 2021 May 19.

MIR-NATs repress MAPT translation and aid proteostasis in neurodegeneration

Affiliations

MIR-NATs repress MAPT translation and aid proteostasis in neurodegeneration

Roberto Simone et al. Nature. 2021 Jun.

Abstract

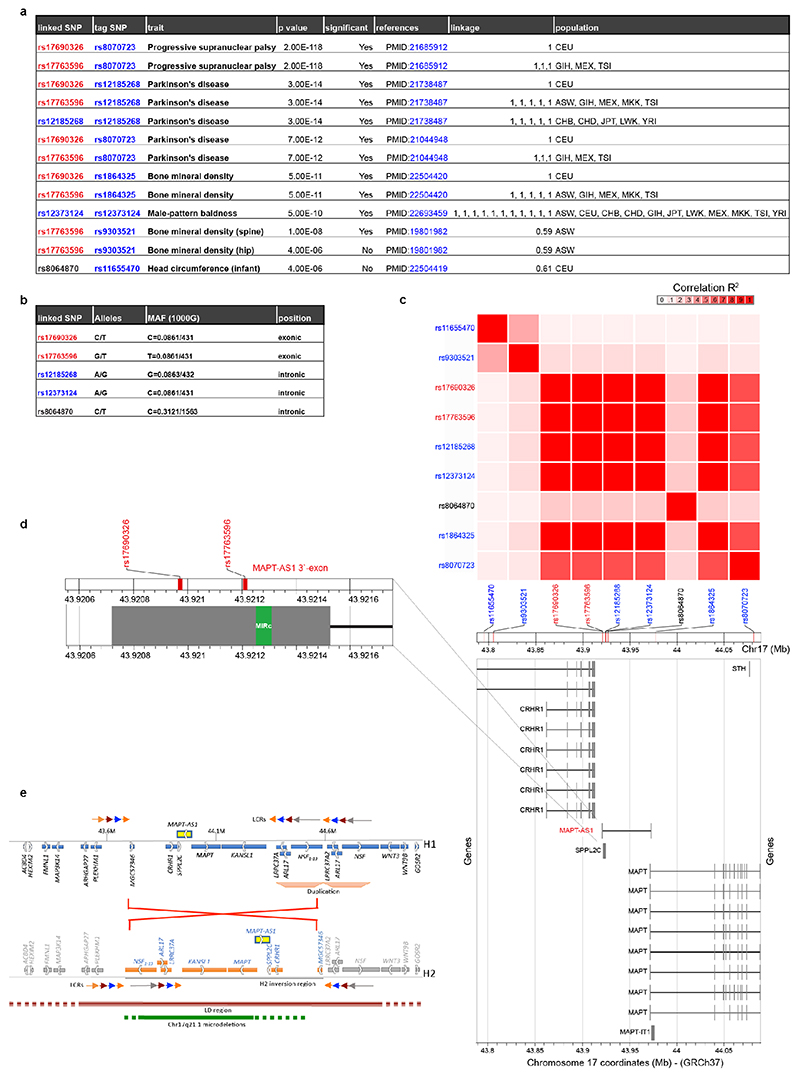
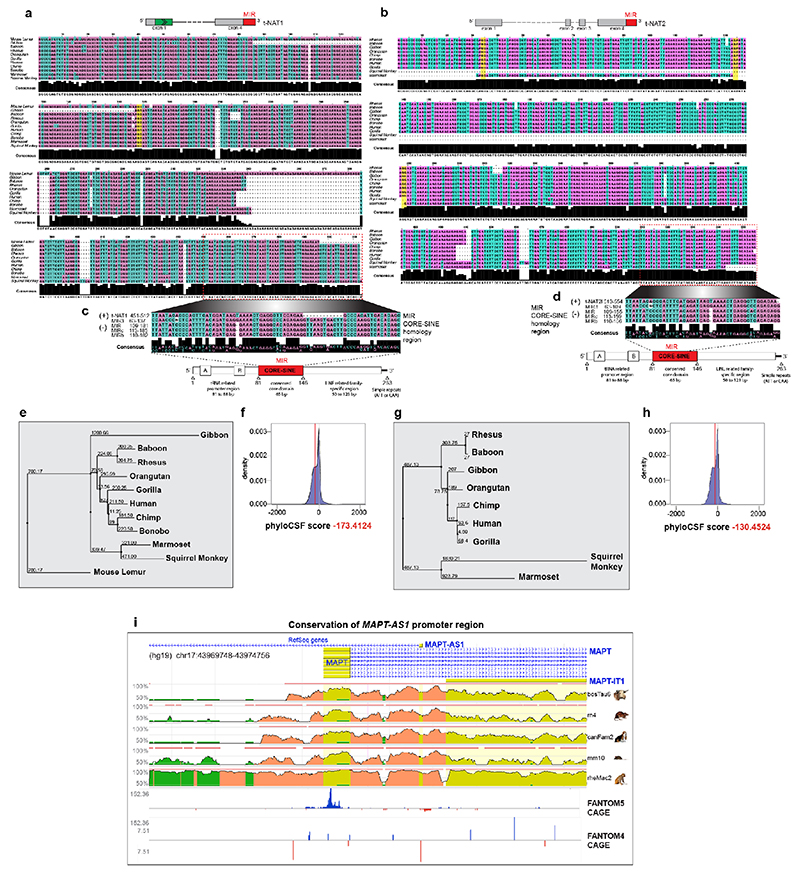
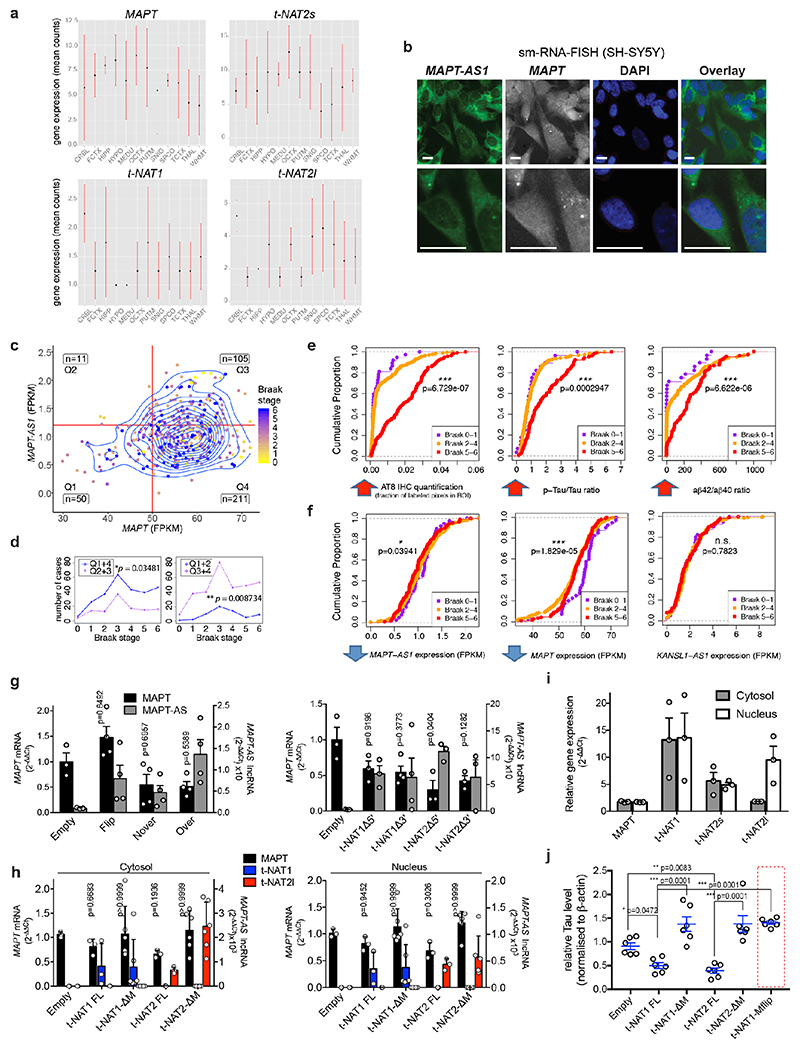
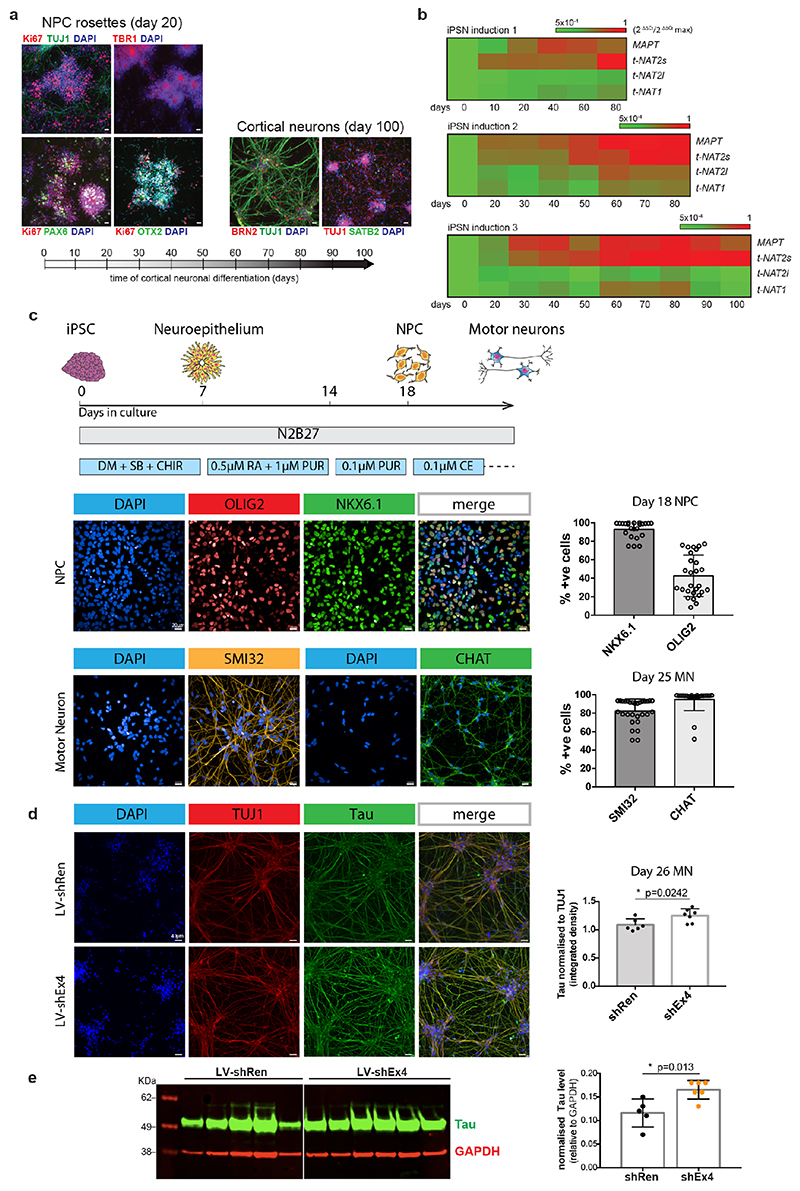
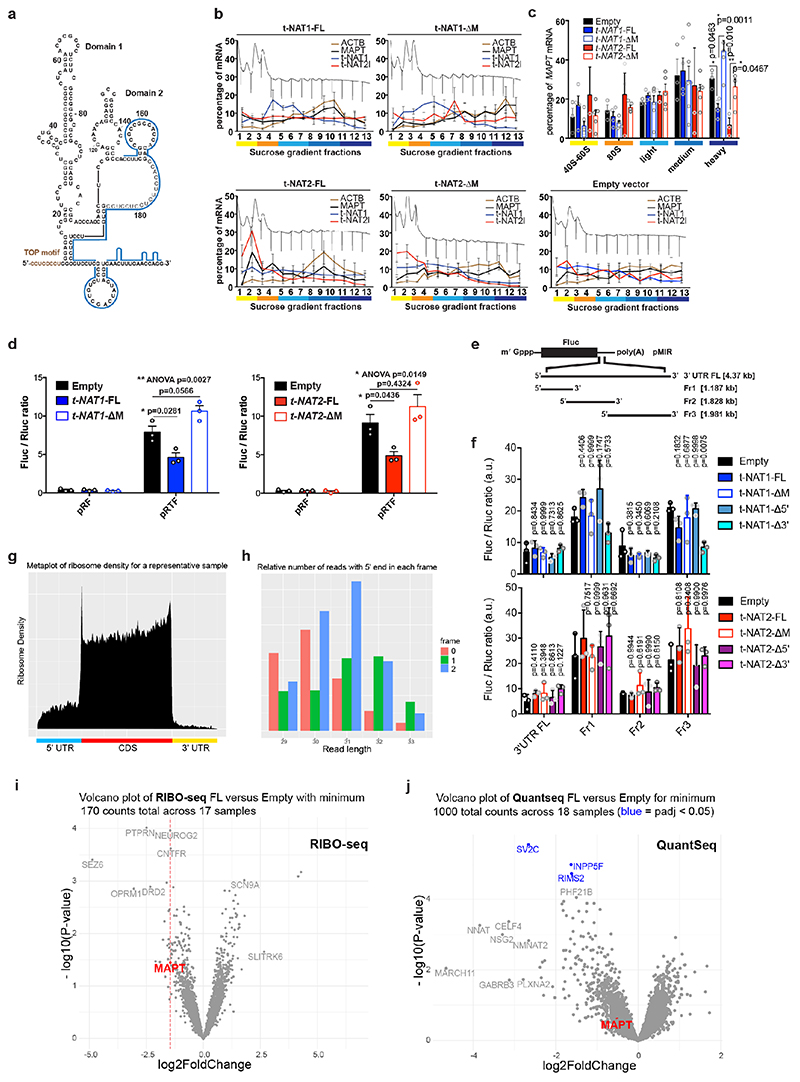
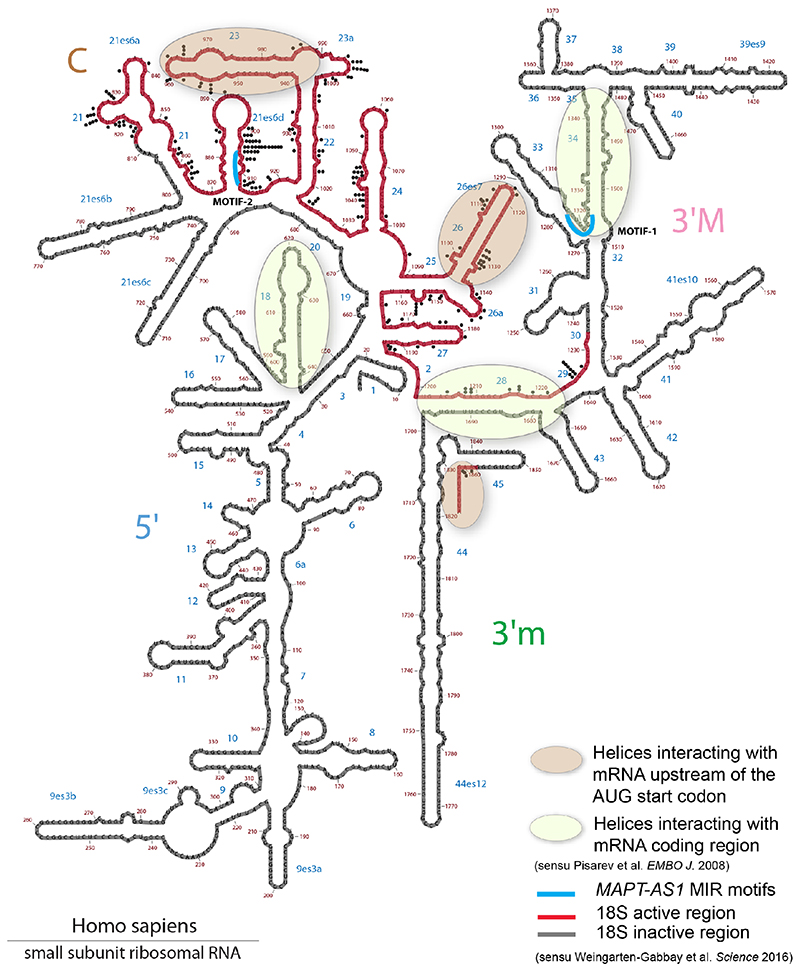
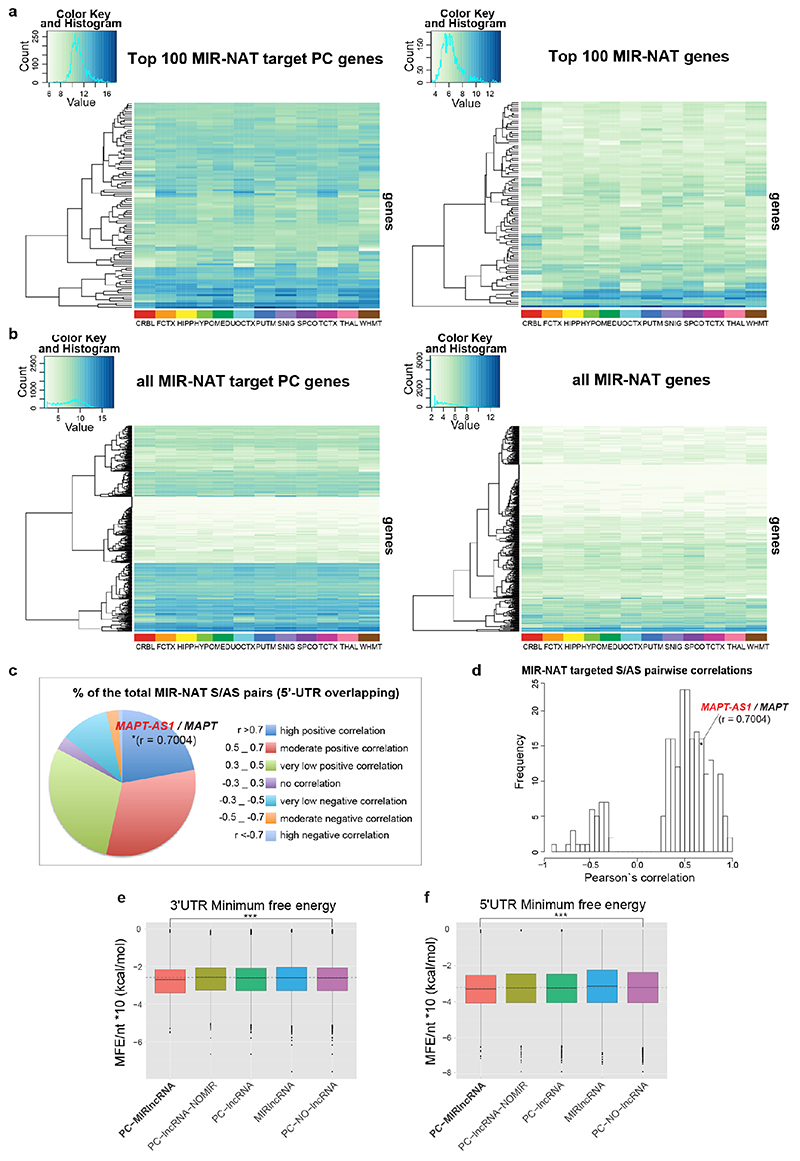
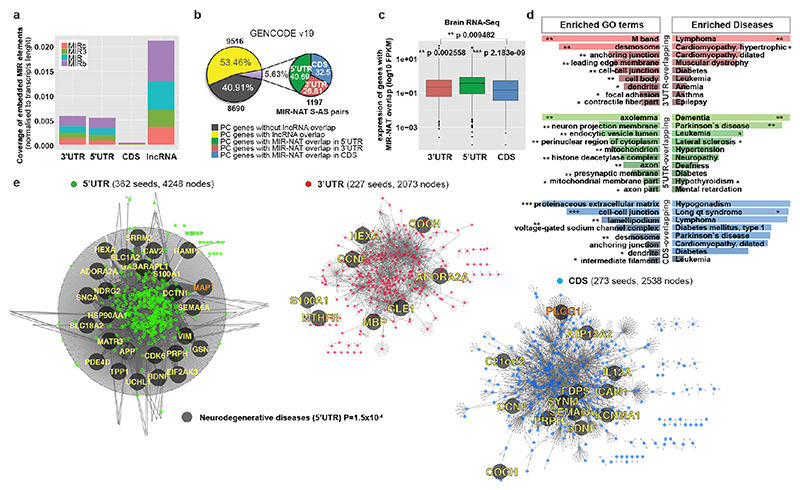
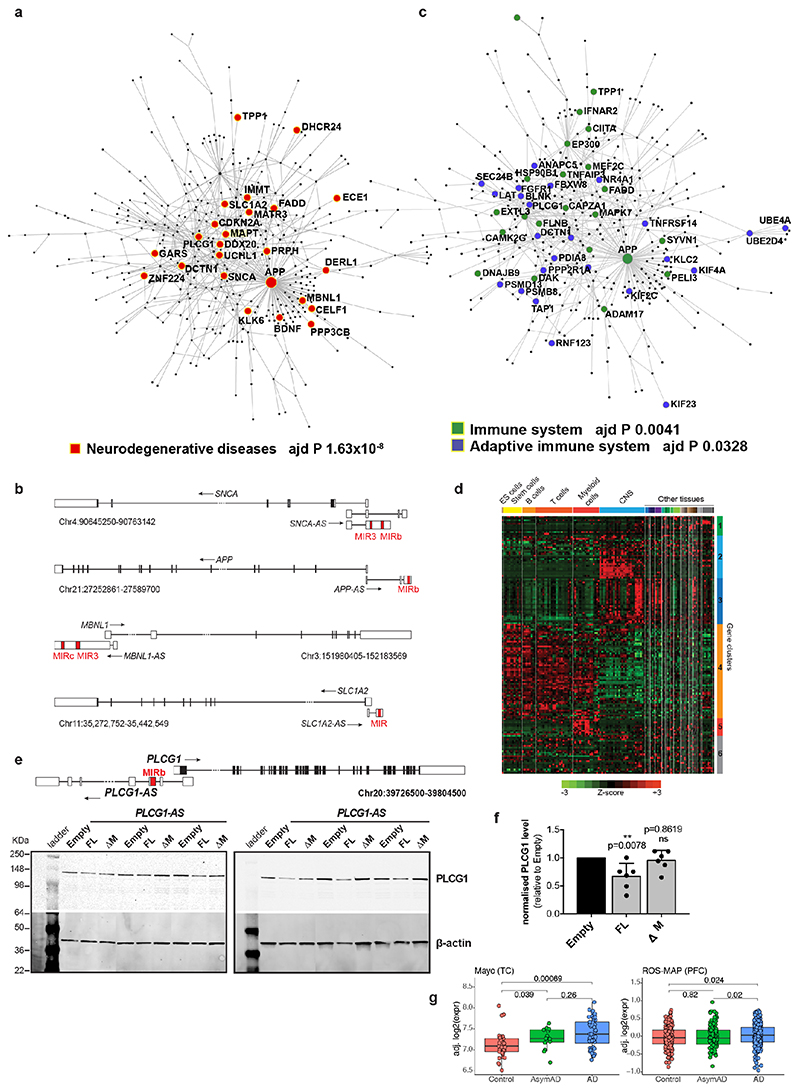
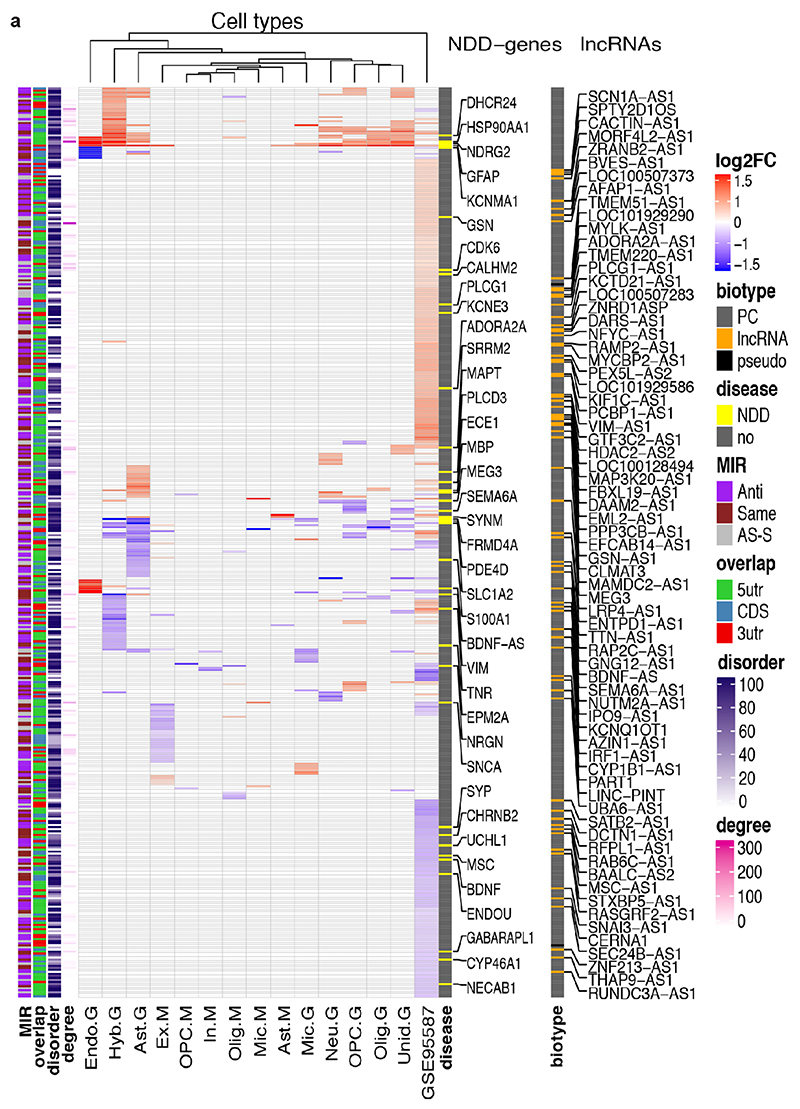
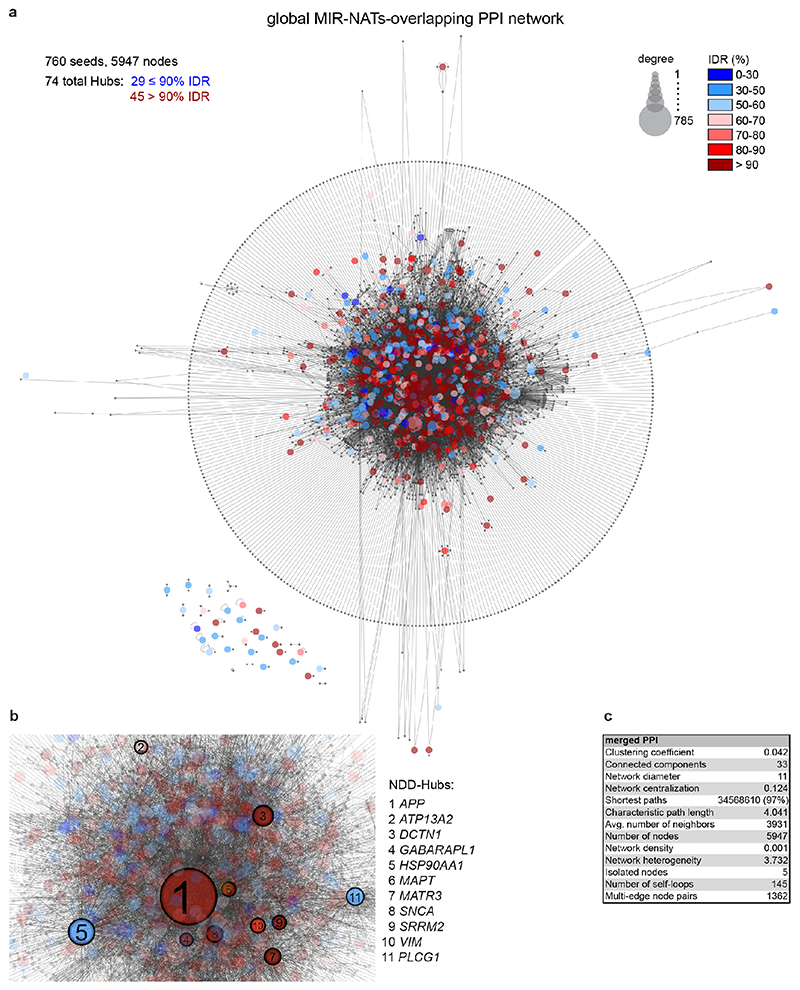
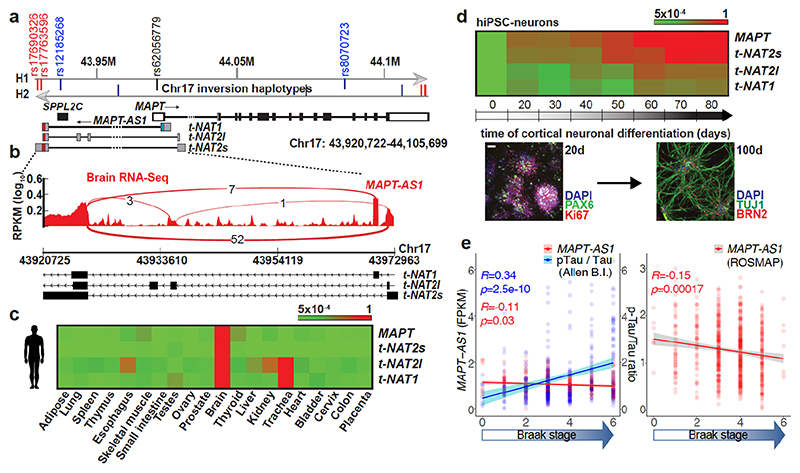
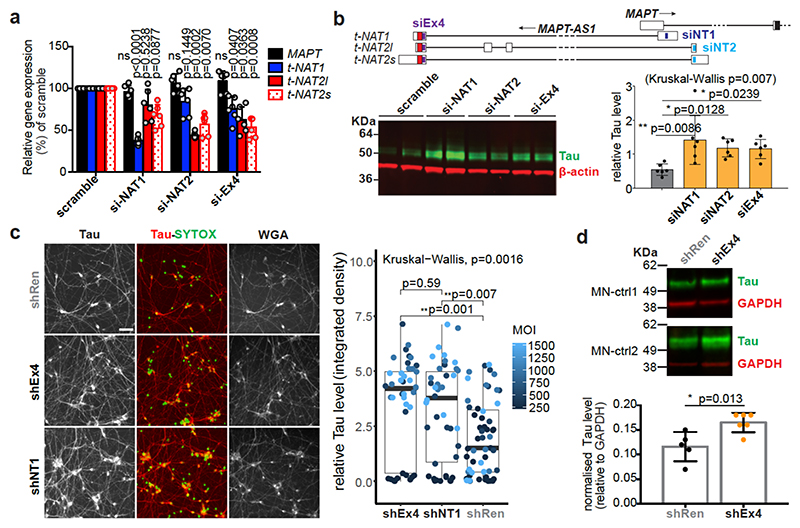
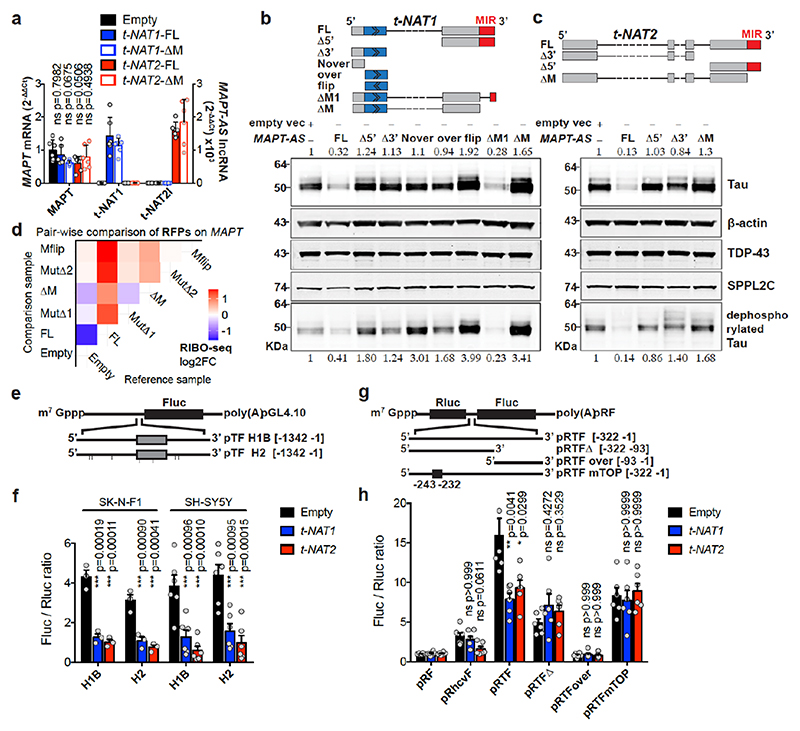
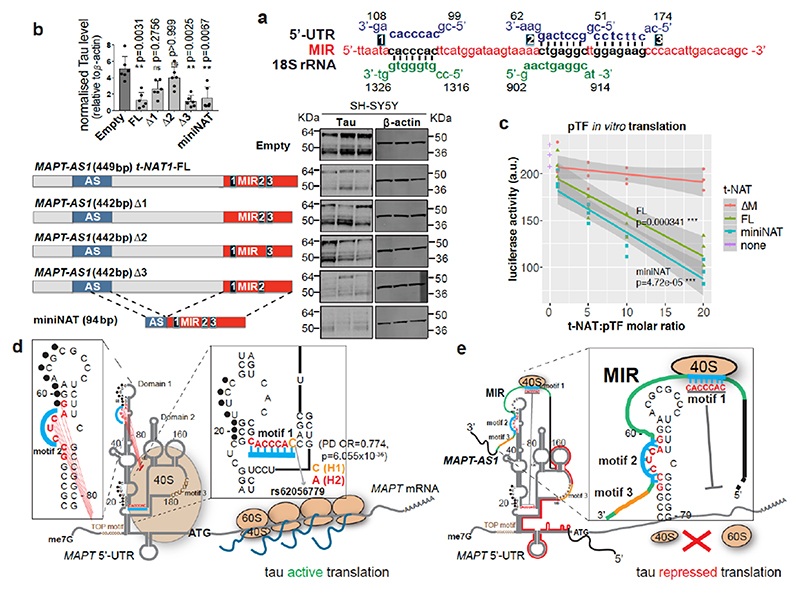
The human genome expresses thousands of natural antisense transcripts (NAT) that can regulate epigenetic state, transcription, RNA stability or translation of their overlapping genes1,2. Here we describe MAPT-AS1, a brain-enriched NAT that is conserved in primates and contains an embedded mammalian-wide interspersed repeat (MIR), which represses tau translation by competing for ribosomal RNA pairing with the MAPT mRNA internal ribosome entry site3. MAPT encodes tau, a neuronal intrinsically disordered protein (IDP) that stabilizes axonal microtubules. Hyperphosphorylated, aggregation-prone tau forms the hallmark inclusions of tauopathies4. Mutations in MAPT cause familial frontotemporal dementia, and common variations forming the MAPT H1 haplotype are a significant risk factor in many tauopathies5 and Parkinson's disease. Notably, expression of MAPT-AS1 or minimal essential sequences from MAPT-AS1 (including MIR) reduces-whereas silencing MAPT-AS1 expression increases-neuronal tau levels, and correlate with tau pathology in human brain. Moreover, we identified many additional NATs with embedded MIRs (MIR-NATs), which are overrepresented at coding genes linked to neurodegeneration and/or encoding IDPs, and confirmed MIR-NAT-mediated translational control of one such gene, PLCG1. These results demonstrate a key role for MAPT-AS1 in tauopathies and reveal a potentially broad contribution of MIR-NATs to the tightly controlled translation of IDPs6, with particular relevance for proteostasis in neurodegeneration.


Conflict of interest statement

Competing Interests

The authors (R.S. and R.dS.) declare the following competing interest: Patent WO2017199041A1

Figures

Extended Data Figure 1
Extended Data Figure 1. Linkage disequilibrium analysis of MAPT-AS1 region
(a) SNPs within MAPT-AS1 genomic region that are linked (R2≥0.5) to tagging SNPs from the NHGRI GWAS catalog are reported. The specific trait associated to each tagging SNP together with the p-value from the GWAS study and their cited publications PubMed ID are shown. All p-values ≤5x10⁻⁸ were considered to be significant. Linkage disequilibrium (LD) correlations (R2) were calculated using LDlink1.1 for different populations. ASW: Americans of African Ancestry in SW USA; CEU: Utah Residents (CEPH) with Northern and Western European Ancestry; CHB: Han Chinese in Beijing, China; CHD: Chinese in Metropolitan Denver, Colorado; GIH: Gujarati Indians in Houston, Texas; JPT: Japanese in Tokyo, Japan; LWK: Luhya in Webuye, Kenya; MXL: Mexican ancestry in Los Angeles, California; MKK: Maasai in Kinyawa, Kenya; TSI: Toscani in Italy; YRI: Yoruba in Ibadan, Nigeria. (b) For each linked SNP listed in (a), the minor allele frequency (MAF) from the 1000 Genomes Project is given, together with the exon/intron location. (c) Pairwise linkage disequilibrium heatmap created using LDmatrix (https://ldlink.nci.nih.gov/?tab=ldmatrix). Red squares of increasing hue indicate increasing LD correlation between SNPs. A physical map of the genomic region is reported together with annotated RefSeq transcripts for each gene. (d) Enlarged view of the MAPT-AS1 3’-exon (in grey) containing the inverted MIRc element (in green), with two exonic linked SNPs downstream (rs17690326, rs17763596). (e) Detailed scheme of the H1/H2 inversion haplotypes (hg19). All major annotated genes in the linkage disequilibrium (LD) region are coloured in blue for the H1 haplotype, and in orange for the H2 inversion haplotype, with a white arrow representing their relative orientation. Arrays of Low Copy Repeats (LCRs), delimiting the inversion region, are represented by tandem arrows. MAPT-AS1 gene is coloured in yellow.
Extended Data Figure 2
Extended Data Figure 2. Evolutionary conservation of t-NAT1 and -2 isoforms and MAPT-AS1 promoter region across primates
(a-b) Scheme of human t-NAT1 and t-NAT2l transcript isoforms, exons (grey), with the region of overlap with MAPT (green) and the inverted MIR element in 3’-end (red). Multiple sequence alignment of the human t-NAT1 and t-NAT2l transcripts with the genomic sequences of 10 non-human primates (baboon, bonobo, chimp, gibbon, gorilla, marmoset, mouse lemur, orangutan, rhesus, squirrel monkey). Sequences were aligned using MUSCLE 3.8, and graphically displayed using Jalview 2. Pyrimidines in cyan and purines in magenta; splice junction is highlighted in yellow. A consensus sequence is at the base of multialignment with bar plot representing percentage sequence identity. (e, g) Phylogenetic trees associated to t-NAT1 and t-NAT2l multi-alignment represented in (a-b), obtained with the neighbour joining method using Jalview 2. Numbers reported on each connecting line in the tree represent Jaccard distances based on pairwise sequence similarity. (f, h) Negative PhyloCSF score (https://github.com/mlin/PhyloCSF/wiki) showing low protein-coding potential of t-NAT1 and t-NAT2l. The plots represent distribution of scores for each codon in each frame within each t-NAT isoform, across 29 mammals. (c-d) Multi-alignment showing sequence similarity between 3’-ends of human t-NAT1 (388-449) and t-NAT2l (510-554) and consensus MIR elements of different subfamilies (MIR3, MIR, MIRb, MIRc), as annotated by RepeatMasker. Homology regions of 62 and 45 nt respectively, are shared with the CORE-SINE, a 65 nt evolutionarily conserved domain at the centre of each MIR repeat element, schematically represented here and originally described by. (i) Evolutionary conservation of MAPT-AS1 promoter region across 6 distant species (Homo sapiens, Macaca mulatta Mus musculus, Rattus norvegicus, Canis familiaris, Bos taurus), computed using the ECR browser. Exons: yellow, introns: orange and repeat elements: green. Peaks represent percentage of identity to the human sequence. At bottom, CAGE and nanoCAGE tag clusters from FANTOM4 and FANTOM5 datasets retrieved from the ZENBU genome browser, mapped to MAPT-AS1 promoter region, on sense (blue) or antisense strand (red). Values on the y-axis represent CAGE counts normalized per million tags (tpm).
Extended Data Figure 3
Extended Data Figure 3. Expression of MAPT and MAPT-AS1 across brain regions and inverse correlation to tau pathology; levels and localization of endogenous MAPT mRNA is unaffected by stable expression of MAPT-AS1, whereas tau protein is increased by MAPT-AS1 with a flipped-MIR
(a) RNA-Seq read counts from, for MAPT mRNA and MAPT-AS1 lncRNA transcripts (t-NAT2s, t-NAT1, t-NAT2l) across 12 different regions of four independent human brains. Values represent mean counts ± s.d. CBRL, Cerebellum; FCTX, frontal cortex; HIPP, hippocampus; HYPO, hypothalamus; MEDU, medulla; OCTX, occipital cortex; PUTM, putamen; SNIG, substantia nigra; SPCO, spinal cord; TCTX temporal cortex; THAL, thalamus; WHMT white matter. (b) single-molecule RNA fluorescent in situ hybridization (smRNA-FISH) showing MAPT-AS1 (green) and MAPT (grey) transcripts expressed both in nucleus (DAPI, blue) and cytoplasm of SH-SY5Y neuroblastoma cells. Representative images of n=3 independent experiments. Scale bars represent 10 μm. (c) 2ddensity scatter plot of MAPT-AS1 and MAPT expression (FPKM) from post-mortem brains (Allen Brain Institute) coloured by Braak-stage. Red lines delimit middle points. Inset numbers represent samples. (d) Braak-stage distributions within upper (Q2+3), lower (Q1+4), left (Q1+2) or right (Q3+4) hemi-plot as in (c) are significantly different (two-sided unpaired Wilcoxon Rank-Sum test). (e) Cumulative proportion (y-axis) of phospho-tau immunohistochemistry (AT8-IHC, fraction of labelled pixels in ROI), phospho-tau to total-tau ratio (p-Tau/Tau ratio) and Aß42 to Aß40 ratio (aß42/aß40 ratio) (x-axis) for different Braak-stages (0-1, 2-4, 5-6). (f) Cumulative proportion (y-axis) of MAPT, MAPT-AS1 and KANSL1-AS1 gene expression levels (normalised FPKM, x-axis) for different Braak-stages (0-1, 2-4, 5-6). For data in (e-f) *P<0.05, ***P<0.001 two-sided Kolmogorov-Smirnov (KS) test, n=377 human post-mortem brains. RNA-seq, IHC and Illuminex-immunoassay data in this analysis are from the Allen Brain Institute’s Dementia, Ageing and Traumatic Brain Injury study (http://aging.brain-map.org/). (g) Normalized MAPT and MAPT-AS1 RNA expression levels (fold-changes) detected by qRT-PCR from SH-SY5Y cells stably expressing different deletion mutants of MAPT-AS1: t-NAT1 with flipped overlapping region (Flip), t-NAT1 with region not-overlapping with 5’UTR (Nover), t-NAT1 with overlapping region (Over), tNAT1 with deleted 5’-exon (t-NAT1Δ5’), tNAT1 with deleted 3’-exon (t-NAT1Δ3’), t-NAT2l with deleted 5’-exon (t-NAT2Δ5’), t-NAT2l with deleted 3’-exon (t-NAT2Δ3’). Values are normalized to cells stably transfected with an empty vector (Empty). Data represent independent SH-SY5Y clones stably expressing each construct (n=3 for Empty, n=4 for Flip, Nover and Over, mean ± s.d.; two-sided Kruskal-Wallis with Dunn’s multiple comparison test). (h) Both full-length (FL) and mutants with deleted MIR element (ΔM) of MAPT-AS1 localise to both cytosol and nucleus without altering the nucleo-cytoplasmic distribution of MAPT mRNA as detected by qRT-PCR. (data represent independent SH-SY5Y clones stably expressing each construct: n=3 Empty, n=3 t-NAT1-FL, n=6 t-NAT1-ΔM, n=3 t-NAT2-FL, n=6 t-NAT2-ΔM, mean ± s.d.; two-sided Kruskal-Wallis with Dunn’s multiple comparison test). (i) Quantitative expression of human MAPT-AS1 and MAPT transcripts measured by qRT-PCR (2–ΔΔCt) in sub-cellular fractions of SH-SY5Y cells, (n=3 independent experiments, mean ± s.d.). (j) Quantification of immunoblots probed with anti-tau and anti-β-actin antibodies. Protein lysates (20μg) from independent clones of SH-SY5Y cells stably expressing different MAPT-AS1 splice-isoforms, either full-length (t-NAT1-FL, t-NAT2-FL), with deleted MIR (t-NAT1-ΔM, t-NAT2-ΔM) or with a flipped MIR repeat (t-NAT1-Mflip). For each construct, total tau was normalized to β-actin levels quantified using ImageJ (n=6 independent stable clones, mean ± s.d.; one-way ANOVA with Dunnett’s test). As with the whole deletion of MIR (t-NAT1-ΔM), flipped MIR (t-NAT1-Mflip, delimited by red lines) increases tau protein.
Extended Data Figure 4
Extended Data Figure 4. Characterization of human induced pluripotent stem cell-derived cortical and motor neurons
(a) Control-1 (male) human iPSCs (hiPSCs) differentiated into cortical neurons using dual SMAD inhibition followed by specification of both deep- and upper-layer cortical excitatory neurons. Neural rosettes at 20 days in vitro (DIV) express cortical progenitor markers PAX6 and OTX2, proliferation marker ki67 and neuronal marker TUJ1. By 100DIV, terminally differentiated neurons express βIII-tubulin, and later-born upper-layer neurons express SATB2 and BRN2. Scale bars=20μm, n=3 independent experiments. (b) Quantitative expression of MAPT and MAPT-AS1 (t-NAT1, t-NAT2s, t-NAT2l) in 3 independent inductions of hiPSC-derived cortical neurons (from 0 to 100DIV, one male healthy donor) measured by qRT-PCR (2–ΔΔCt/2–ΔΔCt max). (c) hiPSCs (control-1 and control-3), differentiated into motor neurons (MNs) using a previous established protocol, were immunostained for NPC and MN markers and imaged by the Opera-Phenix (PerkinElmer). Images were acquired and quantified using Columbus v2.8.0.138890. NPCs at 18DIV express OLIG2 and NKX6.1, whereas 25DIV MNs express SMI32 and choline acetyltransferase (ChAT), bar graphs on the right (mean ± sem, n=23 (NKX6.1), n=27 (OLIG2), n=29 (SMI32), n=22 (ChAT) imaged wells across 3 different lines, scale bars: 20μm). (d) ICC images of MNs (26DIV), immunolabeled with the TUJ1, total-tau and DAPI after transduction with lentivirus (MOI 10), expressing shRNAs targeting either the exon-4 of MAPT-AS1 (shEx4) or Renilla luciferase ORF as a negative control (shRen) (mean ± s.d. n=3 for control-1 and control-2 iPSC-MNs, scale bars: 40μm). Relative tau levels normalised to TUJ1 measured as ratio of integrated densities is compared between the two groups as reported in bar graph on right (unpaired two-tailed t test). (e) Western blot of MNs (26-28DIV) from two healthy controls, transduced with LV-shRen (n=5) or LV-shEx4 (n=6), probed with anti-total-tau and anti-GAPDH antibodies. Quantification is shown on the right (mean ± s.d. *p<0.05, two-sided Wilcoxon-test).
Extended Data Figure 5
Extended Data Figure 5. -MAPT-AS1 represses tau IRES-mediated translation in a MIR-dependent manner, with no effect on MAPT 3’-UTR and no major off-targets
a. Reported secondary structure of MAPT 5’UTR (-242 to -1 relative to AUG). Domains 1 and 2 and 5’-TOP motif of tau-IRES are indicated and a blue line denotes overlap with t-NAT1 (5’-exon position 88-163). b, Relative abundance of MAPT-AS1, MAPT and β-actin mRNAs in polysomal fractions from cells stably expressing FL or ΔM MAPT-AS1 isoforms (mean±s.d.). Absorbance profiles (254 nm) are in background. c, Relative abundance of MAPT mRNA in fraction pools corresponding to 40-60S, 80S, light, medium or heavy polysomes. FL but not ΔM t-NAT1 or t-NAT2 significantly reduced MAPT mRNA association with heavy polysomes (n=3 Empty, n=4 t-NAT1FL, n=6 t-NAT1ΔM, n=3 t-NAT2FL, n=5 t-NAT2ΔM in b-c) (mean±s.e.m., one-way ANOVA with Holm-Sidak’s test; two points outside of axes in c). d pRTF or pRF construct with pcDNA3.1 empty vector, t-NAT1 full-length (FL) or with deleted MIR (t-NAT1-ΔM) were co-transfected into SH-SY5Y cells and relative luciferase levels measured after 48 hours. Significant reduction of tau-IRES activity (Fluc/Rluc ratio) was detected in cells expressing t-NAT1-FL, but not t-NAT1-ΔM, resulting in significant increase in MAPT IRES-mediated cap-independent translation. Similarly, t-NAT2l-FL repressed MAPT IRES activity, whereas t-NAT2l-ΔM with deleted MIR, had no such effect. Data in d represent mean± s.d., n=3 independent experiments (**P<0.01, *P<0.05, one-way ANOVA with Dunnett’s test). e. Schematic representation of luciferase constructs (pMIR-reporter) to study MAPT-AS1 effects on MAPT 3’-UTR following co-transfection in SH-SY5Y cells. Either the full-length (FL) or 3 partially overlapping fragments (Fr1, Fr2, Fr3) of MAPT 3’-UTR were cloned downstream to the Firefly luciferase ORF. (f, upper) firefly luciferase (Fluc) normalized to Renilla luciferase (Rluc) was quantified in SH-SY5Y cells co-transfected with either an empty pcDNA3.1 vector or different variants of t-NAT1 lncRNA (n = 3 independent experiments). (f, lower) Fluc/Rluc ratio was quantified in SH-SY5Y cells co-transfected with either empty vector or different variants of t-NAT2l lncRNA (n = 3 independent experiments). In all cases differences were not statistically significant except for t-NAT1 -Δ3’ (one-way ANOVA with Dunnet’s test). (g) Representative genome-wide metaplot of ribosome density over protein-coding mRNAs; a large majority of reads align as expected with 5’UTR and CDS, with a minority at 3’UTRs. RIBO-seq libraries were from 3 independent SH-SY5Y clones stably expressing each MAPT-AS1 variant or an empty vector (n=17). (h) Bar plot of the relative number of RIBO-seq reads with 5’-end in each reading frame, showing periodicity of ribosome footprints (RFPs) (n=17). (i) RIBO-seq volcano plot showing differentially translated genes in SH-SY5Y cells stably expressing full-length t-NAT1 (FL) compared to those with empty vector (Empty). Vertical red line in correspondence of MAPT (Log2FC=-1.45, p=0.036, Wald test with Bonferroni correction) shows that few other genes are similarly depleted of RFPs, with only 6 (gene symbols in grey) having at least 170 counts in all 17 libraries (a sample was excluded due to barcode cross-contamination with an unrelated CLIP library on the same sequencing run), but none with an adjusted significant p-value. (j) QuantSeq volcano plot showing differentially expressed genes in SH-SY5Y cells stably expressing full-length t-NAT1 (FL) compared to cells with empty vector (Empty). MAPT (red) mRNA levels not significantly different. Only genes with at least 1,000 read counts across 18 samples are named by their symbol (grey), although their adjusted p-values were not significant. Only three genes show a significant downregulation at the mRNA level (in blue, adjusted p-value <0.05), likely representing transcriptional off-targets. P-values in i-j were computed by DESeq2 using the Wald test with Bonferroni multiple comparison correction.
Extended Data Figure 6
Extended Data Figure 6. Distribution of 7-mer MIR-complementary motifs along the human 18S rRNA secondary structure
Human 18S ribosomal RNA secondary structure as retrieved from (http://apollo.chemistry.gatech.edu/RibosomeGallery/) is divided into an “active region” (red) and an “inactive region” (grey). As described, active region is enriched for motifs able to mediate 40S ribosome recruitment through direct mRNA-rRNA interactions with 5’-UTRs of about 10% of human genes. Here, the 18S rRNA secondary structure is superimposed with 7-mers of complementary motifs (black dots) contained within each MIR embedded in MIR-NATs overlapping with 5’-UTRs of PC genes. Only 7-mers complementary to the 18S active region are shown. The 7-mer motifs represented here map to both the MIR elements within antisense MIR-NATs and the 5’-UTRs of the respective target genes, as reported in detail in Supplementary Table4. Matching positions of MIR motif-1 and -2 from MAPT-AS1 are reported (blue lines). 18S rRNA helices previously reported by Pisarev et al. to interact with mRNA regions upstream (yellow ovals) or downstream (salmon ovals) to the AUG start codon are indicated.
Extended Data Figure 7
Extended Data Figure 7. Brain RNA-seq co-expression analysis. Genes paired with antisense MIR-NATs have significantly more structured 5’- and 3’-UTRs
(a) Co-expression heatmaps representing distribution of RNA-seq read counts for 100 most abundant MIR-NAT target protein-coding genes (left panel) and 100 most abundant MIR-NAT genes (right panel), both hierarchically clustered based on their expression level in 12 different regions of 4 independent post-mortem brains from healthy human donors. Genes are clustered on y-axis. Brain regions on x-axis (CBRL, Cerebellum; FCTX, frontal cortex; HIPP, hippocampus; HYPO, hypothalamus; MEDU, medulla; OCTX, occipital cortex; PUTM, putamen; SNIG, substantia nigra; SPCO, spinal cord; TCTX temporal cortex; THAL, thalamus; WHMT, white matter). For each brain region, 4 independent brain samples are represented in each column. A colour key with histogram relative to each heatmap, have z-values associated to each color on the x-axis and RNA-seq counts on the y-axis. The histogram represents distribution of the RNA-seq counts for each z-value. (b) Similar co-expression heatmaps, as in (a), representing 1,045 MIR-NAT target protein-coding genes (on the left side) and 1,197 antisense MIR-NAT genes (on the right side). (c) Pie chart showing the percentage of MIR-NAT S-AS pairs annotated in GENCODE v19 and with 5’-UTR overlap, sorted by their Pearson’s correlation coefficient. The majority of S-AS pairs show positive correlations. (d) Histogram representing frequency of occurrence for 1,197 MIR-NAT S-AS pairs in bins of Pearson’s correlation (from -1 to + 1 in bins of 0.05). All MIR-NAT S-AS are visualized together, irrespective of their pattern of overlapping. MAPT-AS1-MAPT correlation coefficient is indicated. 3’-UTR (e) or 5’-UTR (f) minimum free energy (MFE), normalized by its length was computed using RNAfold 2.1.9 for each protein-coding gene in the human genome (hg19), and sorted based on their respective type of lncRNA overlap. Box plot presents median, upper and lower quartile boundaries for each group of protein-coding (PC) genes. PC genes pairing with MIR-NATs have both 3’-UTR and 5’-UTR significantly more structured than PC genes without lncRNA overlap (***, p < 0.0001 one-way ANOVA followed by Dunnett’s test). PC gene groups are as follows: PC genes overlapping antisense with MIR-NAT, ‘PC-MIRlncRNA’; PC genes overlapping with any lncRNA without embedded MIR repeat, ‘PC-lncRNA-NOMIR’; all PC genes with any overlapping lncRNA, ‘PC-lncRNA’; MIR-NATs, ‘MIRlncRNA’; PC genes without lncRNA overlap, ‘PC-NO-lncRNA’.
Extended Data Figure 8
Extended Data Figure 8. MIR-NATs S-AS pairs within networks of interacting proteins, enriched for NDD-genes.
a, MIRs are more frequent in lncRNAs than mRNAs (5’UTR, 3’UTR, CDS). b, 1,197 GENCODE v19 MIR-NATs form S-AS pairs with 1,045 protein-coding (PC) genes: 40.69% overlap 5’UTR, 32.50% overlap CDS and 26.81% overlap 3’UTR. c, PC-genes with 5’UTR-overlapping MIR-NATs (n=630) are more expressed in human brain (log10FPKM) compared to genes with 3’UTR (n=392) or CDS (n=474) overlaps. Box plot: median with upper and lower quartiles; whiskers, values outside of interquartile range; points represent outliers (Welch two-sample t-test; one-way ANOVA across all gene-regions p=0.0214). d, Enriched cellular components and disease GO-terms ranked by Enrichr. 5’UTR-overlapping genes significantly associate with dementia (one-sided Fisher’s exact test p-values combined with z-scores, Supplementary Table 2b). e, MIR-NATs cognate PC-genes sorted by their overlap (3’UTR, 5’UTR, CDS) form networks of interacting proteins (coloured seeds), computed using PINOT, and are associated with neurodegenerative diseases, enriched within 5’UTR network (p=1.5x10⁻⁴, 100,000 random simulations pnorm) f, PLCG1 and PLCG1-AS genes. g, Immunoblot quantification of SH-SY5Y cells stably expressing empty vector (Empty), full-length (FL) or MIR deleted (ΔM)-PLCG1-AS. PLCG1 is reduced in cells expressing FL but not ΔM-PLCG1-AS (n=6 clones stably expressing each construct, mean ± s.d., one-way ANOVA with Dunnett’s test).
Extended Data Figure 9
Extended Data Figure 9. Majority of genes targeted by antisense MIR-NATs interact in a PPI network and are enriched for neurodegenerative disease-associated and immune system-associated genes
(a) Protein-protein interaction (PPI)-network obtained from literature-curated interaction data from InnateDB database, using 392 seed proteins participating in S-AS pairs with MIR-NATs. Genes coding proteins associated with neurodegenerative diseases, represented as red-filled circles, are significantly enriched in network (p=1.63x10⁻⁸, Benjamini-Hochberg FDR using WebGestalt). Only primary interactions are represented in a zerodegree interaction network generated with NetworkAnalyst tool. Self-interactions are not considered. (b) Schematic structures of representative genes pairing with antisense MIR-NATs and involved in different neurodegenerative diseases. GENCODE v19 annotated isoforms of the human SNCA, APP, MBNL1 and SLC1A2 genes and respective overlapping antisense MIR-NAT. MIR elements within each lncRNA are indicated (red). (c) Protein-protein interaction (PPI)-network obtained from literature-curated interaction data from InnateDB database, using 392 seed proteins participating in S-AS pairs with MIR-NATs. Genes encoding proteins associated with either the immune system (green) or innate immune system (blue), are significantly enriched into the network (respectively p=0.0041, p=0.0328, Benjamini-Hochberg FDR using NetworkAnalyst). Only primary interactions are represented in a zero-degree network generated using NetworkAnalyst tool. Self-interactions are not considered. (d) Gene expression heatmap for 487 protein-coding genes with 5’-UTR overlapping with antisense MIR-NATs in 126 normal human tissues, from 557 publicly available microarray datasets, retrieved from the Enrichment Profiler Database (http://xavierlab2.mgh.harvard.edu/EnrichmentProfiler/index.html). Genes are clustered on y-axis and tissues are clustered on x-axis. Scale bar at bottom indicates colours associated to each z-score in the expression heatmap. (e) Scheme of the PLCG1 and PLCG1-AS genes is reported (hg19); the inverted MIRb is in red. Immunoblots of 6 independent SH-SY5Y clones stably expressing either empty vector (Empty), PLCG1-AS full-length (FL) or with whole inverted MIRb deleted (ΔM), probed with anti-PLCG1 and β-actin antibodies. (f) PLCG1 protein level is reduced in cells expressing FL- but not ΔM-PLCG1-AS as quantified in the graph (n=6 independent stable SH-SY5Y clones for each construct, mean± s.d., *p<0.05; one-way ANOVA with Dunnett’s test). (g) PLCG1 mRNA expression level from bulk RNA-seq of temporal cortex (TC) and prefrontal cortex (PFC) from the Mayo Clinic (n=160) and ROS-MAP (n=632) datasets respectively, is significantly increased in AD patients (AD) compared to asymptomatic AD (AsymAD) and healthy controls (Control), (box-plots: midpoints, medians; boxes, 25th and 75th percentiles; whiskers, minima and maxima; two-sided Wilcoxon-test) (data from http://swaruplab.bio.uci.edu:3838/bulkRNA/). Control samples were classified as Braak stage 0-I. Early-stage pathology samples were defined as Braak stage II-IV and CERAD score of possible AD, while late-stage pathology samples were Braak stage V-VI and CERAD score of probable and definite AD.
Extended Data Figure 10
Extended Data Figure 10. 446 genes targeted by MIR-NATs contribute to the transcriptional signature of Alzheimer’s disease
a, meta-analysis of snRNA-seq from Mathys (M), Grubman (G) and bulk RNA-seq from Friedman (GSE95587) datasets: rows are 446 MIR-NAT differentially expressed genes (DEG): 38 NDD-genes and 69 lncRNAs. DEGs across datasets partially overlap with 65 (27.7% up, 72.3% down) within Mathys, 160 (48.1% up, 51.9% down) within Grubman and 307 (58% up, 42% down) within Friedman datasets. Cell types: excitatory neurons (Ex), inhibitory neurons (In), neurons (Neu), astrocytes (Ast), oligodendrocytes (Olig), oligodendrocyte precursors (OPC), microglia (Mic), hybrid cells (Hyb), endothelial (Endo), unidentified cells (Unid). DEG counts are log2(mean gene expression in AD-pathology/mean gene expression in no-pathology) > 0.25 (two-sided Wilcoxon rank-sum test FDR<0.01 and Poisson mixed-model FDR<0.05, Mathys; two-sided Wilcoxon rank-sum test, FDR<0.05, Grubman and GSE95587). Annotations: gene-type (biotype), NDD-genes in DisGeNET database (disease), MIR orientation (MIR), S-AS region (overlap), percentage of protein IDRs by 75% of D2P2 predictors (disorder), number of protein-protein interactors (degree).
Extended Data Figure 11
Extended Data Figure 11. Majority of genes targeted by MIR-NATs are enriched for interacting intrinsically disordered proteins (IDPs)
(a) Extended protein-protein interaction (PPI)-network from experimentally validated interaction data from various databases mined by PINOT, using 760 nonredundant seed proteins participating in S-AS pairs with MIR-NATs. 399 seeds (40.3%) are genes encoding for IDPs with more than 90% IDRs, represented as red-filled circles, are significantly enriched into the network (p=0.0096, 100,000 random simulations in R, Bonferroni, details in Supplementary Table3). Only first-degree interactions are represented. Percentage of sequence predicted to span intrinsically disordered regions (IDRs) by at least 75% of the 9 algorithms from the D2P2 database is colour coded from blue (0-30%) to red (>90%) (b), 11 NDD-hub proteins in the above network are presented in this zoom-in view: (APP, ATP13A2, DCTN1, GABARAPL1, HSP90AA1, MAPT, MATR3, PLCG1, SNCA, SRRM2, VIM) (c), Topological properties of extended PPI network, computed by Cytoscape.
Fig. 1
Fig. 1. MAPT-AS1 is brain-enriched, expressed during neuronal differentiation and inversely correlated to tau pathology.
a, MAPT-AS1 and MAPT genes (hg19). Grey arrows indicate inverted H1/H2 haplotypes, with haplotype-tagging SNPs (blue); PD-linked rs12185268; PSP and PD-associated rs8070723 SNPs in MAPT 5’UTR (black) and MAPT-AS1 (red). MAPT coding-exons are in black; UTRs in white; MAPT-AS1 exons in grey; MIR in red, AS exonic-overlap in blue. b, Sashimi-plot of brain RNA-seq (log10RPKM) with splice-junctions counts. c, MAPT and MAPT-AS1 relative expression by qRT-PCR (2–ΔΔCt/2–ΔΔCt max) in human tissues and (d) during iPSC differentiation into cortical neurons (0-80 days), scale bar =40 μm, n=3 independent experiments e, Linear regression: mean MAPT-AS1 expression from brain RNA-seq (red line) inversely correlates with mean tau pathology (blue line; phospho-tau(AT8):total-tau, Luminex-immunoassay) and Braak-stage in Allen (left) and ROS-MAP (right) cohorts, error bars:95%CI, R:Pearson’s correlation coefficient, (two-sided p-value, t-distribution with n-2 def).
Fig. 2
Fig. 2. Loss of MAPT-AS1 increases neuronal tau.
a-b, Silencing MAPT-AS1 in SH-SY5Y cells with siRNAs (si-NAT1, si-NAT2, siEx4) unaffected MAPT expression by qRT-PCR but increased endogenous tau compared to scramble mean (n=6 independent treatments, mean±s.d., two-sided Kruskal-Wallis with Dunn’s test). c, (left) Representative immunostainings of MNs transduced at four multiplicities of infection (MOI) with negative control LV-shRen or MAPT-AS1-specific shNT1, shEx4. Nuclei labelled by SYTOX (green), total-Tau (red) normalised to wheat germ agglutinin (WGA), scale bar=40 μm. (right) ICC quantification (n=10±1 wells across 3 experiments, n=23 wells for shRen-250MOI, box-plots: midpoints, medians; boxes, 25th and 75th percentiles; whiskers, minima and maxima; two-sided Kruskal-Wallis with Dunn’s test). d, Immunoblots of MNs from two healthy donors (MN-ctrl1, MN-ctrl2) transduced with LV-shEx4 or LV-shRen, total-tau normalised to GAPDH (n=5 shRen, n=6 shEx4, independent transductions, mean±s.d. two-sided unpaired Wilcoxon-test).
Fig. 3
Fig. 3. MAPT-AS1 controls tau translation through embedded inverted MIR.
Stable expression in SH-SY5Y cells a, MAPT-AS1 and MAPT expression by qRT-PCR (2–ΔΔCt); Empty vector (Empty), full-length or mutant t-NAT1 (t-NAT1FL; t-NAT1ΔM), or t-NAT2l (t-NAT2FL; t-NAT2ΔM), MIR deletion (ΔM) (mean±s.e.m., n=6, 3 clones in 2 experiments, one-way ANOVA with Dunnett’s test), t-NAT1 (b) and t-NAT2 (c) with: full-length (FL), 5’-deletion (Δ5’); 3’-deletion (Δ3’); regions not-overlapping (Nover) or overlapping (over) with MAPT 5’UTR; flipped overlapping region (flip); partial (ΔM1) or full MIR deletion (ΔM). AS-region overlapping MAPT 5’UTR in blue; chevrons indicate orientation. t-NAT1-FL (b), t-NAT2-FL (c) reduce endogenous total- and dephosphorylated-tau (λ-phosphatase), suggesting regulation is independent of tau phosphorylation. Inverted MIR (red) is essential for controlling tau levels. Numbers above total-tau and below dephosphorylated-tau indicate levels normalised to β-actin, TDP-43 and SPPL2C geometric mean. d, Pairwise comparison heatmap of RIBO-seq ribosome footprints (RFPs) along MAPT from 3 independent SH-SY5Y clones expressing Empty-vector, t-NAT1 (FL), deletion of MIR motif-1 (MutΔ1) or motif-2 (MutΔ2) as in Fig.4a, MIR deletion (ΔM), MIR flipped (Mflip). FL significantly decreases MAPT RFPs compared to Empty (log2FC=-1.45, p=0.036, Wald test with Bonferroni correction). e, pTF reporters: a 1,342 nt genomic fragment spanning MAPT promoter, 5’UTR (grey box) and intron segment, upstream to firefly luciferase (Fluc) ORF. Haplotypes H1B and H2, (7 SNPs), were tested. f, FL t-NAT1 and t-NAT2 transient expression significantly repress Fluc translation normalised to Renilla luciferase (mean±s.e.m., one-way ANOVA with Dunnett’s test, n=3 SK-N-F1, n=6 SH-SY5Y independent experiments). g, Bicistronic reporters: MAPT 5’ UTR inserted between Renilla (Rluc) and Fluc ORFs in pRF vector, resulted in pRTF. Truncations (pRTFΔ and pRTFover) or 5’TOP motif mutation (pRTFmTOP) reduced tau-IRES activity. Hepatitis C virus IRES (pRhcvF), positive control. h, SH-SY5Y cells stably expressing empty vector (Empty), t-NAT1 or t-NAT2, were transfected with constructs in (g) and capindependent translation (Fluc/Rluc ratio) measured. Control cells (Empty) transfected with pRTF showed a ~15- fold increase in Fluc/Rluc ratio over negative control pRF vector, and a ~3.7-fold increase over pRhcvF; FL t-NAT1 or t-NAT2 expression significantly reduced tau-IRES activity. (n=3 SH-SY5Y clones in 2 independent experiments, mean±s.e.m., two-sided Kruskal-Wallis with Dunn’s test).
Fig. 4
Fig. 4. Two essential MIR motifs for MAPT-AS1-mediated tau repression.
a, motif-1 and 2, (black) are identical or complementary to MAPT 5’UTR (blue) and 18S rRNA (green). Motif-3 is complementary to 5’UTR. b, FL-t-NAT1 stable expression significantly reduces total-tau in SH-SY5Y cells, compared to Empty. t-NAT1 motif-1 (Δ1) or -2 (Δ2) deletion unaffected tau. Deletion of motif-3 (Δ3) preserved t-NAT1-mediated repression. miniNAT composed of 32-nt AS-region (blue) complementary to MAPT 5’UTR, fused with inverted MIR (red) represses tau. (mean±s.d., n=6, 3 clones in 2 experiments; two-sided Kruskal-Wallis with Dunn’s test) c, in vitro transcribed t-NAT-FL and miniNAT repress dose-dependently in vitro translation of pTF luciferase compared to mutant ΔM (regression lines, mean with 95% CI, n=3 independent experiments; two-sided ANCOVA test; df=2, F=12.886, p=7.85x10–05ANOVA for slope; df=3, F=32.127, p=8.97x10⁻¹⁰ANOVA for t-NAT) d, MAPT mRNA with 5’UTR experimentally determined structure. Tau-IRES recruits ribosomes (salmon ovals) by pairing with rRNA at two sites (motif-1, motif-2, turquoise). Complementary nucleotides 59-65 and 19-25 (black dots) form a kissing-hairpin, crucial for tau-IRES. The PD-associated SNP rs62056779 (OR=0.774, p=6.055x10–36) is within motif-1 e MAPT-AS1 inhibits IRES- and cap-dependent tau translation through both 5’AS-region complementary to domain 2 (red line) and the inverted MIR (green line), containing motif-1 and -2 (turquoise). Motif-3 (orange) is dispensable.
Fig. 5
Fig. 5. MAPT-AS1 represses tau translation in vivo in a MIR-dependent manner.
a, AAV9 expressing eGFP or MAPT-AS1 (FL, ΔM, miniNAT), for unilateral hippocampal transduction of htau+/- Mapt-/- mice (9-11 mo). b, Coronal section of AAV9-eGFP transduced htau mouse (n=4), showing robust ipsilateral (R) and limited contralateral (L) labelling; scale bar=900μm. Representative immunoblots of ipsilateral (c) and contralateral (f) brain hemispheres injected with PBS or AAV9-MAPT-AS1 (FL, ΔM, miniNAT), immunolabeled for total-tau (DAKO), pSer202-tau (CP13) and eGFP. AAV9-MAPT-AS1 and MAPT quantitative expression (relative to PBS) from transduced ipsilateral (d) and contralateral (g) hemispheres. Quantification (normalised to eGFP) of total-tau and p-tau from ipsilateral (e) and contralateral (h) hemispheres. Dashed lines delimit minima-maxima in PBS-injected mice (tau), or across all samples (MAPT); means, grey bars. (mean±s.d., n=4 PBS, n=6 ΔM, n=6 FL, n=7 miniNAT in c-d-e, n=5 PBS, n=6 ΔM, n=6 FL, n=7 miniNAT in f-g-h; two-sided Kruskal-Wallis with Dunn’s test, experiments repeated 3 times).

References

    1. Pelechano V, Steinmetz LM. Gene regulation by antisense transcription. Nat Rev Genet. 2013;14:880–893. - PubMed
    1. Statello L, Guo C-J, Chen L-L, Huarte M. Gene regulation by long non-coding RNAs and its biological functions. Nat Rev Mol Cell Biol. 2021;22:96–118. - PMC - PubMed
    1. Veo BL, Krushel LA. Secondary RNA structure and nucleotide specificity contribute to internal initiation mediated by the human tau 5’ leader. RNA Biol. 2012;9:1344–1360. - PMC - PubMed
    1. Spillantini MG, Goedert M. Tau pathology and neurodegeneration. Lancet Neurol. 2013;12:609–622. - PubMed
    1. Pittman AM, et al. Linkage disequilibrium fine mapping and haplotype association analysis of the tau gene in progressive supranuclear palsy and corticobasal degeneration. J Med Genet. 2005;42:837–846. - PMC - PubMed

Publication types

MeSH terms