. 2021 Jun;594(7861):82-87.
doi: 10.1038/s41586-021-03561-9. Epub 2021 May 19.

Cortex-dependent corrections as the tongue reaches for and misses targets

Affiliations

Cortex-dependent corrections as the tongue reaches for and misses targets

Tejapratap Bollu et al. Nature. 2021 Jun.

Abstract

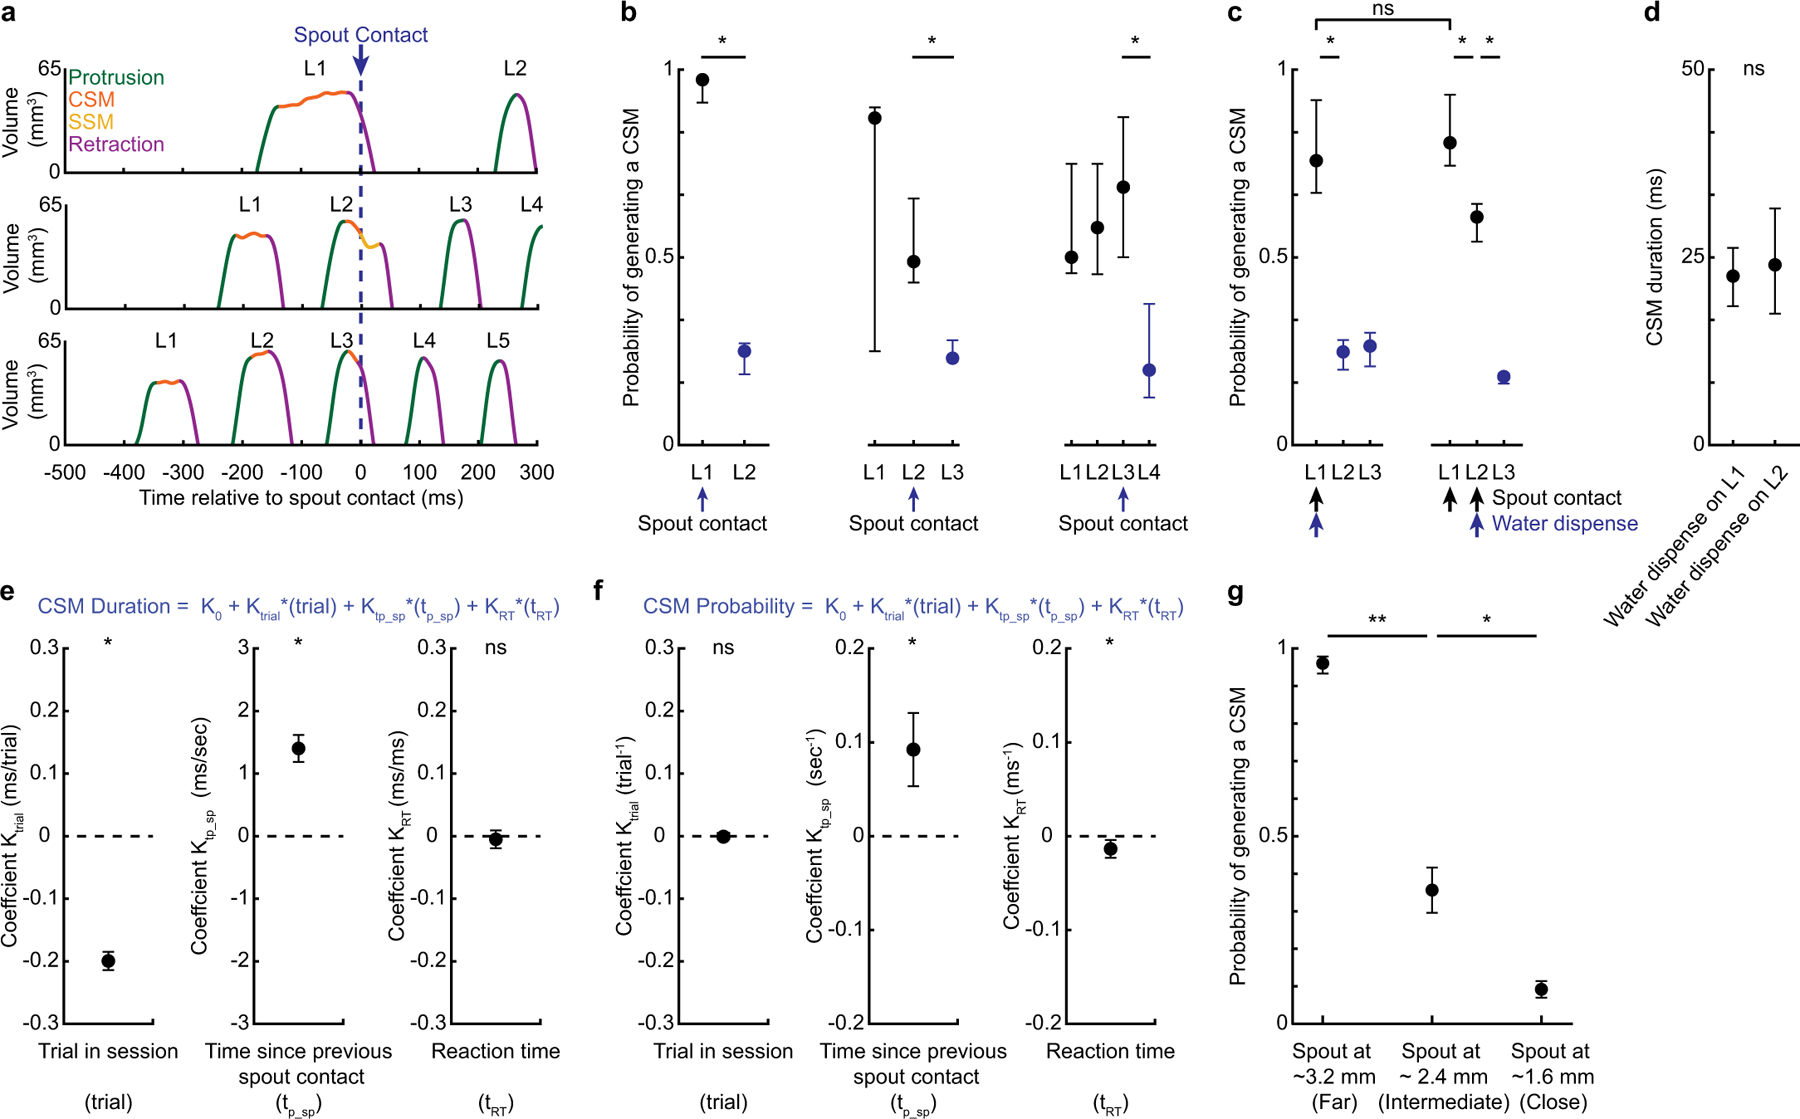
Precise tongue control is necessary for drinking, eating and vocalizing1-3. However, because tongue movements are fast and difficult to resolve, neural control of lingual kinematics remains poorly understood. Here we combine kilohertz-frame-rate imaging and a deep-learning-based neural network to resolve 3D tongue kinematics in mice drinking from a water spout. Successful licks required corrective submovements that-similar to online corrections during primate reaches4-11-occurred after the tongue missed unseen, distant or displaced targets. Photoinhibition of anterolateral motor cortex impaired corrections, which resulted in hypometric licks that missed the spout. Neural activity in anterolateral motor cortex reflected upcoming, ongoing and past corrective submovements, as well as errors in predicted spout contact. Although less than a tenth of a second in duration, a single mouse lick exhibits the hallmarks of online motor control associated with a primate reach, including cortex-dependent corrections after misses.


Conflict of interest statement

Competing interests The authors declare no competing interests.

Figures

Extended Data Fig. 1 |
Extended Data Fig. 1 |. Method for extracting 3D tongue tip kinematics.
a, Architecture of the artificial neural network (U-NET) used to segment the tongue from the background image. U-NET has characteristic symmetrical contraction and expansion paths that simultaneously capture localization and image context. Each box corresponds to a multi-channel feature map and numbers above each layer indicate the number of channels; colour-coded arrows indicate sequential processing steps. b, Pipeline for tongue segmentation. Left to right, top, side view of the tongue as the input image to U-NET, the identified tongue mask and the mask plus the input image. Bottom, process is repeated separately for the bottom view of the tongue. c, An example of the process used to generate a 3D voxel hull from the two views of the mouse tongue. The walls of the diagrams are stills taken from the high-speed video, with the segmented tongue mask highlighted in red. The final hull (rightmost diagram) is obtained by intersecting the projections of the side- and bottom-view tongue masks. d, A 2D illustration of the tip coordinate search. With the voxels (grey circle) and centroid (black circle) identified, the first search step is performed, in which candidate voxels (blue) are found via the intersection of voxels satisfying the two search criteria (yellow)—namely, thresholds on the maximum angle made with an initial search vector (blue arrow) and the minimum distance from the tongue centroid. These first candidate voxels are then used to generate a refined search vector (red arrow, second row) for the second step of the search. Using this refined search vector, a similar set of angle and distance thresholds are applied to determine a refined set of candidate voxels, which are then averaged to determine the tip location. e, Example of the tip search process with real data in 3D. The grey object is the 3D tongue hull, with the centroid labelled by a black circle. The first search step identifies a set of candidate voxels (blue) that are used to generate a refined search vector for the second search step (red). Using the second-step candidate voxels, the tongue tip location is estimated (green ‘x’). f, Average power spectral density plot of tongue tip trajectories from five representative mice. More than 90% of power was at frequencies less than 50 Hz. g, Two time-points of a single lick (left and right) are shown with tongue tip estimated with key points (red) and with volume reconstruction (blue). Though key-point tracking appears to work well from the side view, it fails in the bottom view as the true tongue tip does not always lie at the edge of the image of the tongue as seen from the bottom. This is because in most licks the tongue exhibits a ‘c’ shape at full extension. In these frames the tip is mislabelled by key points in the bottom view. Importantly, the error cannot be accounted for systematically because it varies dynamically within a lick according to the convexity of the tongue.
Extended Data Fig. 2 |
Extended Data Fig. 2 |. Water retrieval and cue-evoked licks exhibit distinct kinematics.
ac, Water-retrieval licks, defined as those initiated after spout contact. a, Six overlaid tongue tip trajectories during retrieval licks. A single lick is bold for clarity. b, Protrusion, CSM, SSM and retraction phases of the trajectories from a are separately plotted. The ‘x’ symbols denote the absence of CSMs and/or SSMs. c, Three-dimensional trajectory of the highlighted lick shown in a, with protrusion (green) and retraction (purple) lick phases indicated. df, Data plotted as in ac for cue-evoked licks. Note the prominent CSMs. g, Tongue tip speed profiles for retrieval (blue) and cue-evoked (black) trajectories shown in a, d. hk, Probability of CSMs (h) and durations (i), peak speeds ( j) and path lengths (k) of distinct lick phases during cue-evoked (black) and retrieval (blue) licks. l, m, Kinematics (l) and entropy (m) of lick durations, path lengths, peak speeds and number of acceleration peaks. Data are median ± IQR. *P < 0.05, **P < 0.01, ***P < 0.001, two-sided paired Wilcoxon signed rank test; all data from sessions with spout at 3.2 mm. n = 17 mice. Exact statistics are in Supplementary Table 1.
Extended Data Fig. 3 |
Extended Data Fig. 3 |. Individual mice exhibit stereotyped tongue tip positions at retraction onset and spout contact.
a, Side and bottom views of the tongue at the moment of retraction onset from a representative lick. b, Scatter plots of tongue tip positions at retraction onset for side (top) and bottom (bottom) views during successful cue-evoked licks from a single session. Probability distributions are projected along the axes at top and right (bin size, 120 μm). Right, 2D standard deviations of tongue tip positions at retraction onset for nine representative mice (each mouse independently colour-coded). Each mouse exhibits a ‘preferred’ target location for retraction onset. Similarly, tongue CSMs terminated at precisely clustered tongue tip positions beneath the spout in a way that was unique for each mouse. c, Tongue tip positions at moment of retraction onset plotted as in b for retrieval licks. df, Data plotted as in ac for tongue tip positions at the moment of spout contact, for the same nine mice. g, Probability of spout contact as a function of the distinct lick phases for cue-evoked and water-retrieval licks (blue and black, respectively, median ± IQR, n = 17 mice). h, i, The number of acceleration peaks per lick predicts latency to spout contact. h, The latency to spout contact relative to protrusion onset is plotted against the number of acceleration peaks per lick from a single spout-far session. Red line, linear fit. i, Box plot showing r2 for linear fits across 17 mice (red line, median; box edges, IQR; whiskers, 95% confidence interval).
Extended Data Fig. 4 |
Extended Data Fig. 4 |. Tongue protrusions remain aimed during ALM inactivation.
a, Left, Five example tongue protrusions (from bottom view) from a single session with the spout placed to the left (blue, ALM inactivated; black, ALM intact). Green ellipse denotes 95% confidence interval of the tongue tip location at the moment of retraction onset. Centre, scatter plot of tongue tip positions at tongue protrusion offsets. Probability distributions of ALM intact (black) and inactivated (blue) dots are projected along the axes at top and right (bin size, 120 μm). Green line, midline. b, c, Data plotted in a for sessions with centred (b) and right (c) spout placements. d, Left, the lateral placement of the tongue tip at the moment of protrusion offset is plotted across left, straight and right sessions (black, laser off; blue, ALM inactivated). Right, the average difference in lateral displacement between ALM-intact and ALM-inactivated trials. Data in d are median ± IQR across n = 13, 15 and 12 mice for spout left, centre and right, respectively; *P < 0.05 for a one sample two-sided Wilcoxon signed rank test. Exact statistics are in Supplementary Table 2.
Extended Data Fig. 5 |
Extended Data Fig. 5 |. CSMs are directionally biased towards remembered spout locations.
ae, CSM kinematics for spout-left sessions. a, Time-dependent velocity vector for the protrusion (green) and CSM (orange) phase of a single cue-evoked lick. The origin of each vector is the tongue tip position at 5-ms intervals of the lick, the amplitude is the speed and the arrow points in the direction of motion. Inset, polar plot with direction distribution of all CSMs produced in a single spout-left session. Dashed circle, the null distribution of unbiased CSM directions. b, Scatter plot of CSM directions plotted against protrusion directions for all cue-evoked licks in the session. c, Position-dependent average velocity vectors for all cue-evoked licks from a single session, colour-coded by highest likelihood lick phase to pass through the binned space (250-μm grid). Grey shading intensity of each bin is proportional to the probability of a tongue tip trajectory passing through the space. d, Scatter plot of tongue tip positions at protrusion offset (green) and retraction onset (orange), indicating CSM start and end points, respectively. Probability distributions of the CSM start and end points are projected along the axes at top and right, respectively (bin size, 120 μm). e, Example of a single CSM path and its speed profile (orange). The initial direction of the CSM (VCSM, black dotted line) was computed from the vector connecting the CSM starting point to its position at the first speed minimum (upward black triangle in speed and path plots). The dot products between this CSM direction vector and three additional vectors from CSM starting point to left, centre and right targets (dotted red, green, and blue lines, respectively) were computed to quantify the ‘direction bias’, the extent to which the initial direction of a given CSM was aimed at each of the three candidate targets (targets defined independently for each mouse and each session as its median tongue tip position at moment of retraction onset (Extended Data Fig. 3, Methods)). f, Left, cumulative distributions of directional biases for all CSMs produced in a single session to the three candidate targets (coloured as in b). CSMs were reliably aimed to the left target. Right, directional biases of CSMs to left, centre and right targets in spout-left sessions(n = 13 mice). gl, CSM kinematics for spout-centre sessions, plotted as in af (n = 17 mice). mr, CSM kinematics for spout-right sessions, plotted as in af (n = 12 mice). Data in f, l and r are median ± IQR.* P < 0.05, **P <0.01, two-sided Wilcoxon ranked-sum test. No corrections for multiple comparisons were made. Exact statistics are in Supplementary Table 3.
Extended Data Fig. 6 |
Extended Data Fig. 6 |. Uncertainty in spout position is associated with the need for corrections.
ad, The first spout contact transforms the kinematics of subsequent licks in a bout. a, Tongue volumes as a function of time during three trials in which first spout contact (black dashed line) occurred on the first, second or third lick. Licks initiated before spout contact exhibited substantial CSMs, whereas those initiated after spout contact did not. b, CSM probability as a function of lick number in cases in which first spout contact happened on first, second or third licks (n = 17 mice). Spout contact reliably transformed the kinematics of subsequently initiated licks. Data in b from sessions in which water was dispensed on first spout contact. c, d, CSMs when water was dispensed on the second spout contact (n = 12 mice). c, In sessions in which water was dispensed on second contact, both spout contact on L1 and water dispensed on L2 contact reduced CSMs on ensuing licks. d, CSM duration on first cue-evoked licks (L1) did not depend on water dispensation on first contact. e, f, Mixed-effects models were used to predict the duration (e) and probability (f) of CSMs on first licks of a bout (Methods). CSM durations were significantly predicted by trial number in session and time since previous spout contact (tp_sp), but not reaction time (tRT). CSM probabilities were predicted by tp_sp and by tRT (n = 8 mice, 1,507 trials). g, CSM probability scales with spout distance. n = 17, 11 and 13 mice for spout at 3.2, 2.4 and 1.6 mm, respectively. Data in bd, g are median ± IQR. *P < 0.05, **P < 0.01, two-sided Wilcoxon rank-sum test. Data in e, f are mean ± s.e.m. of the model estimates of the coefficients; **P < 0.01, ***P < 0.001, two-sided t-test. No corrections for multiple comparisons were made. Exact statistics are in Supplementary Tables 4–6.
Extended Data Fig. 7 |
Extended Data Fig. 7 |. Electrophysiological validation of photoinhibition in Vgat-ChR2-EYFP mice.
a, Voltage waveforms of putative pyramidal neuron (top) and interneuron (bottom) during one second illumination of 40-Hz sinusoidal wave at 10 mW, the same power and waveform generated in behavioural experiments. b, Spike rasters and corresponding rate histograms of the neurons from a. c, The z-scored firing rates of 71 ALM neurons before, during and after optogenetic activation of inhibitory interneurons in Vgat-ChR2-EYFP mice (n = 2 sessions, n = 2 mice) (Methods).
Extended Data Fig. 8 |
Extended Data Fig. 8 |. Effects of ALM and PMM inactivation on lick kinematics.
ac, Inactivation of PMM does not affect task performance or lick kinematics. a, Cumulative probability of tongue–spout contact relative to cue onset during laser-off and PMM-photoinactivated trials. Right, probability of spout contact within a trial across mice (n = 9 mice). b, Data plotted as in a for tongue protrusions. c, Median durations, path lengths and peak speeds for lick phases with PMM intact (black) and PMM inactivated (blue), d, Effect of ALM photoinhibition on the duration, path length speed and number of acceleration peaks in cue-evoked licks. e, ALM photoinhibition reduced the variability of L1 kinematics. Data in d, e (n = 12 mice) are from trials in which L1 protrusions existed during control (black) and ALM-inactivated (blue) trials with a minimum of 10 data points for each lick phase. fh, Effect of ALM photoinhibition on water-retrieval licks. ALM photoinhibition reduced the probabilities of spout contact (f) and CSM generation (g) (blue) (control trials in black). h, Median duration, path lengths and peak speeds of retrieval lick phases produced with ALM intact and inactivated. Data (n = 12 mice) of the first retrieval lick that followed cue-evoked licks that made contact during ALM photoinhibition. ik, Proximal spout placement rescues ALM-inactivation-associated spout contact deficits. Cumulative probability of spout contact relative to cue onset for control (black) and ALM-inactivated (blue) trials in sessions in which the spout was 1.6 mm (i) and 3.2 mm (j) from the incisors. k, Median probability of spout contact across mice from spout-close and spout-far sessions (n = 13 mice). Data in ah, k are median ± IQR. *P < 0.05, **P < 0.01, ***P < 0.001, two-sided paired Wilcoxon signed-rank test. Exact statistics are in Supplementary Tables 7–10.
Extended Data Fig. 9 |
Extended Data Fig. 9 |. Online corrections on L3 of double-step trials have neural correlates in ALM.
a, Tongue volumes, spike rasters and corresponding rate and double-step-selectivity histograms for two example ALM neurons (example neuron 1 (a) and example neuron 2 (f)). Neural activity aligned to L3 protrusion onset. Raster colour codes are as in Fig. 4. Bottom (k), ALM population double-step selectivity, defined as the normalized difference in firing rate from control and double-step trials (Methods). Only neurons with significant trial selectivity are shown (n = 234 out of 465 neurons). be, gj, lo, Data plotted as in a for the following conditions: premature bout termination following L3 (n = 147 out of 438 neurons) (b, g, l), L3 spout misses resulting in bout continuation (n = 85 out of 418 neurons) (c, h, m), CSMs on L3 misses (n = 10 out of 79 neurons) (d, i, n), and spout location on L3 contacts (n = 18 out of 167 neurons) (e, j, o). Histograms are bootstrapped mean ± s.e.m.
Extended Data Fig. 10 |
Extended Data Fig. 10 |. Centroid-based tracking confirms the presence of CSMs on cue-evoked licks and their reduction during retrieval licks and ALM inactivation.
ac, The speed of the tongue centroid (Extended Data Fig. 1) plotted above the absolute values of rate of tongue volume change for an example cue-evoked lick with ALM intact (a), with ALM inactivated (b) and a retrieval lick (c). dg, Data plotted as in Fig. 2m–p for the same mice and sessions but with lick phase kinematics computed from centroid-based tongue tracking, in which the first and last minima in centroid speeds defined protrusion offset and retraction onset. Data are median ± IQR, n = 12 mice, *P < 0.05, **P < 0.01, ***P < 0.001, two-sided paired Wilcoxon signed-rank test. No corrections for multiple comparisons were made. Exact statistics are in Supplementary Table 16.
Fig. 1 |
Fig. 1 |. CSMs within licks are important for spout contact.
a, Left, the tongue was filmed at 1-kHz frame rate from the side and bottom views. Right, spout contacts from a single trial above a spout contact raster from 400 trials in a session. b, Left, distributions of inter-spout contact intervals (top) and inter-lick protrusion intervals (bottom) for a single mouse. Right, median ± interquartile range (IQR) values across 17 mice. c, Example frames from side and bottom views across a single lick cycle. Each row shows the raw image above the image overlaid with the U-NET-labelled tongue mask. Scale bars, 2 mm. d, Tongue tip positions, computed from a 3D tongue model (Extended Data Fig. 1), were estimated in each frame (left), resulting in millisecond-timescale tracking of the tongue tip in two planes (right). AP, anterior–posterior; DV, dorsal–ventral; ML, medial–lateral. Scale bar, 1 mm; intervals between two blue circles, 1 ms. e, Three-dimensional trajectories (in mm) of a cue-evoked (left) and a water-retrieval (right) lick. Protrusion, CSM, spout submovement (SSM) and retraction phases of the lick are labelled in green, orange, yellow and purple, respectively; black crosses indicate moment of spout contact. f, Tip speed (top), tongue volume (middle) and absolute value of rate of tongue volume change (bottom) for the cue-evoked (left panels) and retrieval (right panels) licks shown in e. Protrusion offsets and retraction onsets were defined as the first and last minima in the rate of volume change (vertical dotted lines). The cue-evoked lick contained CSMs and SSMs between protrusion offset and retraction onset, whereas retrieval licks exhibited a single minimum in rate of volume change (marking the transition from protrusion to retraction).
Fig. 2 |
Fig. 2 |. ALM inactivation impairs CSMs.
a, ALM or PMM was bilaterally photoinactivated in 15% of randomly interleaved trials. b, Cumulative probability of tongue–spout contact during control and ALM-inactivated trials. PMM inactivation had no effect (Extended Data Fig. 8). Right, probability of spout contact within a trial (n = 20 mice). c, Left, data plotted as in b for protrusions. d, Left, protrusion probability during ALM inactivation as a function of reaction time (RT) on ALM-intact trials (n = 20 mice). P = e(a × (RT – b)); a = −0.027; b = 82. Right, latency from cue onset to tongue protrusion onset in control (black) and ALM-inactivated (blue) trials (n = 20 animals). e, Six complete tongue tip trajectories from side and bottom views during cue-evoked licks on control trials. A single lick is shown in bold for visibility. f, Protrusion (green), CSM (orange), SSM (yellow) and retraction (purple) phases of the trajectories from e are separately plotted. g, Three-dimensional trajectory of the bold lick shown in e, f, with lick phases colour-coded as in f. The ‘x’ symbol denotes spout contact. hj, Data plotted as in eg, for cue-evoked licks on ALM-inactivated trials. The ‘x’ symbols in i denote the absence of CSMs and/or SSMs. k, Tip-speed profiles for the licks from e, h. lp, Effect of ALM photoinactivation on L1 spout contact (l), L1 CSMs (m), and the duration (n), peak speed (o) and path length (p) of distinct lick phases on L1s. Data in mp are from trials in which L1 protrusions existed during control (black) and ALM-inactivated (blue) trials with a minimum of 10 data points for each lick phase (n = 12 mice). Data in b, d, lp are median ± IQR. *P < 0.05, **P < 0.01, ***P < 0.001, two-sided paired Wilcoxon signed-rank test; NS, not significant. All data are from sessions with the spout at 3.2 mm. Exact statistics are provided in Supplementary Table 7. Scale bars, 1 mm (e, h).
Fig. 3 |
Fig. 3 |. ALM activity reflects upcoming, ongoing and past CSMs.
a, Spike rasters (top row) and corresponding rate histograms (second row) for three example ALM neurons. Red and blue ticks, go cue and spout contact, respectively; grey and orange shading, licks and CSMs, respectively. The bracket above each raster indicates the window that was assessed for significant differences in rate histograms between trials with (orange) and without (black) CSMs on L1. Shading represents the bootstrapped s.e.m. across trials (Methods). Third row, CSM selectivity, defined as the normalized difference in firing rate from trials with and without CSMs on L1. Shading represents the bootstrapped IQR for selectivity (Methods). Maximum-likelihood-based single-trial classification accuracy for each example neuron is reported in the inset (Methods). Bottom row, ALM-population CSM selectivity for neurons with CSM selectivity before the cue (left), before L1 (middle) and after L1 (right). Only neurons with significant selectivity are shown (n = 38 out of 325 for pre-cue; n = 45 out of 325 for pre-L1 and n = 67 out of 325 for post-L1). Because each neuron was normalized to its own peak selectivity in the entire trial, the peak selectivity might not lie in the window of interest. b, Pulses of photoinhibition of 150-ms duration were applied 50 ms before the median time of L1 onset on randomly interleaved trials. c, Tongue volume profiles for a control bout and a bout with pulsed photoinhibition during L1 (blue line at L1 indicates laser on), resulting in a hypometric L1 that missed the spout. Scale bar, 10 mm3. dh, Effect of pulsed photoinhibition during L1 on L1 spout contact (d), L1 CSM generation (e), and duration (f), speed (g) and path length (h) of L1 lick phases. Data are median ± IQR. *P < 0.05, **P < 0.01, ***P < 0.001, two-sided paired Wilcoxon signed-rank test; n = 12 mice. Exact statistics are provided in Supplementary Table 12.
Fig. 4 |
Fig. 4 |. ALM activity is necessary for online corrections and is associated with double-step performance.
a, Top, still frames from time steps 1 to 5 (t1–t5) of a double-step trial. Spout contacts (middle) and tongue volumes (bottom) from double-step trials with ALM intact (left) or inactivated (right). Note the timing of still frames t1–t5 between cue and L2 onset. Scale bar, 2 mm. bd, L2 (left panels) and L3 (right panels) tongue tip trajectories during control (b) (no double-step and no photoinhibition) and double-step trials with ALM intact (c) or inactivated (d). Scale bar, 1 mm. e, Tongue tip speed profiles from c, d (black, control; blue, ALM inactivated). fj, Effect of double step and ALM inactivation on L2 and L3 spout contact (f), CSM probability (g), lick duration (h), lick path length (i) and number of licks per bout ( j). *P < 0.05; **P < 0.01 for a two-sided paired Wilcoxon signed rank test; n = 7 mice. AU, arbitrary units. k, Top, three principal components (PCs) of ALM population activity during control and double-step trials. Bottom, the Euclidean distance in population firing rate between control and double-step trials. Blue and yellow are bootstrapped median ± IQR of spout contact and neural activity divergence, respectively. l, Example tongue volumes, rasters, rate histogram and double-step selectivity for two example ALM neurons suppressed (left) or activated (right) by double step. Scale bar, 10 mm3. Bottom, population selectivity for neurons significantly activated (143 out of 465) or suppressed (110 out of 465) by double step (Methods). mp, Example neurons selective for premature bout termination following L2 (n = 107 out of 349 neurons) (m), L2 spout misses resulting in bout continuation (n = 83 out of 448 neurons) (n), CSMs on L2 misses (n = 14 out of 103 neurons) (o) and spout location on L2 contacts (n = 50 out of 419 neurons) (p). Histograms are bootstrapped mean ± s.e.m. Exact statistics are in Supplementary Tables 13, 14.

References

    1. Kier WM & Smith KK Tongues, tentacles and trunks: the biomechanics of movement in muscular-hydrostats. Zool. J. Linn. Soc 83, 307–324 (1985).
    1. Chartier J, Anumanchipalli GK, Johnson K & Chang EF Encoding of articulatory kinematic trajectories in human speech sensorimotor cortex. Neuron 98, 1042–1054. e1044 (2018). - PMC - PubMed
    1. Arce-McShane FI, Hatsopoulos NG, Lee JC, Ross CF & Sessle BJ Modulation dynamics in the orofacial sensorimotor cortex during motor skill acquisition. J. Neurosci 34, 5985–5997 (2014). - PMC - PubMed
    1. Meyer DE, Abrams RA, Kornblum S, Wright CE & Smith JE Optimality in human motor performance: ideal control of rapid aimed movements. Psychol. Rev. 95, 340–370 (1988). - PubMed
    1. Spijkers WA & Lochner P Partial visual feedback and spatial end-point accuracy of discrete aiming movements. J. Mot. Behav 26, 283–295 (1994). - PubMed

Publication types

LinkOut - more resources