. 2019 May 1;64(3):1309-1322.
doi: 10.1002/lno.11117.

The wind-driven formation of cross-shelf sediment plumes in a large lake

Affiliations

The wind-driven formation of cross-shelf sediment plumes in a large lake

Paul McKinney et al. Limnol Oceanogr. .

Abstract

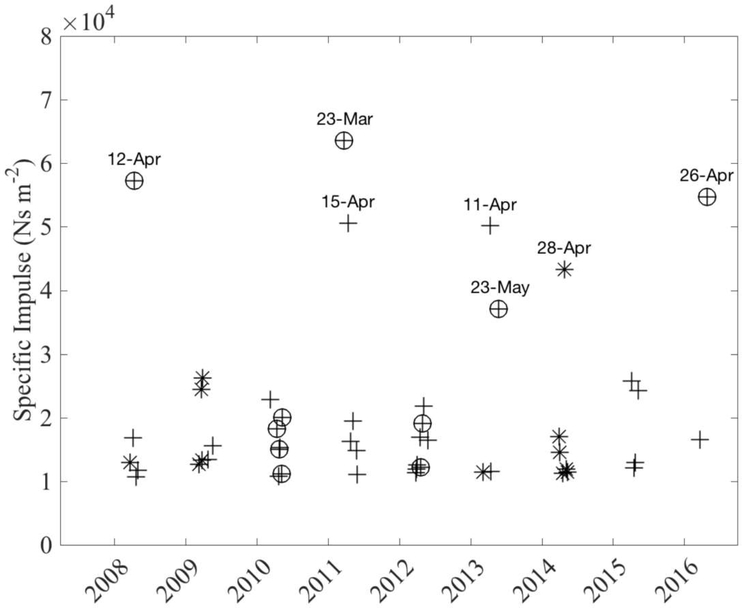
Wind-driven turbidity plumes frequently occur in the western arm of Lake Superior and may represent a significant cross shelf transport mechanism for sediment, nutrient and biota. Here we characterize a plume that formed in late April 2016 using observations from in situ sensors and remote sensing imagery, and estimate the volume of cross shelf transport using both the observations and an idealized analytical model of plume formation. The steady-state, barotropic model is used to determine a relationship between the intensity and duration of a wind event and the volume of water transported from nearshore to offshore during the event. The model transport is the result of nearshore flow in the direction of the wind and a pressure-gradient-driven counter flow in the deeper offshore waters, consistent with observations. The volume of offshore transport associated with the 2016 plume is estimated by both methods to have been on the order of 1010 m3. Analysis of similar events from 2008-2016 shows a strong relationship between specific wind impulse and plume volume. Differences in the intensity and duration of individual events as well as ice cover, which prevents plume formation, lead to interannual variability of offshore transport ranging over an order of magnitude and illustrates how wind-driven processes may contribute to interannual variability of ecosystem functioning.

Keywords: Lake Superior; Physical limnology; coastal processes; cross-shelf transport; plumes; wind-driven processes.


Figures

Fig. 1.
Fig. 1.
MODIS Terra imagery of Lake Superior's western arm, April 27, 2016. (a) Lake Superior coastline; box indicates location of the western arm, arrow indicates the Apostle Islands (AI). (b) True color image shows sediment plume discussed in the text; (A) nearshore buoy 45027; (B) offshore buoy 45028 and vertical profiler; (C) Nemadji River and meteorological station Superior, WI.; (D) meteorological station DULM5; (E) meteorological station DLH; (F) transect occupied by underwater glider. (c) Lake surface temperature. (d) Band 1 reflectance; gray lines indicate water depth, contour interval is 50 m. True color MODIS imagery from University of Wisconsin. MODIS SST from Ocean Color Group. MODIS band 1 reflectance from LP-DAAC.
Fig. 2.
Fig. 2.
Schematic figure of analytical model setting. The along-channel dimension is x, and the cross-channel dimension is y, with the sides of the channel at yL. Bottom bathymetry is designated H(y). The wind stress τ is entirely in the along-channel direction.
Fig. 3.
Fig. 3.
Conceptual diagram of the resulting flow. Surface wind stress from the northeast acts uniformly across the surface of the water and dominates flow in shallow areas. An opposing pressure gradient works throughout the water column and dominates flow in deeper areas, driving the plume offshore.
Fig. 4.
Fig. 4.
Observations from meteorological station DULM5, offshore buoy 45028 and vertical profiler. (a) Magnitude of the southwest-northeast component of wind stress observed at DULM5; Positive values indicate wind from the southwest; the shaded region corresponds to the 2016 wind event discussed in the text. (b) Vertical profiler observations of optical backscatter. (c) Water temperature at offshore buoy 45028; 1 meter depth (light gray), 5 meters depth (dark gray), and 40 meters depth (black).
Fig. 5.
Fig. 5.
Glider observations of (a) temperature, (b) optical backscatter, (c) CDOM fluorescence, and (d) chlorophyll; from the transect completed between May 04, 22:34 GMT and May 05, 15:52 GMT.
Fig. 6.
Fig. 6.
Cross channel bathymetry and velocity distribution. Circulation in the shallower nearshore areas is aligned with the wind stress. An oppositely directed flow occurs in the deeper channel, driven by an offshore-directed pressure gradient force.
Fig. 7.
Fig. 7.
Magnitude of specific impulse for significant (>1 × 10⁴ N s m−2) NE wind events in the western arm of Lake Superior for months of March, April and May, 2008–2016. The date corresponding to peak wind stress is plotted, dates of the largest wind events are labeled. Crosses indicate events with ice-free conditions. Asterisks indicate events that occurred when significant ice cover prevented plume formation. Circled ice-free events had cloud-free MODIS imagery within three days and were used in the MODIS band 1 reflectance analysis.
Fig. 8.
Fig. 8.
MODIS band 1 reflectance imagery used in the plume volume analysis. Dates of image acquisition are shown. The first cloud-free image within three days of the corresponding wind event was used. The image from April 27, 2016 discussed in the text is shown as Fig. 1d.
Fig. 9.
Fig. 9.
Correlation between plume area in MODIS imagery and (a) specific impulse of northeast wind events and (b) accumulated rainfall. Dates correspond to MODIS imagery.
Fig. 10.
Fig. 10.
Volume of nearshore water transported offshore in a plume event versus the magnitude of NE wind impulse. Plume volume was calculated from cloud-free and ice-free MODIS band 1 reflectance imagery acquired within 3 days of the wind event. Specific NE wind impulse was calculated from station DULM5 wind records. Dates correspond to MODIS imagery.
Fig. 11.
Fig. 11.
Cross shore transport by wind-driven plumes in the western arm of Lake Superior during March, April and May, 2008–2016. The volume of individual plume events was calculated using the wind records from station DULM5 and the relationship determined in Fig. 10 between NE wind impulse and plume volume. Dates of the largest wind events are indicated.

References

    1. Auer MT, and Bub LA. 2004. Selected Features of the Distribution of Chlorophyll along the Southern Shore of Lake Superior. J. Great Lakes Res. 30 Suppl 1: 269–284, doi:0.1016/S0380-1330(04)70391-3
    1. Austin JA 2013. The potential for Autonomous Underwater Gliders in large lake research. J. Great Lakes Res. 39 Suppl 1: 3–8, doi:10.1016/j.jglr.2013.01.004 - DOI
    1. Beardsley RC, Mofjeld H, Wimbush M, Flagg CN, and Vermersch JA Jr. 1977. Ocean tides and weather-induced bottom pressure fluctuations in the middle-Atlantic bight. J. Geophys. Res. 82: 3175–3182, doi:10.1029/JC082i021p03175. - DOI
    1. Bellinger BJ, and others. 2016. Water quality in the St. Louis River Area of Concern, Lake Superior: Historical and current conditions and delisting implications. J. Great Lakes Res. 42: 28–38, doi:10.1016/j.jglr.2015.11.008 - DOI
    1. Brink KH 2016. Cross-shelf exchange. Annu. Rev. Mar. Sci. 8: 59–78, doi:10.1146/annurev-marine-010814-015717 - DOI - PubMed

LinkOut - more resources