

Raman Spectroscopic Assessment of Myocardial Viability in Langendorff-Perfused Ischemic Rat Hearts
- PMID: 34012178
- PMCID: PMC8116620
- DOI: 10.1267/ahc.21-00016
Raman Spectroscopic Assessment of Myocardial Viability in Langendorff-Perfused Ischemic Rat Hearts
Abstract
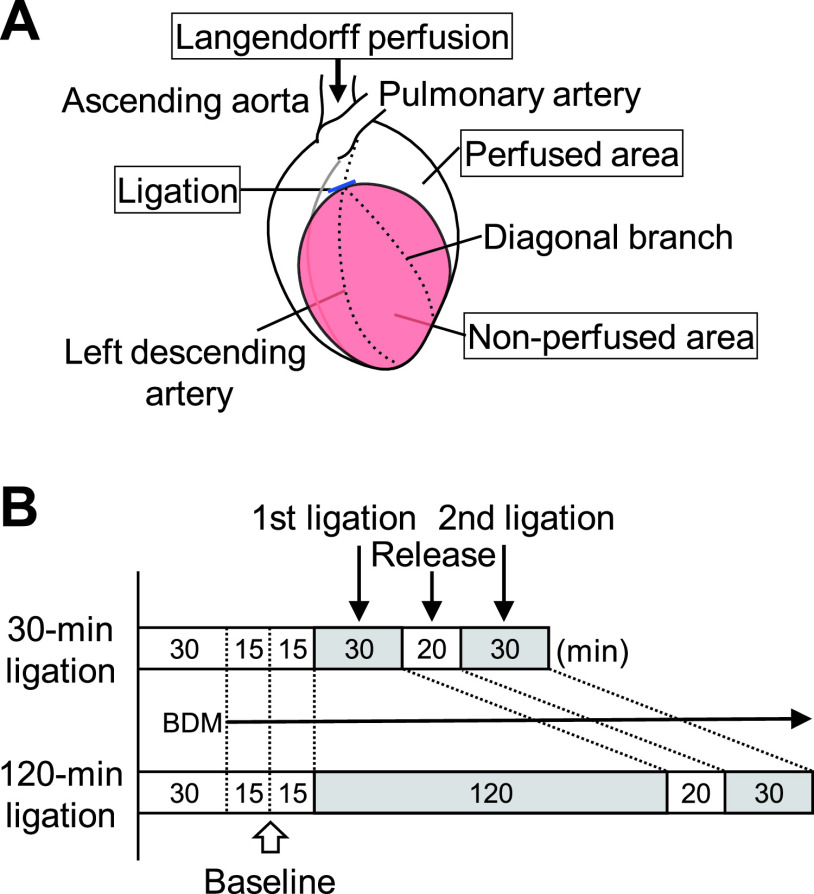
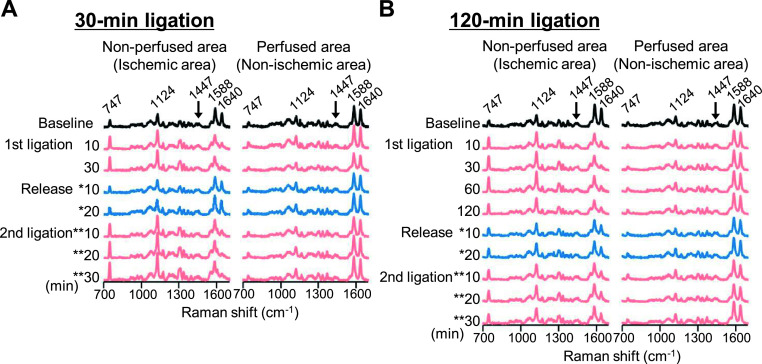
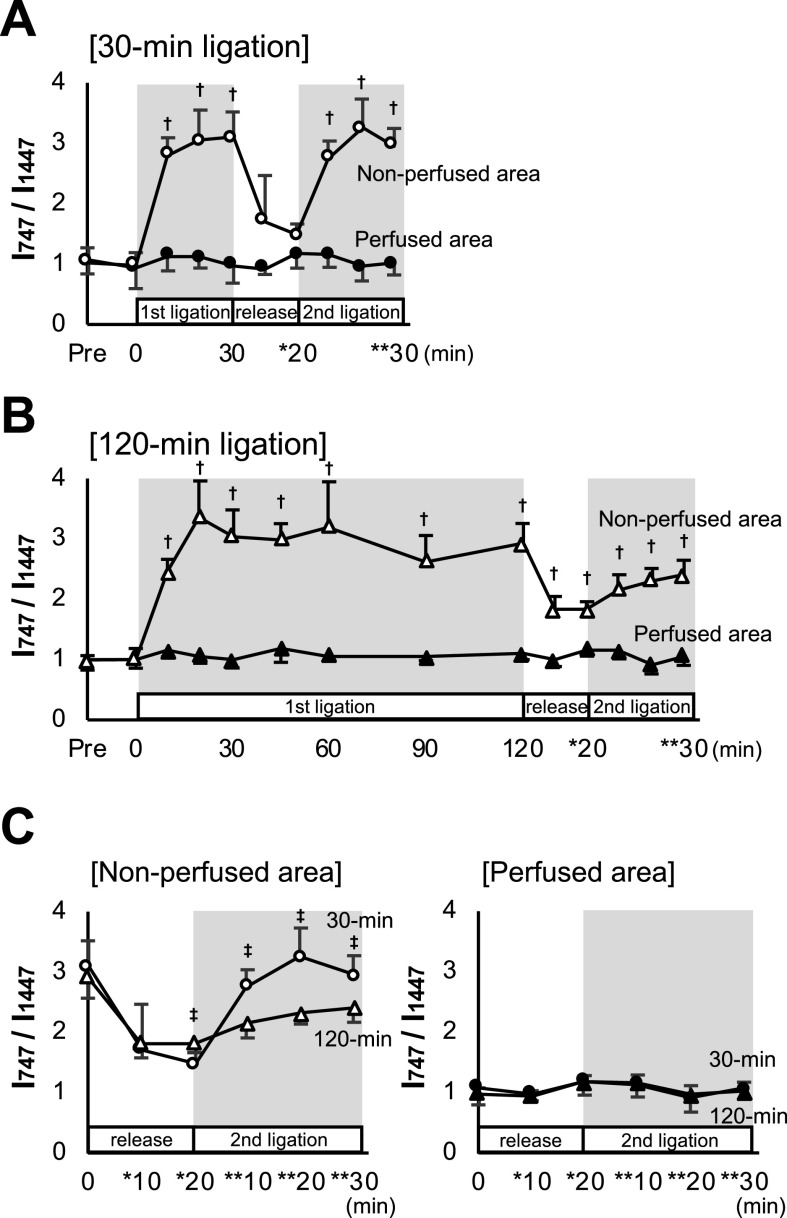
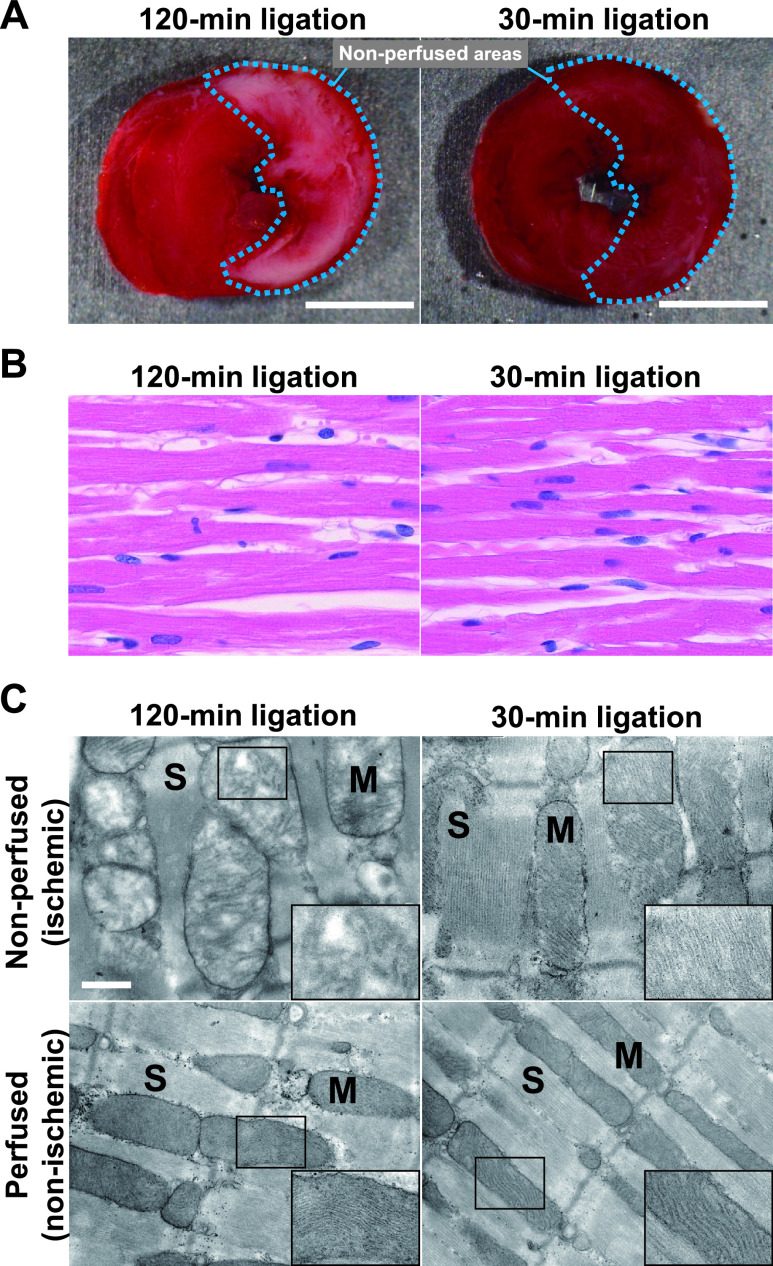
Spontaneous Raman spectroscopy, which senses changes in cellular contents of reduced cytochrome c, could be a powerful tool for label-free evaluation of ischemic hearts. However, undetermined is whether it is applicable to evaluation of myocardial viability in ischemic hearts. To address this issue, we investigated sequential changes in Raman spectra of the subepicardial myocardium in the Langendorff-perfused rat heart before and during ligation of the left coronary artery and its subsequent release and re-ligation. Under 532-nm wavelength excitation, the Raman peak intensity of reduced cytochrome c at 747 cm-1 increased quickly after the coronary ligation, and reached a quasi-steady state within 30 min. Subsequent reperfusion of the heart after a short-term (30-min) ligation that simulates reversible conditions resulted in quick recovery of the peak intensity to the baseline. Further re-ligation resulted in resurgence of the peak intensity to nearly the identical value to the first ischemia value. In contrast, reperfusion after prolonged (120-min) ligation that assumes irreversible states resulted in incomplete recovery of the peak intensity, and re-ligation resulted in inadequate resurgence. Electron microscopic observations confirmed the spectral findings. Together, the Raman spectroscopic measurement for cytochrome c could be applicable to evaluation of viability of the ischemic myocardium without labeling.
Keywords: Raman spectroscopy; cytochrome c; ischemia; mitochondria; myocardial viability.
2021 The Japan Society of Histochemistry and Cytochemistry.
Conflict of interest statement
VYoshinori Harada and Tetsuro Takamatsu have a patent JP5372137B2 issued to Tetsuro Takamatsu, Mitsugu Ogawa, Yoshinori Harada, and a patent P6103700 issued to Tetsuro Takamatsu, Yoshinori Harada, Takeo Minamikawa, Nanae Muranishi, Katsuhiro Ishii, Juichiro Ukon, Junichi Aoyama. The other authors have nothing to disclose.
Figures
Similar articles
-
Label-free detection of myocardial ischaemia in the perfused rat heart by spontaneous Raman spectroscopy.Sci Rep. 2017 Feb 10;7:42401. doi: 10.1038/srep42401. Sci Rep. 2017. PMID: 28186163 Free PMC article.
-
Dichotomy in the post-ischemic metabolic and functional recovery profiles of isolated blood-versus buffer-perfused heart.J Mol Cell Cardiol. 1996 Mar;28(3):531-9. doi: 10.1006/jmcc.1996.0049. J Mol Cell Cardiol. 1996. PMID: 9011636
-
Antiarrhythmic properties of specific inhibitors of sarcoplasmic reticulum calcium ATPase in the isolated perfused rat heart after coronary artery ligation.J Am Coll Cardiol. 1994 May;23(6):1505-10. doi: 10.1016/0735-1097(94)90399-9. J Am Coll Cardiol. 1994. PMID: 8176114
-
Assessment of myocardial salvage after ischemia and reperfusion using magnetic resonance imaging and spectroscopy.Circulation. 1989 Oct;80(4):969-82. doi: 10.1161/01.cir.80.4.969. Circulation. 1989. PMID: 2791255
-
Extracellular adenosine levels and cellular energy metabolism in ischemically preconditioned rat heart.Cardiovasc Res. 1998 Oct;40(1):74-87. doi: 10.1016/s0008-6363(98)00123-0. Cardiovasc Res. 1998. PMID: 9876319
Cited by
-
Raman microscopy of cryofixed biological specimens for high-resolution and high-sensitivity chemical imaging.Sci Adv. 2024 Dec 13;10(50):eadn0110. doi: 10.1126/sciadv.adn0110. Epub 2024 Dec 11. Sci Adv. 2024. PMID: 39661690 Free PMC article.
-
Label-free Assessment of the Nascent State of Rat Non-alcoholic Fatty Liver Disease Using Spontaneous Raman Microscopy.Acta Histochem Cytochem. 2022 Apr 27;55(2):57-66. doi: 10.1267/ahc.22-00013. Epub 2022 Apr 22. Acta Histochem Cytochem. 2022. PMID: 35509867 Free PMC article.
-
The impact of repeated temperature cycling on cryopreserved human iPSC viability stems from cytochrome redox state changes.Front Bioeng Biotechnol. 2024 Jul 30;12:1443795. doi: 10.3389/fbioe.2024.1443795. eCollection 2024. Front Bioeng Biotechnol. 2024. PMID: 39139293 Free PMC article.
-
Fiber optic Raman spectroscopy for the evaluation of disease state in Duchenne muscular dystrophy: An assessment using the mdx model and human muscle.Muscle Nerve. 2022 Sep;66(3):362-369. doi: 10.1002/mus.27671. Epub 2022 Jul 15. Muscle Nerve. 2022. PMID: 35762576 Free PMC article.
References
-
- Adar, F. and Erecinska, M. (1974) Resonance Raman spectra of the b- and c-type cytochromes of succinate-cytochrome c reductase. Arch. Biochem. Biophys. 165; 570–580. - PubMed
-
- Carmeliet, E. (1984) Myocardial ischemia: reversible and irreversible changes. Circulation 70; 149–151. - PubMed
-
- Cordero, E., Latka, I., Matthäus, C., Schie, I. W. and Popp, J. (2018) In-vivo Raman spectroscopy: from basics to applications. J. Biomed. Opt. 23; 071210. - PubMed
LinkOut - more resources
Full Text Sources
Other Literature Sources