. 2021 Apr 30:15:633757.
doi: 10.3389/fncel.2021.633757. eCollection 2021.

Plume Dynamics Structure the Spatiotemporal Activity of Mitral/Tufted Cell Networks in the Mouse Olfactory Bulb

Affiliations

Plume Dynamics Structure the Spatiotemporal Activity of Mitral/Tufted Cell Networks in the Mouse Olfactory Bulb

Suzanne M Lewis et al. Front Cell Neurosci. .

Abstract

Although mice locate resources using turbulent airborne odor plumes, the stochasticity and intermittency of fluctuating plumes create challenges for interpreting odor cues in natural environments. Population activity within the olfactory bulb (OB) is thought to process this complex spatial and temporal information, but how plume dynamics impact odor representation in this early stage of the mouse olfactory system is unknown. Limitations in odor detection technology have made it difficult to measure plume fluctuations while simultaneously recording from the mouse's brain. Thus, previous studies have measured OB activity following controlled odor pulses of varying profiles or frequencies, but this approach only captures a subset of features found within olfactory plumes. Adequately sampling this feature space is difficult given a lack of knowledge regarding which features the brain extracts during exposure to natural olfactory scenes. Here we measured OB responses to naturally fluctuating odor plumes using a miniature, adapted odor sensor combined with wide-field GCaMP6f signaling from the dendrites of mitral and tufted (MT) cells imaged in olfactory glomeruli of head-fixed mice. We precisely tracked plume dynamics and imaged glomerular responses to this fluctuating input, while varying flow conditions across a range of ethologically-relevant values. We found that a consistent portion of MT activity in glomeruli follows odor concentration dynamics, and the strongest responding glomeruli are the best at following fluctuations within odor plumes. Further, the reliability and average response magnitude of glomerular populations of MT cells are affected by the flow condition in which the animal samples the plume, with the fidelity of plume following by MT cells increasing in conditions of higher flow velocity where odor dynamics result in intermittent whiffs of stronger concentration. Thus, the flow environment in which an animal encounters an odor has a large-scale impact on the temporal representation of an odor plume in the OB. Additionally, across flow conditions odor dynamics are a major driver of activity in many glomerular networks. Taken together, these data demonstrate that plume dynamics structure olfactory representations in the first stage of odor processing in the mouse olfactory system.

Keywords: natural sensing; olfaction; olfactory navigation; plume dynamics; population dynamics; sensory processing.


Conflict of interest statement

The authors declare that the research was conducted in the absence of any commercial or financial relationships that could be construed as a potential conflict of interest.

Figures

Figure 1
Figure 1
Plume presentations and head-fix setup for in-vivo recording experiments. (A) All experiments conducted in a 40 × 40 × 80 cm wind tunnel for quick clearing of odor presentations. The odor port (not pictured) was located ~13 cms upwind of the animal's nose. (B) (Left) Graphic detailing experimental setup. (Right) Ethanol odor concentration measured using a modified, commercially available ethanol sensor placed ~4 mm from the outer edge of the mouse's nostril. (C) Diagram depicting flow conditions (high, medium, or low) of the 40 trials within a single session. (D) Example odor traces are depicted for each flow condition. (E) Histograms of the odor concentration magnitude sampled across two examples trials show a change in skewness between low flow (left, blue) and high flow (right, red), with skewness increasing with increased airflow during plume presentations. (F) Comparisons between the deconvolved sensor signal and a PID signal during a set of paired recordings show odor concentration dynamics of the deconvolution can recover dynamics observed in the PID recordings (r = 0.61, p < 0.001). An example from low flow (top) and high flow (bottom) are shown. (G,H) Skewness (G) and asymmetry (H) of the deconvolved ethanol signal vs. the PID traces for each trial. All points lie close to the bisector (Purple line, labeled “exact”) showing that the deconvolution preserves measures of skewness and asymmetry consistent to the PID trace. High flow trials (orange) are separable from low flow trials (blue) and are substantially different from 0 (the expectation for any symmetric distribution, e.g., a Gaussian).
Figure 2
Figure 2
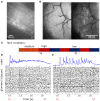
In-vivo recording of glomerular population response. (A) Change in fluorescence of MT cells in an acute in vitro OB slice preparation averaged over 3 s following a puff of high K+ solution. (B) In vivo view of the dorsal olfactory bulb through an implanted cranial window. (Left) Window activity averaged across a single trial. (Right) Projected standard deviation for the same trial shows MT activity in the dorsal OB responsive to the odor presentation. (C) Diagram depicting flow conditions (high, medium, or low) of the 40 trials within a single session. (D) The deconvolved ethanol trace (blue) compared to the deconvolved response of each glomeruli (black) within the recorded FOV during a single low flow trial depicted by asterisk in (C). Red arrows indicate onset and offset of plume presentation. (E) Same as (D) but for a single high flow trial from the same session also depicted by asterisk in (C).
Figure 3
Figure 3
Population response of MT cells in dorsal OB respond to changes in odor concentration during plume presentations. (A) Simultaneously recorded deconvolved ethanol plume (top) and imaging of calcium signals from MT cell activity in an example FOV of a Thy1-GCaMP6f (GP5.11) mouse (bottom). Baseline and odorless periods (black) and odor plume input (red) are shown from the indicated time points. Fluctuations in the odor plume elicit repeatable activation of specific glomerular networks in response to whiffs of odor during plume presentations. (B) (Left) An image of the principal component loadings corresponding to the odor-evoked activity [principal component 2 (PC2)]. (Right) Time series of PC2 (top, red) aligned to the simultaneous ethanol signal (bottom, black). Scale bar indicates 2 s. (C) Cross-correlogram between the two signals in (B). Red line indicates a slight offset from 0 for the peak correlation (~250 ms mean lag across FOVs from sensor to OB response). Gray plots average the null correlation ± SEM (correlation of neural activity from the example trial with odor signal from all non-matched trials in session). (D) Cross-correlations (mean ± SEM) between odor evoked population activity (principal component) and ethanol sensor signal are strong across 3 Thy1-GCaMP6f (GP5.11) mice (r = 0.54 ± 0.07).
Figure 4
Figure 4
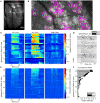
The spatial and temporal decomposition of CNMF identifies glomeruli and denoises their traces. (A) The white box outlines the FOV used for analysis as it relates to the larger recording window. The image shows the standard deviation projection of the aligned recording during a single odor presentation. (B) Mean subtracted maximum projection of the same trial overlaid with ROIs from CNMF spatial decomposition shows segmentation of glomeruli for a single FOV using CNMF spatial decomposition. The spatial decomposition of the FOV results in 26 glomeruli (four dropped units after merge analysis not pictured) as outlined and numbered. (C) Shows the mean traces of each glomerulus's CNMF temporal decomposition within each flow condition (left to right : all trials, low flow, high flow). Trials sorted by magnitude of normalized mean deconvolved response (E) during odor exposure. (D) The deconvolved CNMF response of a single glomerulus [pink fill (B)] to all low (gray) and high (black) flow trials across the recording session shows glomerular responses vary due to the unique odor concentration dynamics of each plume. (E) Deconvolution accelerates dynamics of glomerular responses as shown by the mean deconvolved traces of the corresponding glomeruli depicted in (C). (F) The cumulative mean, a sum of the mean responses for each glomerulus in low and high flow, are plotted as a stacked bar graph so that comparisons between mean responses can be made within and across glomeruli simultaneously. Mean responses are calculated for the deconvolution (E) within each flow condition during the plume release and vary significantly between conditions [t(110) = 11.43, p < 0.001] with higher average responses in low flow.
Figure 5
Figure 5
Glomerular population activity follows odor concentration dynamics across plume encounters. (Left) The cross-correlation between the deconvolved ethanol trace and each glomerulus's deconvolved activity trace is calculated within each trial and then averaged across trials. Each row is a glomeruli and each time point represents the cross-correlation at the indicated lag. Glomeruli are sorted in order of decreasing magnitude of correlation coefficient (see methods). (Right) Same as left but glomerular responses are trial shuffled so that the signals compared are not from the same trial. Glomeruli are sorted to match their corresponding unshuffled cross-correlation in the right panel. (B) Scatterplot of the correlation coefficient of all glomeruli if compared to their respective shuffled coefficient. Glomeruli plotted in (A) are marked in black if their coefficient exceeds their shuffled coefficient from a single trial shuffled comparison by 2 standard deviations. (C) The cumulative correlation, a sum of correlation coefficients for each glomerulus in low and high flow, are plotted as a stacked bar graph so that comparisons between mean responses can be made within and across glomeruli simultaneously. The cumulative plotting shows variation in ability to detect changes in odor concentration dynamics across glomeruli both within and across flow conditions. On average, a glomerulus's tracking ability varies significantly between conditions [t(110) = 12.81, p < 0.001], with most glomeruli having stronger correlation coefficients in high flow trials. Glomeruli that significantly correlate with plume dynamics in at least one condition are plotted in blues (*) while those that do not are plotted in grays. (D) Binary cross-correlation. Top: Simultaneously recorded signals shown for two example glomeruli responding to the same example trial's odor plume. Odor and glomerular activity traces plotted with their respective thresholds (dotted, odor threshold: mean during plume presentation, neural threshold: ± 2 st. dev of baseline). Bottom: Resulting binarized traces plotted for each trial illustrate the magnitude of concurrent activity as events (stars) between the plume and the response of each glomerulus across the experimental session.
Figure 6
Figure 6
Glomeruli that respond more reliably to plumes are more correlated with their dynamics. (A) Responsivity scores plotted as a cumulative bar graph to illustrate differences within and across glomeruli when responsivity is calculated across all conditions (lightest blue) or is calculated exclusively within low flow (medium blue) or high flow (dark blue). Glomeruli are sorted top to bottom by decreasing average tracking ability (correlation magnitude) and glomeruli that significantly track plume dynamics (as defined in methods) are plotted in blue hues(*) while those that do not are plotted in gray hues. The graph shows magnitude of odor concentration tracking is correlated with (r = 0.76, p < 0.001), but is not strictly defined by response reliability as glomeruli exist that respond strongly to odor presence but not to concentration dynamics. In addition, within flow comparisons show responsivity is significantly higher in low flow than high flow [t(110) = 12.1263, p < 0.001]. (B) Within flow condition, responsivity is plotted against tracking ability (correlation magnitude) for each glomerulus (circle). To represent the population response, the average responsivity across all glomeruli (low average = yellow dot, high average = red dot) is plotted against average correlation with plume dynamics within low (light blue) and high (dark blue) flow conditions illustrating how flow moderates these relationships. Across glomeruli, responsivity is positively correlated with tracking ability as is illustrated by the lines of best fit. On average, higher flow predicts a decrease in average responsivity level but also predicts an increase in tracking ability. (C) Average responsivity in low and high flow is plotted for each glomerulus, and the change in mean responsivity between flows shown in (A) is explicitly plotted for each glomerulus (red line) as well. Glomeruli are sorted by increasing tracking ability (from left to right) showing glomeruli with higher response reliability are more sensitive to plume dynamics.
Figure 7
Figure 7
Higher magnitude of glomerular response power (0–5 Hz) is associated with higher correlation with plume dynamics. (A) Ethanol signal from a single low flow trial is plotted (top-left) and a corresponding Short-time Fourier transform (STFT) of the plume (time between red dotted lines) is shown below (bottom-left). STFTs are also shown for a sample of glomeruli responding to the plume (right). STFTs show most response power of the glomeruli and odor signal is concentrated between 0 and 5 Hz. Glomeruli STFTs are sorted (top to bottom) by increasing correlation with plume dynamics. (B) Same as (A) but for a single high flow trial from another example FOV. (C) Box plots for the distributions of stimulus power (0–5 Hz) for all trials within the demarcated flow condition are plotted for each session. On average, high flow distribution means (dark blue) significantly exceeded low flow distribution means (light blue) [t(116) = 31, p < 0.001]. (D) Within both high and low flow conditions, tracking (correlation magnitude of glomerular responses with plume dynamics) is plotted against response power (0–5 Hz power spectrum change between “odor off” and “odor on” periods) for each glomerulus (blue hues, circles). Glomeruli with stronger tracking have a greater increase in response power during plume presentations (r = 0.74, p < 0.001). When calculated within flow, this relationship is significant within high flow (r = 0.73, p < 0.001), but not within low flow (r = 0.19, p = 0.05). The average response across all glomeruli is plotted (low average = yellow dot, high average = red dot) to represent the population response. Mean response power of the glomerular population is not significantly different between low and high flow, except for when calculated with glomeruli whose mean activity is in the 75th percentile (low average = yellow circle, high average = red circle). (E) Response power of each glomerulus is again plotted, but the change within a glomerulus between low flow (light blue) and high flow (dark blue) is signified by the red line. Glomeruli are plotted sequentially along the x-axis and are sorted left to right by increasing tracking ability. As tracking ability increases, so does the change in response power between flow conditions. This is consistent with the significant change in mean response between flow condition observed in the 75th percentile [plotted as red/yellow circles in (D)].

References

    1. Ache B. W., Hein A. M., Bobkov Y. V., Principe J. C. (2016). Smelling time: a neural basis for olfactory scene analysis. Trends Neurosci. 39, 649–655. 10.1016/j.tins.2016.08.002 - DOI - PMC - PubMed
    1. Adam Y., Livneh Y., Miyamichi K., Groysman M., Luo L., Mizrahi A. (2014). Functional transformations of odor inputs in the mouse olfactory bulb. Front. Neural Circuits 8:129. 10.3389/fncir.2014.00129 - DOI - PMC - PubMed
    1. Atema J. (1996). Eddy chemotaxis and odor landscapes: exploration of nature with animal sensors. Biol. Bull. 191, 129–138. 10.2307/1543074 - DOI - PubMed
    1. Baker K. L., Dickinson M., Findley T. M., Gire D. H., Louis M., Suver M. P., et al. . (2018). Algorithms for olfactory search across species. J. Neurosci. 38, 9383–9389. 10.1523/JNEUROSCI.1668-18.2018 - DOI - PMC - PubMed
    1. Batista-Brito R., Vinck M., Ferguson K. A., Chang J., Laubender D., Lur G., et al. . (2017). Developmental dysfunction of VIP interneurons impairs cortical circuits. Neuron 95, 884–895.e9. 10.1016/j.neuron.2017.07.034 - DOI - PMC - PubMed

LinkOut - more resources