. 2021 May 3:12:659018.
doi: 10.3389/fimmu.2021.659018. eCollection 2021.

Immunological Biomarkers of Fatal COVID-19: A Study of 868 Patients

Affiliations

Immunological Biomarkers of Fatal COVID-19: A Study of 868 Patients

Esperanza Martín-Sánchez et al. Front Immunol. .

Abstract

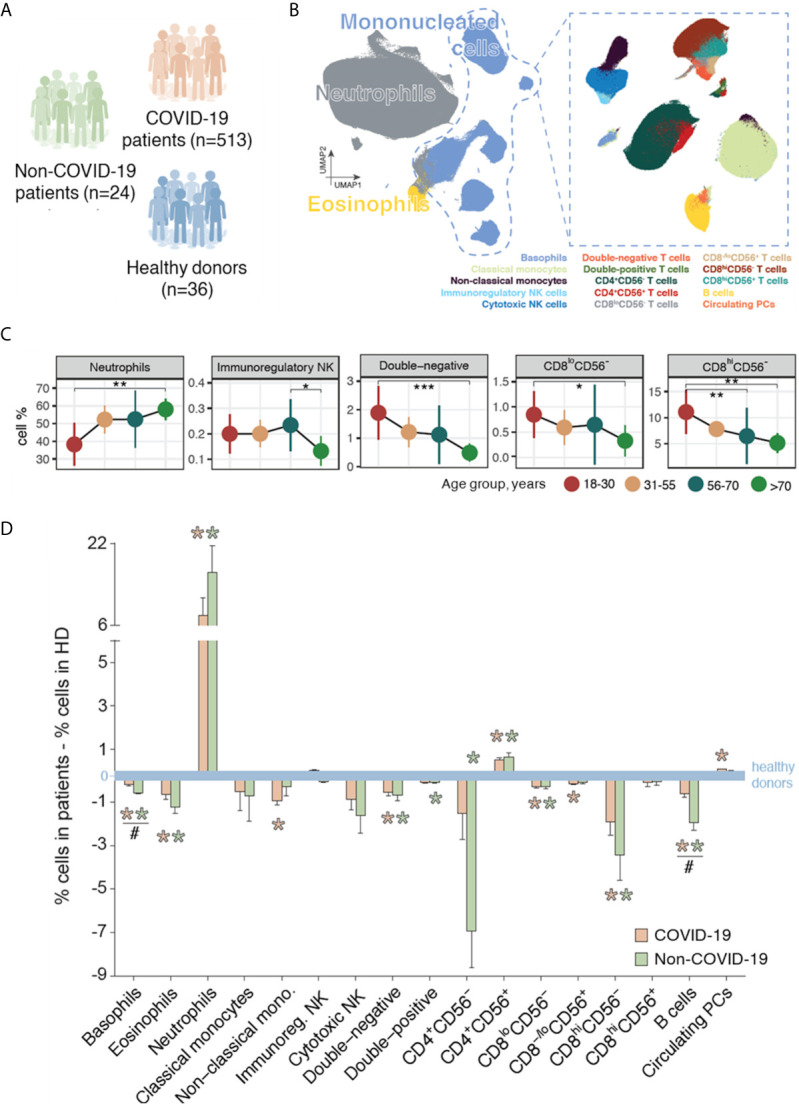
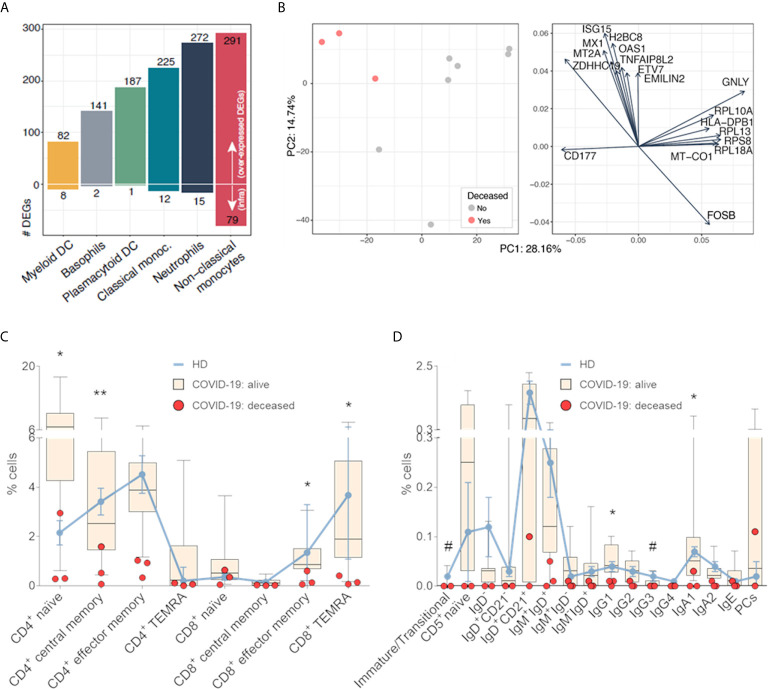
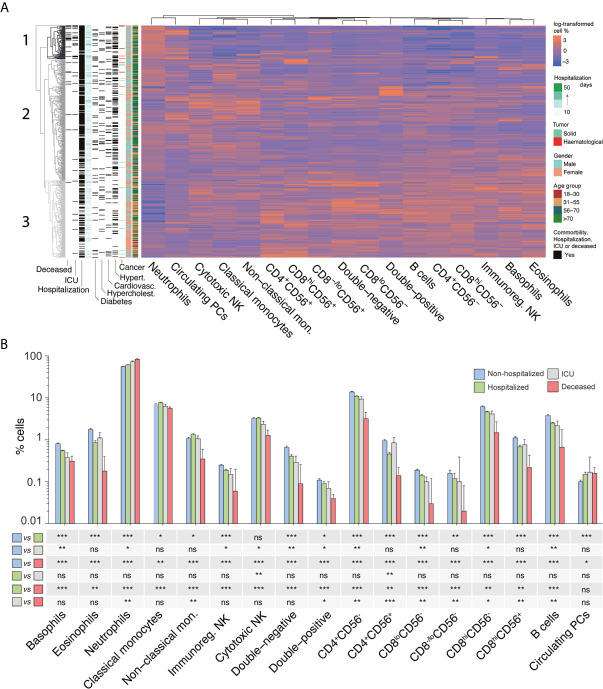
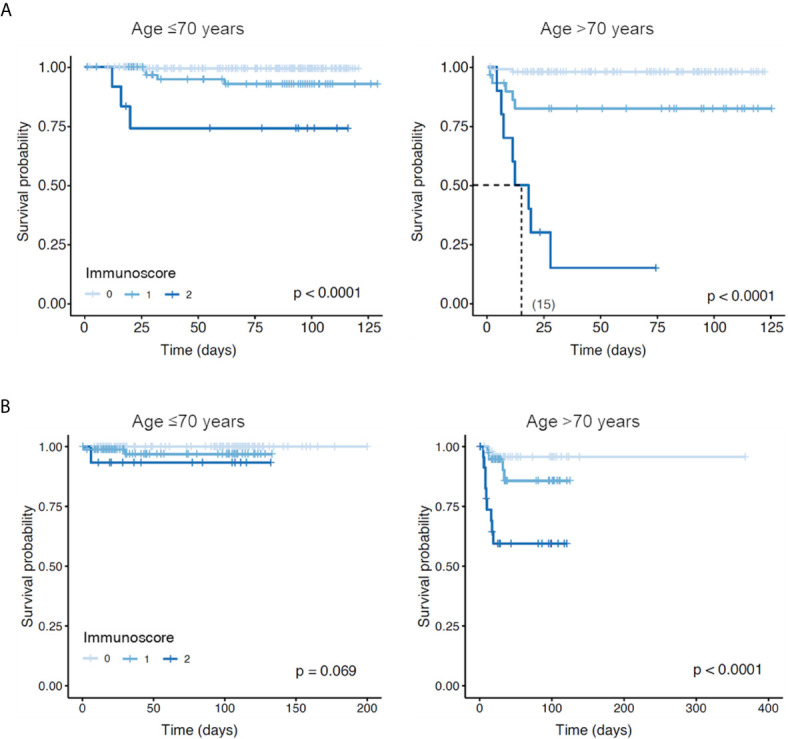
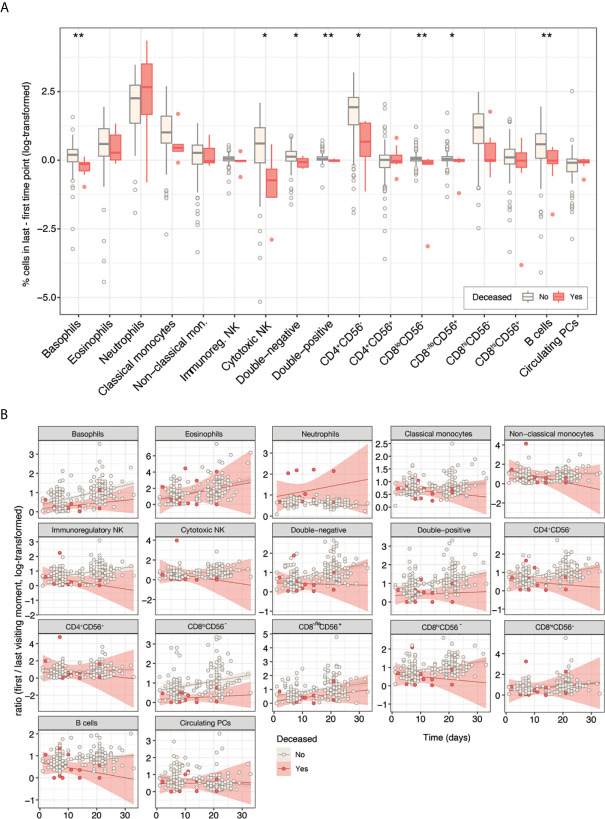
Information on the immunopathobiology of coronavirus disease 2019 (COVID-19) is rapidly increasing; however, there remains a need to identify immune features predictive of fatal outcome. This large-scale study characterized immune responses to severe acute respiratory syndrome coronavirus-2 (SARS-CoV-2) infection using multidimensional flow cytometry, with the aim of identifying high-risk immune biomarkers. Holistic and unbiased analyses of 17 immune cell-types were conducted on 1,075 peripheral blood samples obtained from 868 COVID-19 patients and on samples from 24 patients presenting with non-SARS-CoV-2 infections and 36 healthy donors. Immune profiles of COVID-19 patients were significantly different from those of age-matched healthy donors but generally similar to those of patients with non-SARS-CoV-2 infections. Unsupervised clustering analysis revealed three immunotypes during SARS-CoV-2 infection; immunotype 1 (14% of patients) was characterized by significantly lower percentages of all immune cell-types except neutrophils and circulating plasma cells, and was significantly associated with severe disease. Reduced B-cell percentage was most strongly associated with risk of death. On multivariate analysis incorporating age and comorbidities, B-cell and non-classical monocyte percentages were independent prognostic factors for survival in training (n=513) and validation (n=355) cohorts. Therefore, reduced percentages of B-cells and non-classical monocytes are high-risk immune biomarkers for risk-stratification of COVID-19 patients.

Keywords: COVID-19; SARS-CoV-2; biomarkers; flow cytometry; lymphopenia; outcome; survival.


Conflict of interest statement

The authors declare that the research was conducted in the absence of any commercial or financial relationships that could be construed as a potential conflict of interest.

Figures

Figure 1
Figure 1
Immune profiling of patients with COVID-19, patients with non-SARS-CoV-2 infections, and healthy donors (HDs). (A) Immune profiling was performed using multidimensional flow cytometry in a training series of 513 patients with COVID-19, 24 patients with other infections, and 36 HDs. (B) Schematic representation of the 17 immune cell-types systematically identified through unbiased and semi-automated analysis in peripheral blood (PB) samples from all subjects included in the study (n=573). (C) Immune cell-type percentages in PB samples of HDs by age group (18–30 years, n=8; 31–55 years, n=8; 56–70 years, n=11; >70 years, n=9) for cell-types with significantly different levels across age groups. *P <0.05; **P <0.01; ***P <0.001 in all panels. Statistical significance was evaluated using the Kruskal–Wallis test, with multiple testing corrected using the Holm method. (D) Immune response in patients with COVID-19 (n=513) and in patients with other infections (n=24), illustrated as the variations in the median percentages of each cell-type versus the median values in age-group-matched HDs (n=36, blue line). Orange asterisks indicate significant differences between patients with COVID-19 and HDs, and green asterisks indicate significant differences between patients with other infections and HDs. Hash symbols (#) indicate significant differences between patients with COVID-19 and patients with other infections (P <0.05). Statistical significance was evaluated using Mann-Whitney test.
Figure 2
Figure 2
Activation and differentiation of innate and adaptive immune cells after SARS-CoV-2 infection. (A) Number of differentially expressed genes (DEGs) in myeloid dendritic cells (DC), basophils, plasmacytoid DC, classical monocytes, neutrophils and non-classical monocytes, isolated from peripheral blood (PB) samples of COVID-19 patients (n=11) and age-matched healthy donors (HDs, n=4). The number of under- and over-expressed DEGs is depicted, and cell types were ordered from the lowest to the highest number of DEGs. (B) Principal component analysis of RNA-seq data from neutrophils showing partial segregation between COVID-19 patients with favorable vs fatal outcome (left panel). DEGs in neutrophils from COVID-19 patients as shown in left panel (right panel). Percentage of antigen-dependent differentiation of (C) T and (D) B cell subsets in the PB of 14 COVID-19 patients (11 alive and 3 deceased) and 4 age-matched HDs. Lines represent median values in HDs; boxes correspond to minimum-to-maximum values in alive patients; and dots indicate individual deceased patients. *P <0.05; **P <0.01 between alive and deceased COVID-19 patients. Hash symbol (#) indicates significant differences between HDs and COVID-19 patients (P <0.05). Statistical significance was calculated using the Mann-Whitney test. CM, central memory; EM, effector memory; TEMRA, effector memory re-expressing CD45RA T cells.
Figure 3
Figure 3
The immune landscape of patients with COVID-19 and its association with disease severity. (A) Unsupervised clustering of 513 patients with COVID-19 based on the relative distribution of 17 immune cell types in peripheral blood (PB) samples taken at presentation. For the columns to the left of the cell-percentage data, moving from right to left, patient rows are color-coded according to age and gender; green and red marks indicate the patients with solid or hematological tumors; dark gray marks indicate the presence of the comorbidities of hypertension, cardiovascular disease, hypercholesterolemia, and diabetes; light blue-to-green marks indicate duration of hospitalization; and dark gray marks indicate patients requiring hospitalization (n=395), patients who needed intensive care unit (ICU) admission (n=32), and patients who died (n=23). (B) Median percentages of the 17 immune cell-types in PB samples from patients with COVID-19 who were not hospitalized (n=118) and those who required hospitalization (n=395), as well as the subsets of hospitalized patients who required ICU admission (n=32) and/or who died from COVID-19 (n=23). *P <0.05; **P <0.01; ***P <0.001; ns, not significant. Statistical significance was evaluated using Mann–Whitney tests.
Figure 4
Figure 4
Overall survival of patients with COVID-19 according to presence of two high-risk immune biomarkers identified in this study. (A) Patients had an immunoscore of 0, 1, or 2 according to the absence or the presence of one or two risk factors, respectively: <0.67% non-classical monocytes and <1% B cells. Among patients aged ≤70 years, 274, 80, and 12 had an immunoscore of 0, 1, or 2, respectively. Among patients aged >70 years, 107, 30, and 10 had an immunoscore of 0, 1, or 2, respectively. (B) This immunoscore was further validated in an independent cohort of additional 355 patients with COVID-19, where 126, 91, and 15 patients aged ≤70 years had an immunoscore of 0, 1, or 2, respectively; whereas 55, 43, and 25 patients aged >70 years had an immunoscore of 0, 1, or 2, respectively.
Figure 5
Figure 5
Divergent immune response trajectories in patients with COVID-19 with longitudinal immune monitoring who had favorable (n=158) or fatal (n=9) outcomes. (A) Absolute variations in percentages of immune cell-types from first to last PB sampling time point, according to outcome. *P <0.05; **P <0.01. Statistical significance was evaluated using the Kruskal–Wallis test. (B) Longitudinal relative variations in percentages of immune cell-types from first through all subsequent PB sampling time points, according to outcome.

References

    1. Zhang X, Tan Y, Ling Y, Lu G, Liu F, Yi Z, et al. . Viral and Host Factors Related to the Clinical Outcome of COVID-19. Nature (2020) 583(7816):437. 10.1038/s41586-020-2355-0 - DOI - PubMed
    1. Huang C, Wang Y, Li X, Ren L, Zhao J, Hu Y, et al. . Clinical Features of Patients Infected With 2019 Novel Coronavirus in Wuhan, China. Lancet (2020) 395(10223):497–506. 10.1016/S0140-6736(20)30183-5 - DOI - PMC - PubMed
    1. Wu H, Zhu H, Yuan C, Yao C, Luo W, Shen X, et al. . Clinical and Immune Features of Hospitalized Pediatric Patients With Coronavirus Disease 2019 (COVID-19) in Wuhan, China. JAMA Netw Open (2020) 3(6):e2010895. 10.1001/jamanetworkopen.2020.10895 - DOI - PMC - PubMed
    1. Guan W, Ni Z, Hu Y, Liang W, Ou C, He J, et al. . Clinical Characteristics of Coronavirus Disease 2019 in China. N Engl J Med (2020) 382(18):1708–20. 10.1056/NEJMoa2002032 - DOI - PMC - PubMed
    1. Mehta P, McAuley DF, Brown M, Sanchez E, Tattersall RS, Manson JJ. COVID-19: Consider Cytokine Storm Syndromes and Immunosuppression. Lancet (2020) 395(10229):1033–4. 10.1016/S0140-6736(20)30628-0 - DOI - PMC - PubMed

Publication types

MeSH terms