. 2021 Apr;13(4):2242-2254.
doi: 10.21037/jtd-20-3069.

ECM2 and GLT8D2 in human pulmonary artery hypertension: fruits from weighted gene co-expression network analysis

Affiliations

ECM2 and GLT8D2 in human pulmonary artery hypertension: fruits from weighted gene co-expression network analysis

Zeyang Bai et al. J Thorac Dis. 2021 Apr.

Abstract

Background: Pulmonary artery hypertension (PAH) is an incurable disease with a high mortality rate. Current medications ameliorate symptoms but cannot target adverse vascular remodeling. New therapeutic strategies for PAH need to be established.

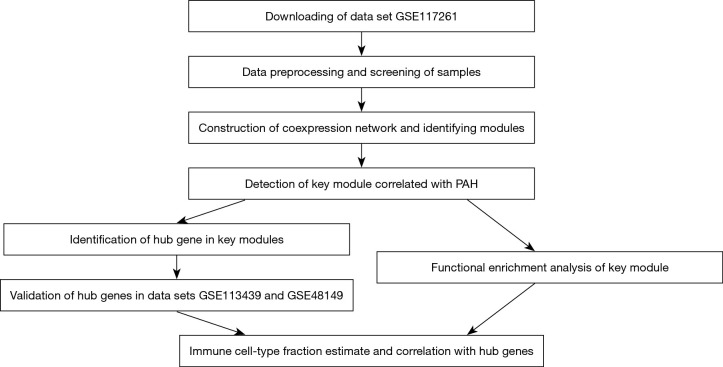
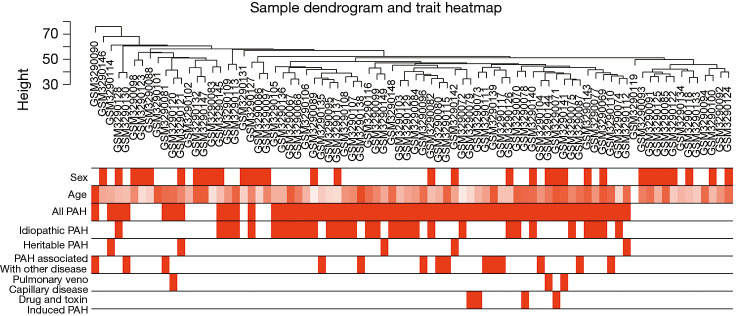
Methods: Using the weighted gene coexpression network analysis (WGCNA) algorithm, we constructed a coexpression network of dataset GSE117261 from the Gene Expression Omnibus (GEO) database. Key modules were identified by the relationship between module eigengenes and clinical traits. Hub genes were screened out based on gene significance (GS), module membership (MM), and mean pulmonary artery pressure (mPAP). External validations were conducted in GSE48149 and GSE113439. Functional enrichment and immune cell infiltration were analyzed using Metascape and CIBERSORTx.

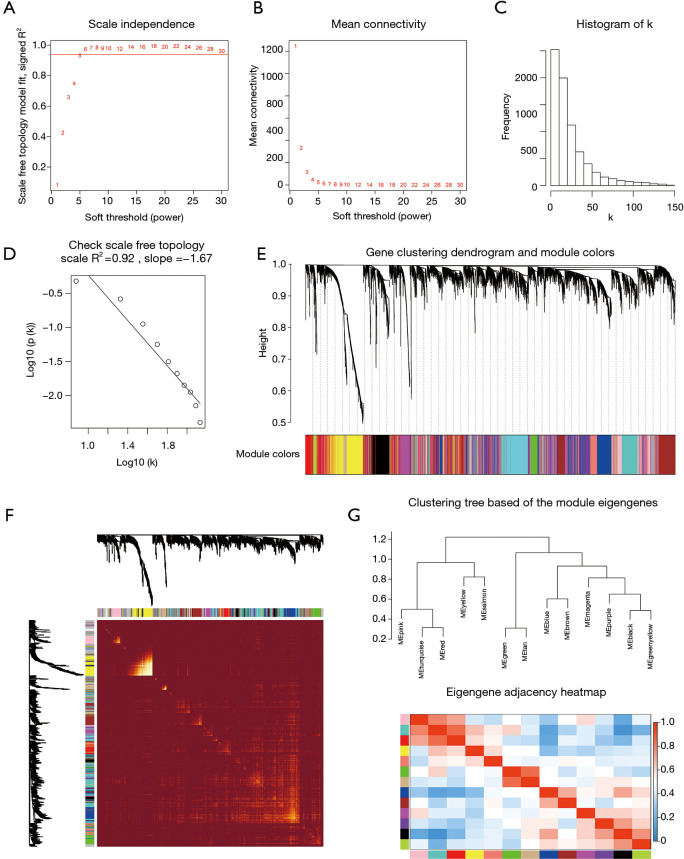
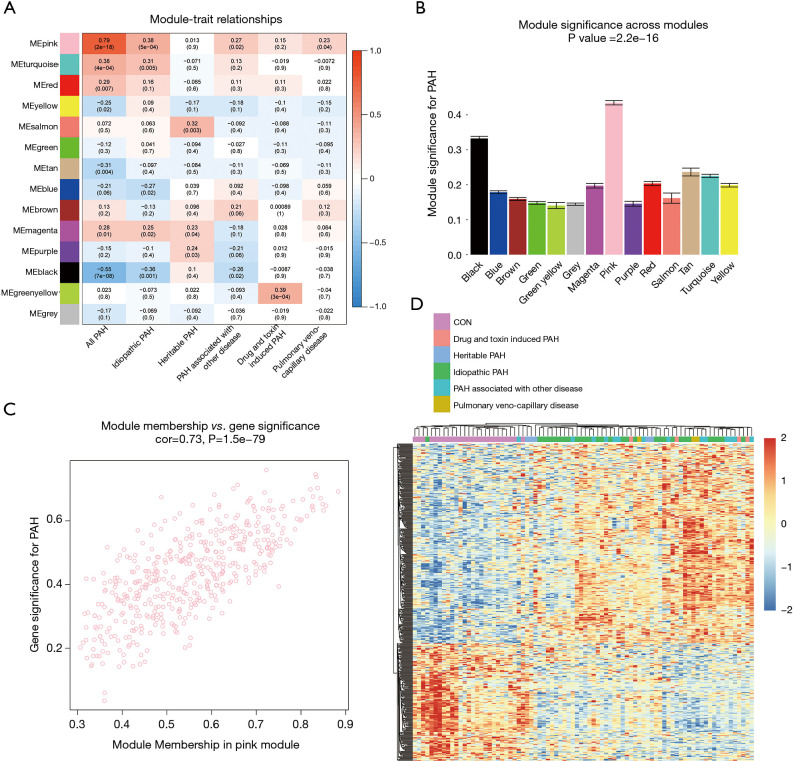
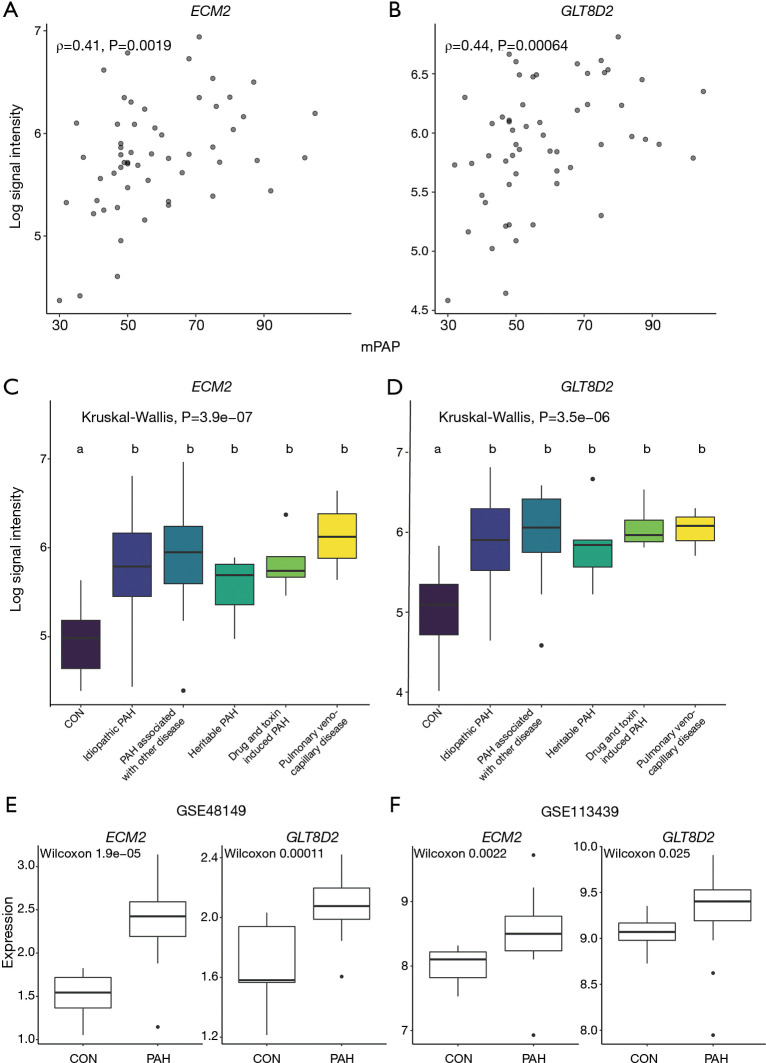
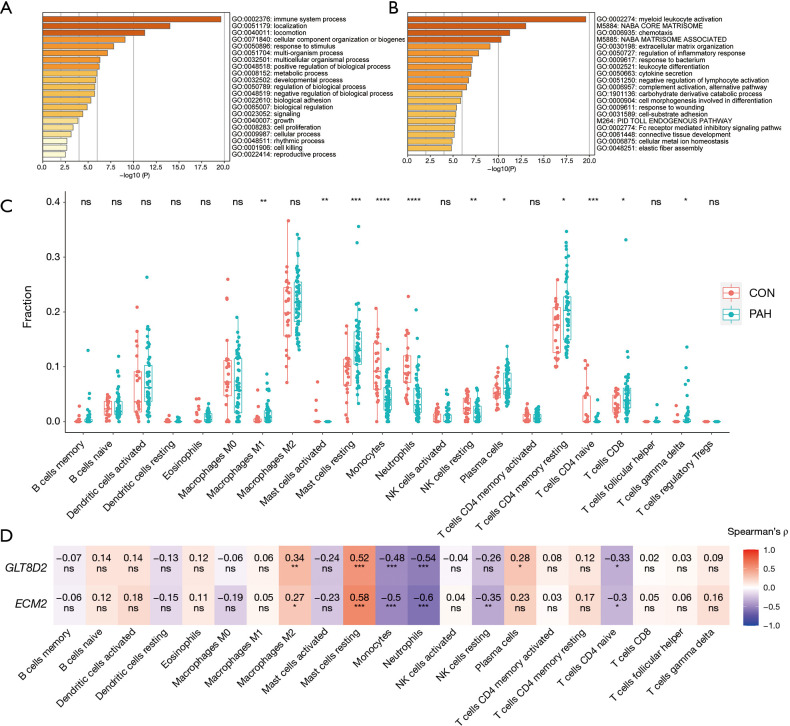
Results: The WGCNA analysis revealed 13 coexpression modules. The pink module had the highest correlation with PAH in terms of module eigengene (r=0.79; P=2e-18) and module significance (MS =0.43). Functional enrichment indicated genes in the pink module contributed to the immune system process and extracellular matrix (ECM). In the pink module, ECM2 (GS =0.65, MM =0.86, ρ=0.407, P=0.0019) and GLT8D2 (GS =0.63, MM =0.85, ρ=0.443, P=0.006) were identified as hub genes. For immune cells infiltration in PAH lung tissue, hub genes were positively correlated with M2 macrophages and resting mast cells, and were negatively correlated with monocytes, neutrophils, and CD4-naïve T cells.

Conclusions: Our research identified 2 hub genes ECM2 and GLT8D2 related to PAH. The functions of these hub genes were involved in the immune process and ECM, indicating that they might serve as candidate therapeutic targets for PAH.

Keywords: ECM2; GLT8D2; Pulmonary artery hypertension (PAH); hub gene; weighted gene coexpression network analysis (WGCNA).


Conflict of interest statement

Conflicts of Interest: All authors have completed the ICMJE uniform disclosure form (available at http://dx.doi.org/10.21037/jtd-20-3069). The authors have no conflicts of interest to declare.

Figures

Figure 1
Figure 1
A workflow to summarize the analysis procedure of this study. PAH, pulmonary artery hypertension.
Figure 2
Figure 2
Clustering dendrogram of 82 samples to detect outliers. Color intensity is proportional to sample age, gender, PAH and its subgroup. PAH, pulmonary artery hypertension.
Figure 3
Figure 3
Determination of soft-thresholding power and construction of co-expression modules. (A) Analysis of the scale‐free fit index for various soft‐thresholding powers (β). (B) Analysis of the mean connectivity for various soft‐thresholding powers. (C) Histogram of connectivity distribution when β =5. (D) Checking the scale‐free topology when β =5. The approximate straight-line relationship (high R2 value) shows approximate scale-free topology. (E) Gene clustering dendrogram was obtained by the hierarchical clustering of TOM-based dissimilarity. The color row below the dendrogram indicates module colors. (F) Heatmap plot of the topological overlap matrix among 1000 randomly selected genes. Rows and columns correspond to single genes. Light colors represent higher topological overlap and progressively darker colors represent lower topological overlap. (G) Hierarchical clustering dendrogram and heat map of module eigengenes. Colors represent the intensity of adjacency. TOM, topological overlap measure.
Figure 4
Figure 4
Modules related to clinical trait and functional enrichment. (A) Heatmap of the correlation between module eigengenes and clinical traits. Each cell contains the corresponding correlation coefficient and P value. (B) Bar plot of module significance for PAH. Error bars represent the standard error of GS in each module. (C) Scatterplot of GS for PAH vs. MM in the pink module. (D) Heatmap showed 471 genes in the pink module. Annotation bar represents the subgroups of PAH. PAH, pulmonary artery hypertension.
Figure 5
Figure 5
Identification and validation of hub genes. Scatter plot to visualize the relationship between hub genes ECM2 (A), GLT8D2 (B) and the value of mPAP. Expression levels of hub genes ECM2 (C), GLT8D2 (D) between different PAH subtypes. Kruskal-Wallis H test was used to evaluate the statistical difference. The different letter marks significant difference. Validation of hub genes through independent datasets GSE48149 (E) and GSE113439 (F). Wilcoxon signed-rank test was used to evaluate the statistical significance of differences. mPAP, mean pulmonary artery pressure; PAH, pulmonary artery hypertension.
Figure 6
Figure 6
Functional Enrichment analysis and Immune Cell Fraction Estimation. (A,B) Functional enrichment analysis of genes in the pink module realized by Metascape. (C) Boxplot for comparison of the 22 immune cell infraction difference between PAH and control samples in GSE117261. (D) Heatmap to represent the relationship between hub genes and immune cell infraction calculated by spearman’s correlation. *, P<0.05; **, P<0.01; ***, P<0.001; ****, P<0.0001. PAH, pulmonary artery hypertension.

References

    1. Lau EMT, Giannoulatou E, Celermajer DS, et al. Epidemiology and treatment of pulmonary arterial hypertension. Nat Rev Cardiol 2017;14:603-14. 10.1038/nrcardio.2017.84 - DOI - PubMed
    1. Simonneau G, Montani D, Celermajer DS, et al. Haemodynamic definitions and updated clinical classification of pulmonary hypertension. Eur Respir J 2019;53:1801913. 10.1183/13993003.01913-2018 - DOI - PMC - PubMed
    1. Humbert M, Guignabert C, Bonnet S, et al. Pathology and pathobiology of pulmonary hypertension: state of the art and research perspectives. Eur Respir J 2019;53:1801887. 10.1183/13993003.01887-2018 - DOI - PMC - PubMed
    1. Thenappan T, Ormiston ML, Ryan JJ, et al. Pulmonary arterial hypertension: pathogenesis and clinical management. BMJ 2018;360:j5492. 10.1136/bmj.j5492 - DOI - PMC - PubMed
    1. Southgate L, Machado RD, Graf S, et al. Molecular genetic framework underlying pulmonary arterial hypertension. Nat Rev Cardiol 2020;17:85-95. 10.1038/s41569-019-0242-x - DOI - PubMed