

SMAD4 Expression in Renal Cell Carcinomas Correlates With a Stem-Cell Phenotype and Poor Clinical Outcomes
- PMID: 34012911
- PMCID: PMC8127783
- DOI: 10.3389/fonc.2021.581172
SMAD4 Expression in Renal Cell Carcinomas Correlates With a Stem-Cell Phenotype and Poor Clinical Outcomes
Abstract
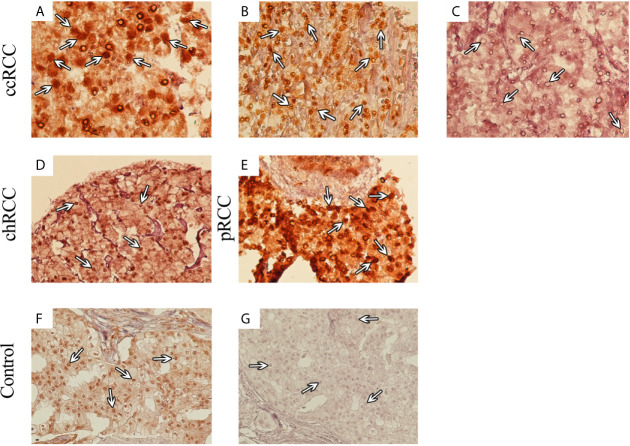
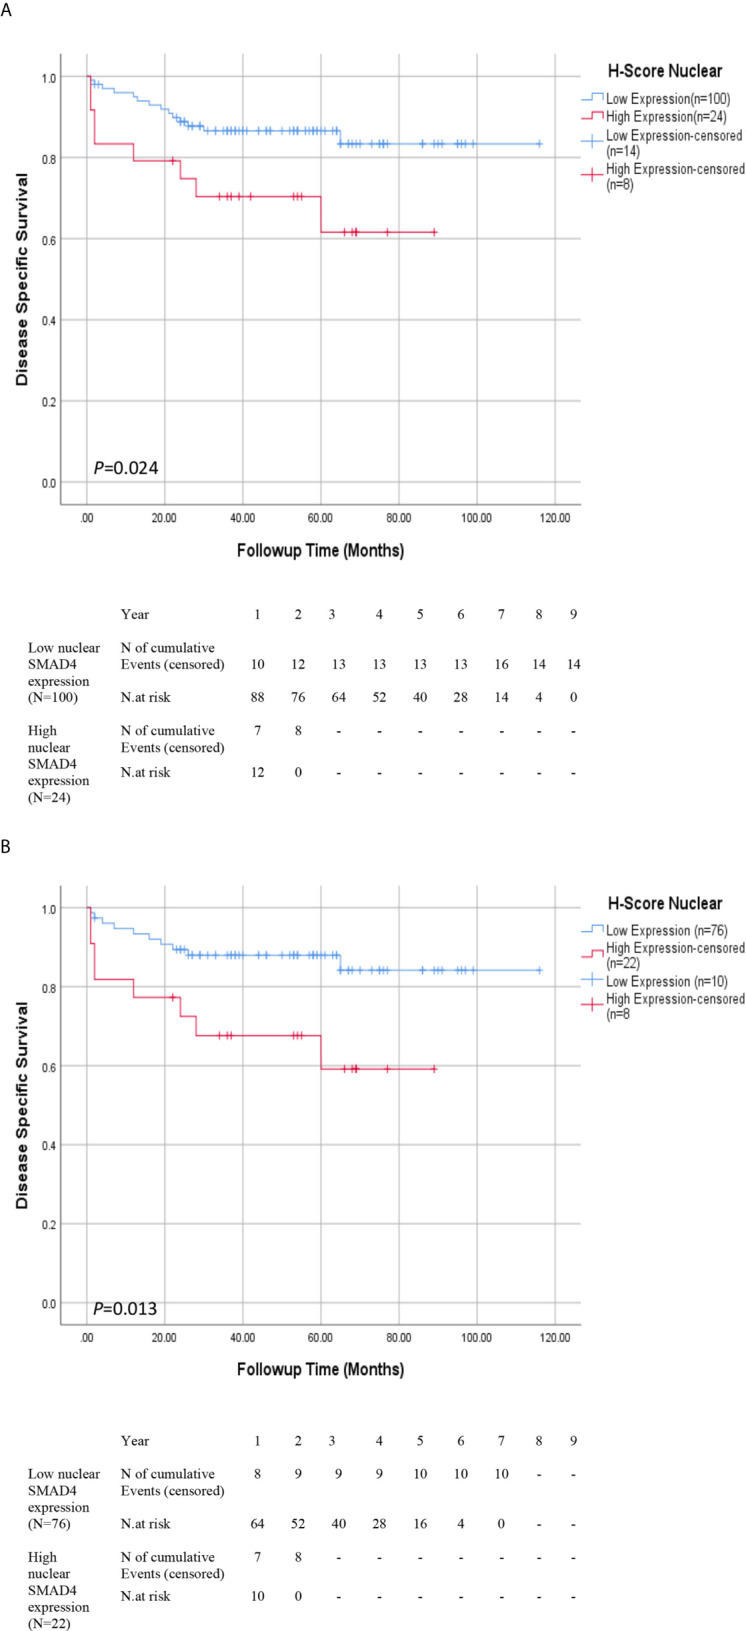
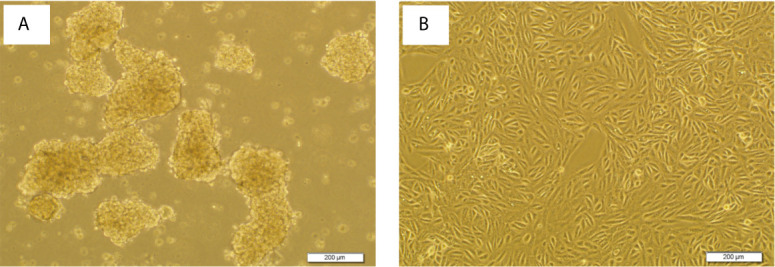
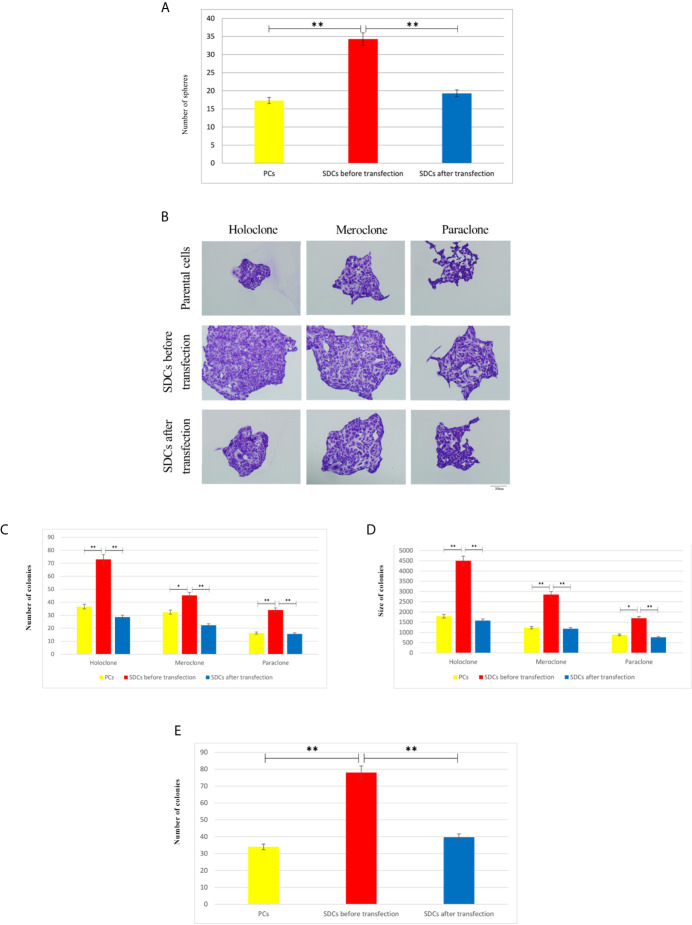
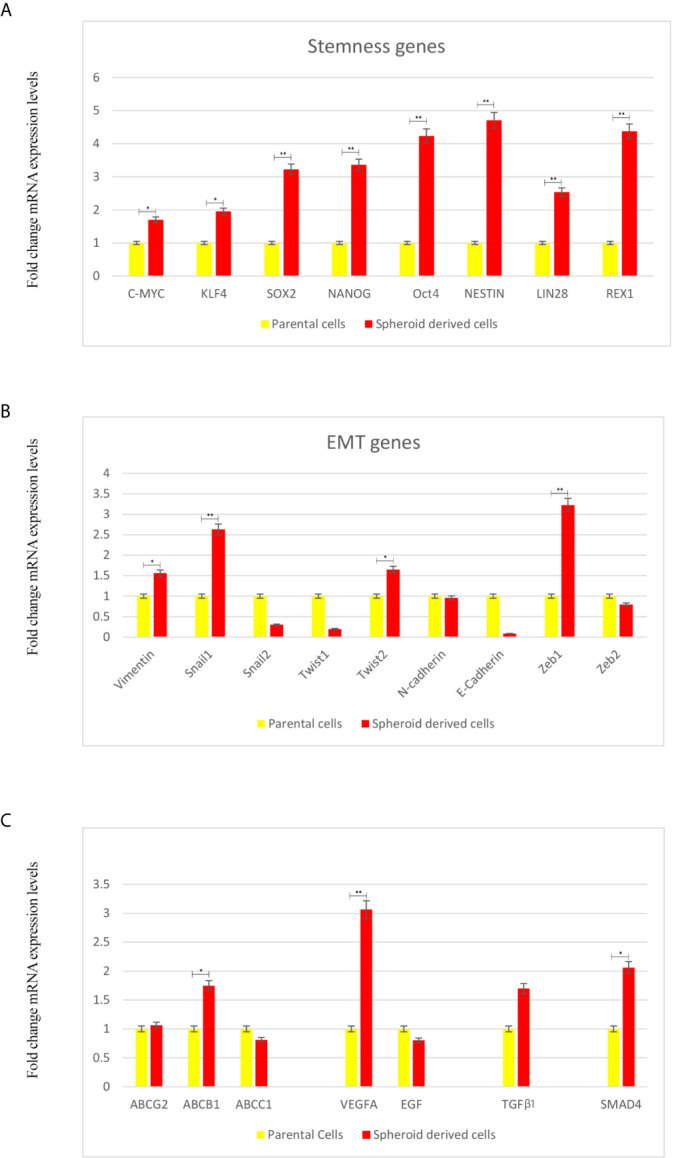
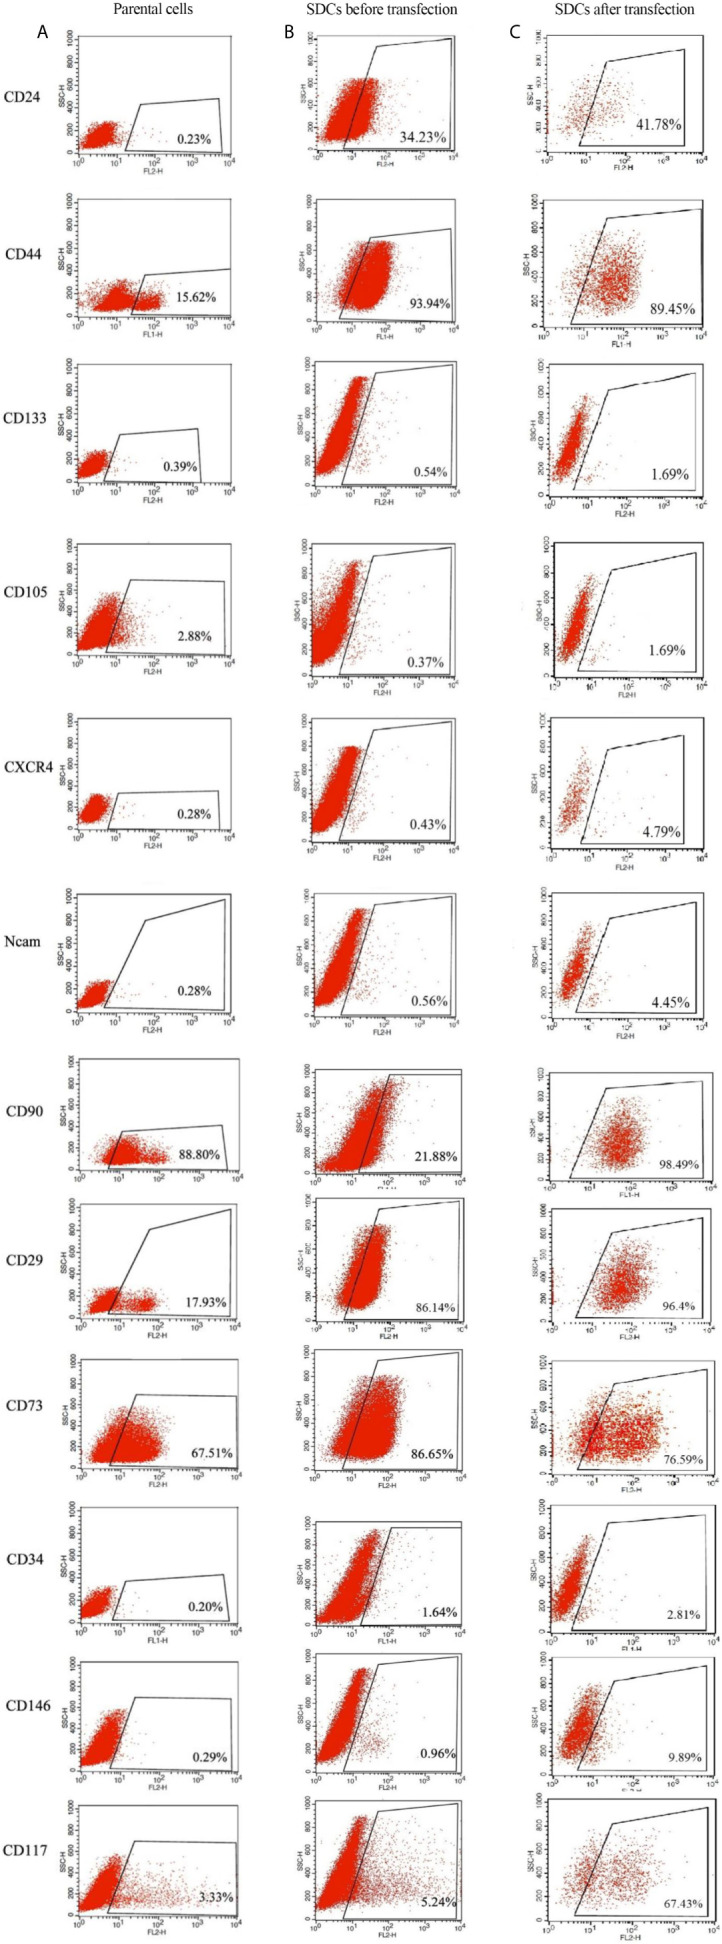
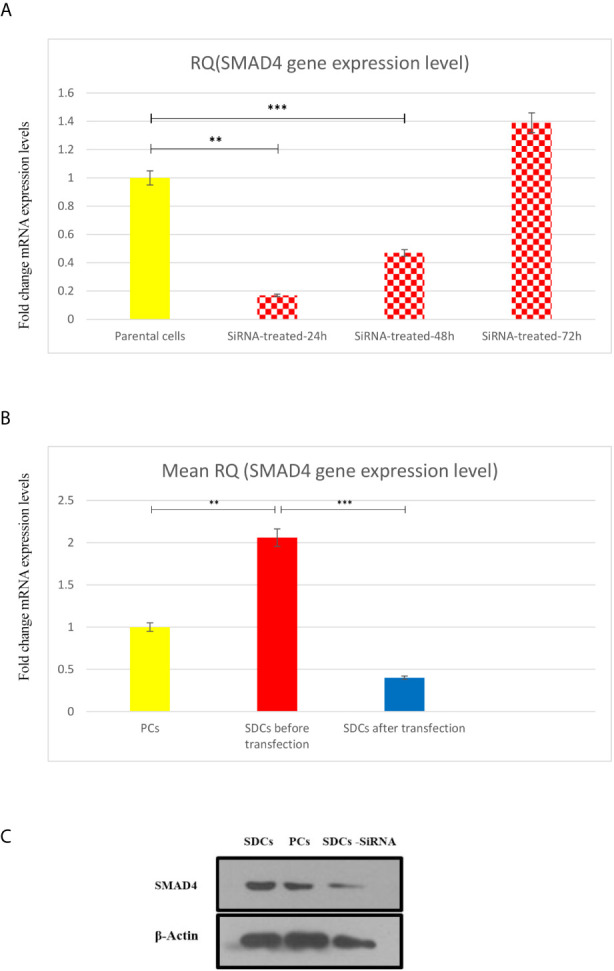
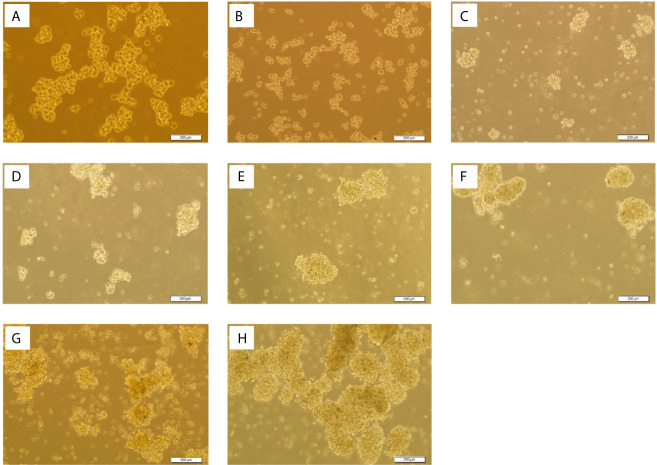
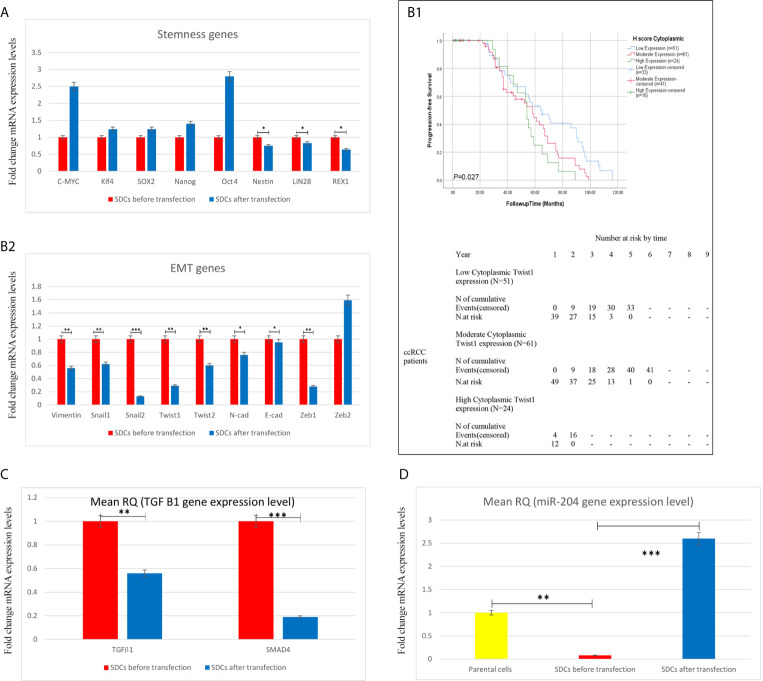
Renal cell carcinoma (RCC) is the most lethal neoplasm of common urologic cancers with poor prognoses. SMAD4 has a principal role in TGF-β (Transformis growth factorβ)-induced epithelial to mesenchymal transition (EMT) as a key factor in gaining cancer stem cell (CSC) features and tumor aggressiveness. This study aimed to evaluate the expression patterns and clinical significance of SMAD4 in RCC and the impact of its targeting on stem cell/mesenchymal cells and EMT characteristics in renal spheroid derived cells (SDCs) compared to parental cells (PCs) in RCC. The expression pattern and clinical significance of SMAD4 was evaluated in RCC. SDCs were enriched using a sphere culture system. Then SDCs and their PCs were compared with respect to their sphere and colony formation, expression of putative CSC markers, invasiveness as well as expression of genes, including stemness/mesenchymal, SMAD4 and TGFβ1genes. Finally, the effect of SMAD4 knockdown on SDCs was analyzed. We demonstrated that SMAD4 is positively correlated with decreased disease specific survival (DSS) in RCC patients and clear cell RCC (ccRCC) subtype and associates with poor DSS in patients with RCC, especially in ccRCC as the most metastatic RCC subtype. SDCs exhibited higher stem cell/mesenchymal properties. Inhibition of SMAD4 in PCs accelerated the dissociation of SDCs and decreased their clonogenicity, invasiveness, expression of mesenchymal markers and expression of SMAD4 and TGFβ1 genes compared to SDCs before transfection. We suggest that targeting SMAD4 may be useful against renal CSCs and may improve RCC prognosis.
Keywords: TGFβ signaling pathway; cancer stem cells; epithelial to mesenchymal transition; renal cancer; targeting.
Copyright © 2021 Rasti, Madjd, Saeednejad Zanjani, Babashah, Abolhasani, Asgari and Mehrazma.
Conflict of interest statement
The authors declare that the research was conducted in the absence of any commercial or financial relationships that could be construed as a potential conflict of interest.
Figures
Similar articles
-
Spheroid-Derived Cells From Renal Adenocarcinoma Have Low Telomerase Activity and High Stem-Like and Invasive Characteristics.Front Oncol. 2019 Dec 4;9:1302. doi: 10.3389/fonc.2019.01302. eCollection 2019. Front Oncol. 2019. PMID: 31921617 Free PMC article.
-
Jagged-1 is induced by mTOR inhibitors in renal cancer cells through an Akt/ALK5/Smad4-dependent mechanism.Curr Res Pharmacol Drug Discov. 2022 Jul 4;3:100117. doi: 10.1016/j.crphar.2022.100117. eCollection 2022. Curr Res Pharmacol Drug Discov. 2022. PMID: 35992379 Free PMC article.
-
Valproic acid inhibits epithelial‑mesenchymal transition in renal cell carcinoma by decreasing SMAD4 expression.Mol Med Rep. 2017 Nov;16(5):6190-6199. doi: 10.3892/mmr.2017.7394. Epub 2017 Aug 29. Mol Med Rep. 2017. PMID: 28901475
-
The Role of Hypoxia and Cancer Stem Cells in Renal Cell Carcinoma Pathogenesis.Stem Cell Rev Rep. 2015 Dec;11(6):919-43. doi: 10.1007/s12015-015-9611-y. Stem Cell Rev Rep. 2015. PMID: 26210994 Free PMC article. Review.
-
c-Met expression in renal cell carcinoma with bone metastases.J Bone Oncol. 2020 Sep 16;25:100315. doi: 10.1016/j.jbo.2020.100315. eCollection 2020 Dec. J Bone Oncol. 2020. PMID: 33024658 Free PMC article. Review.
Cited by
-
Renal Cell Carcinoma as a Metabolic Disease: An Update on Main Pathways, Potential Biomarkers, and Therapeutic Targets.Int J Mol Sci. 2022 Nov 18;23(22):14360. doi: 10.3390/ijms232214360. Int J Mol Sci. 2022. PMID: 36430837 Free PMC article. Review.
-
SMAD4 contributes to chondrocyte and osteocyte development.J Cell Mol Med. 2022 Jan;26(1):1-15. doi: 10.1111/jcmm.17080. Epub 2021 Nov 28. J Cell Mol Med. 2022. PMID: 34841647 Free PMC article. Review.
-
New insights into fibrotic signaling in renal cell carcinoma.Front Cell Dev Biol. 2023 Feb 21;11:1056964. doi: 10.3389/fcell.2023.1056964. eCollection 2023. Front Cell Dev Biol. 2023. PMID: 36910160 Free PMC article. Review.
References
LinkOut - more resources
Full Text Sources
Other Literature Sources
Miscellaneous