

An Exploration of the Tumor Microenvironment Identified a Novel Five-Gene Model for Predicting Outcomes in Bladder Cancer
- PMID: 34012914
- PMCID: PMC8126988
- DOI: 10.3389/fonc.2021.642527
An Exploration of the Tumor Microenvironment Identified a Novel Five-Gene Model for Predicting Outcomes in Bladder Cancer
Abstract
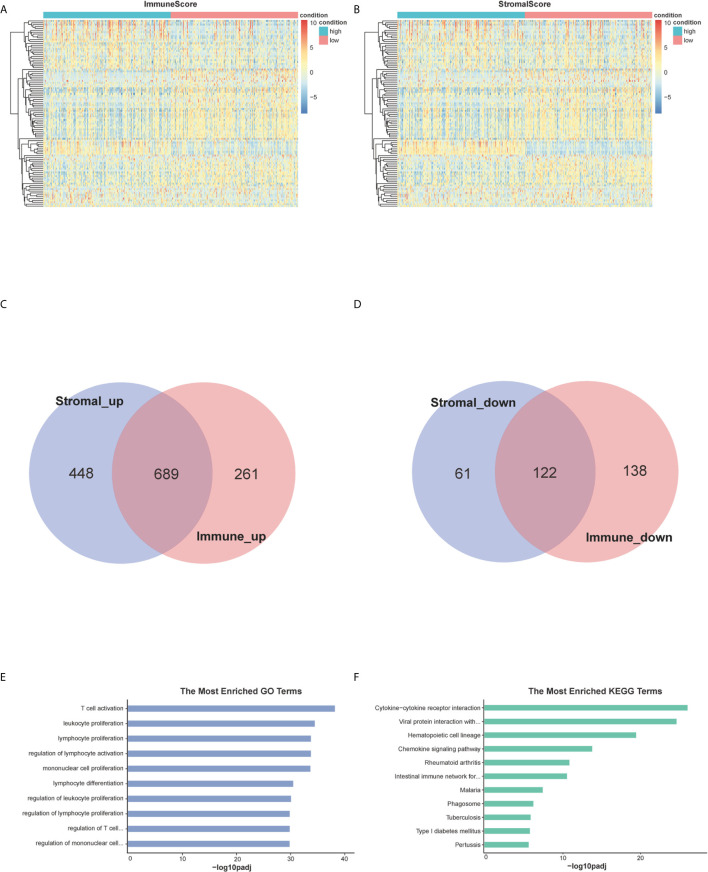
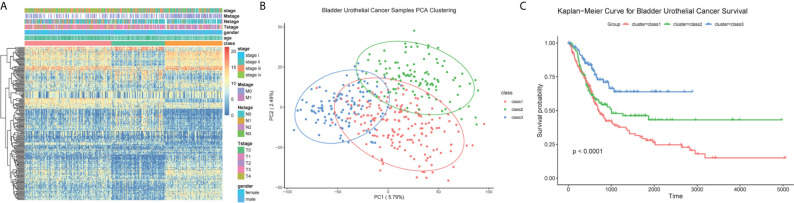
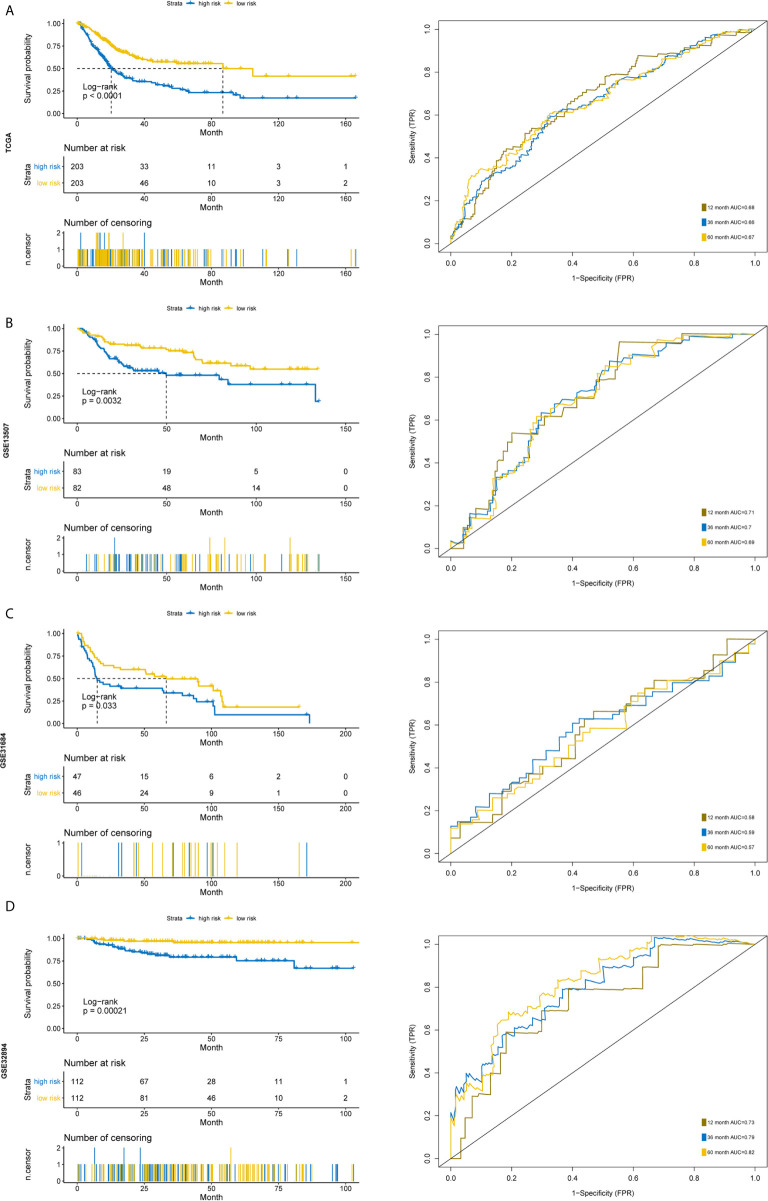
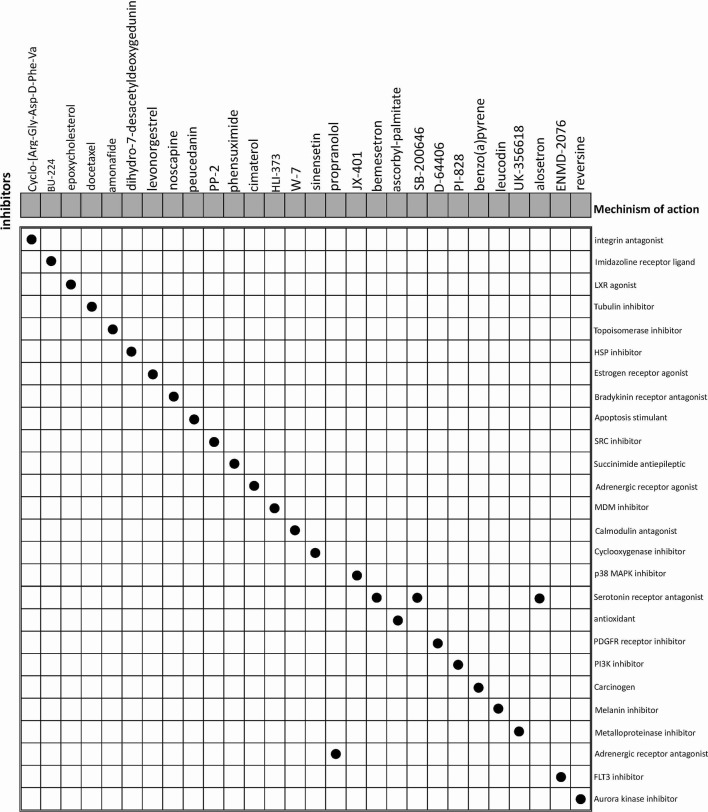
Bladder cancer (BC) is one of the top ten most common cancer types globally, accounting for approximately 7% of all male malignancies. In the last few decades, cancer research has focused on identifying oncogenes and tumor suppressors. Recent studies have revealed that the interplay between tumor cells and the tumor microenvironment (TME) plays an important role in the initiation and development of cancer. However, the current knowledge regarding its effect on BC is scarce. This study aims to explore how the TME influences the development of BC. We focused on immune and stromal components, which represent the major components of TME. We found that the proportion of immune and stromal components within the TME was associated with the prognosis of BC. Furthermore, based on the scores of immune and stromal components, 811 TME-related differentially expressed genes were identified. Three subclasses with distinct biological features were divided based on these TME-genes. Finally, five prognostic genes were identified and used to develop a prognostic prediction model for BC patients based on TME-related genes. Additionally, we validated the prognostic value of the five-gene model using three independent cohorts. By further analyzing features based on the five-gene signature, higher CD8+ T cells, higher tumor mutational burden, and higher chemosensitivity were found in the low-risk group, which presented a better prognosis. In conclusion, our exploration comprehensively analyzed the TME and identified TME-related prognostic genes for BC, providing new insights into potential therapeutic targets.
Keywords: bladder cancer; immune infiltration; prognosis; stroma; tumor microenvironment.
Copyright © 2021 Li, Feng, Sun and Li.
Conflict of interest statement
The authors declare that the research was conducted in the absence of any commercial or financial relationships that could be construed as a potential conflict of interest.
Figures


Similar articles
-
Prognostic Value of Immune-Related Genes in the Tumor Microenvironment of Bladder Cancer.Front Oncol. 2020 Jul 28;10:1302. doi: 10.3389/fonc.2020.01302. eCollection 2020. Front Oncol. 2020. PMID: 32850407 Free PMC article.
-
Profiles of tumor-infiltrating immune cells and prognostic genes associated with the microenvironment of bladder cancer.Int Immunopharmacol. 2020 Aug;85:106641. doi: 10.1016/j.intimp.2020.106641. Epub 2020 May 26. Int Immunopharmacol. 2020. PMID: 32470882
-
Immune-Stromal Score Signature: Novel Prognostic Tool of the Tumor Microenvironment in Lung Adenocarcinoma.Front Oncol. 2020 Sep 23;10:541330. doi: 10.3389/fonc.2020.541330. eCollection 2020. Front Oncol. 2020. PMID: 33072571 Free PMC article.
-
Research Progress on the Role of Regulatory T Cell in Tumor Microenvironment in the Treatment of Breast Cancer.Front Oncol. 2021 Nov 15;11:766248. doi: 10.3389/fonc.2021.766248. eCollection 2021. Front Oncol. 2021. PMID: 34868991 Free PMC article. Review.
-
The colorectal cancer microenvironment: Preclinical progress in identifying targets for cancer therapy.Transl Oncol. 2025 Mar;53:102307. doi: 10.1016/j.tranon.2025.102307. Epub 2025 Feb 3. Transl Oncol. 2025. PMID: 39904281 Free PMC article. Review.
Cited by
-
Identification of a Novel Tumor Microenvironment Prognostic Signature for Bladder Urothelial Carcinoma.Front Oncol. 2022 Mar 1;12:818860. doi: 10.3389/fonc.2022.818860. eCollection 2022. Front Oncol. 2022. PMID: 35299749 Free PMC article.
-
Alternative splicing regulation and its therapeutic potential in bladder cancer.Front Oncol. 2024 Jul 26;14:1402350. doi: 10.3389/fonc.2024.1402350. eCollection 2024. Front Oncol. 2024. PMID: 39132499 Free PMC article. Review.
References
LinkOut - more resources
Full Text Sources
Other Literature Sources
Research Materials