. 2021 Apr 20:36:107050.
doi: 10.1016/j.dib.2021.107050. eCollection 2021 Jun.

The proteomic data of liver in mice with hyperlipidemia

Affiliations

The proteomic data of liver in mice with hyperlipidemia

Pingping Song et al. Data Brief. .

Abstract

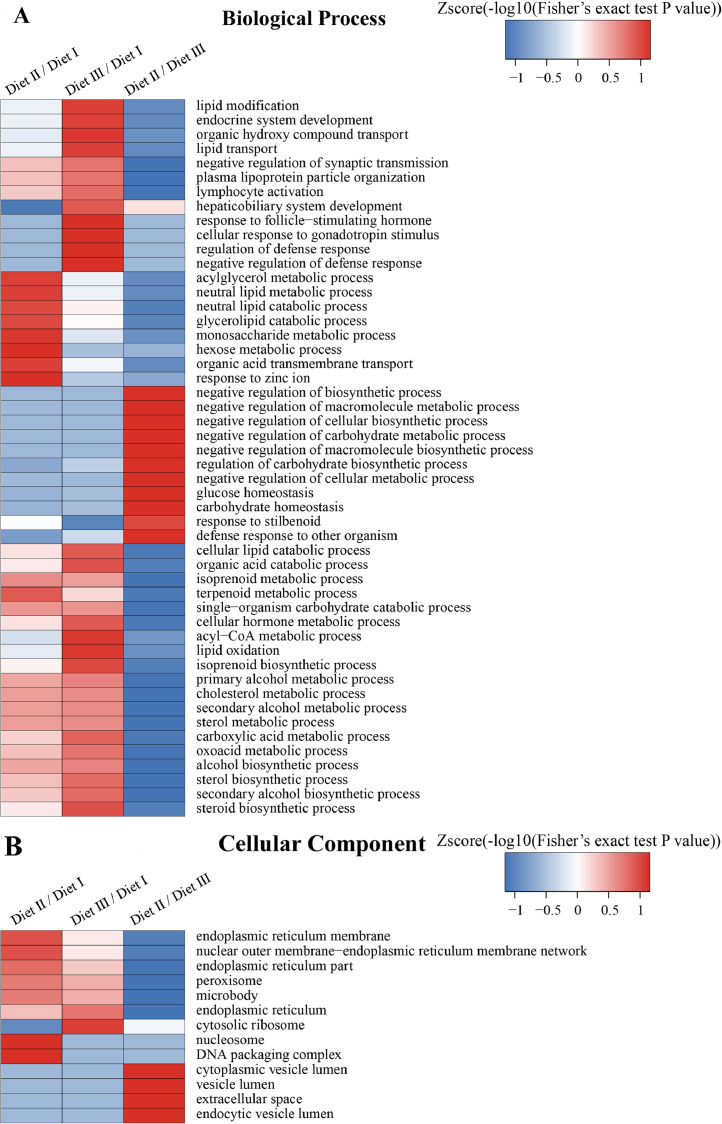
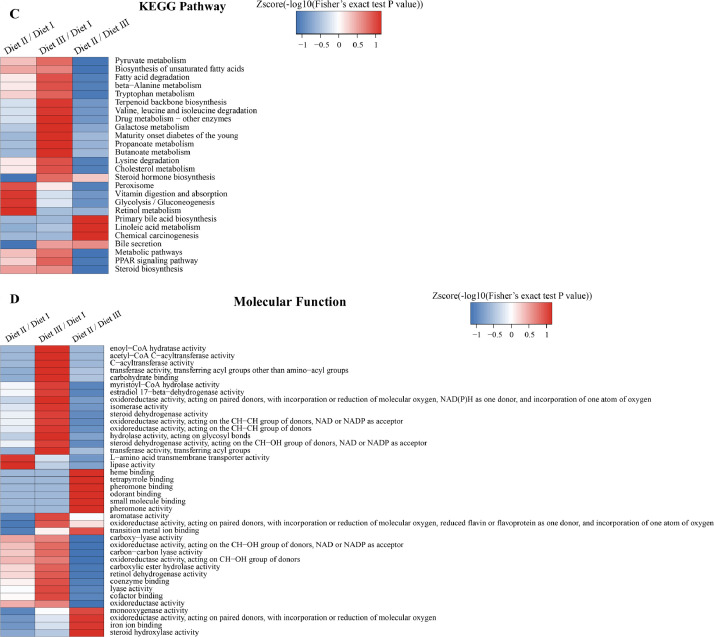
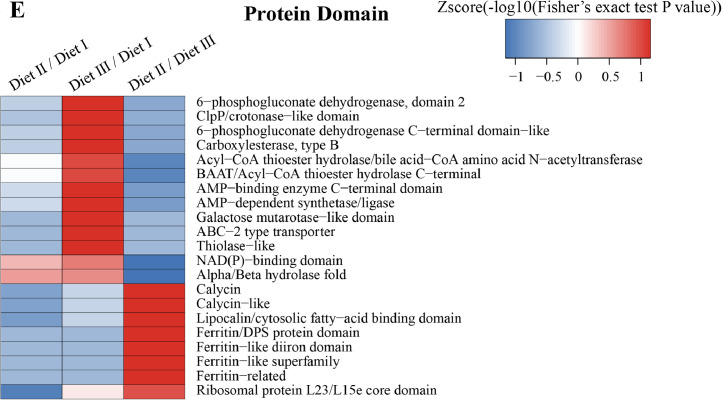
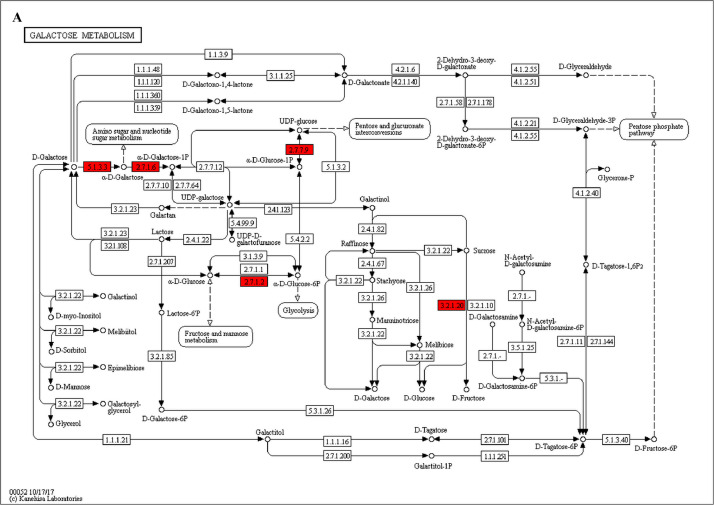
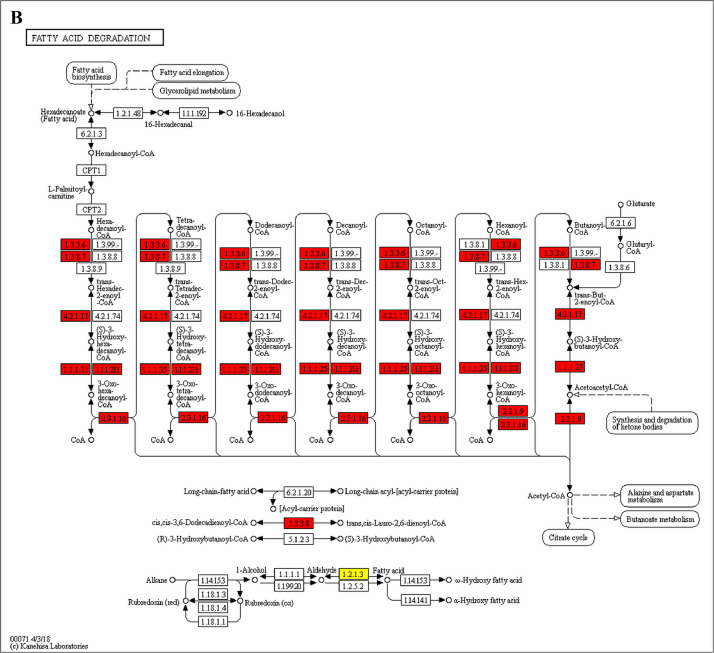
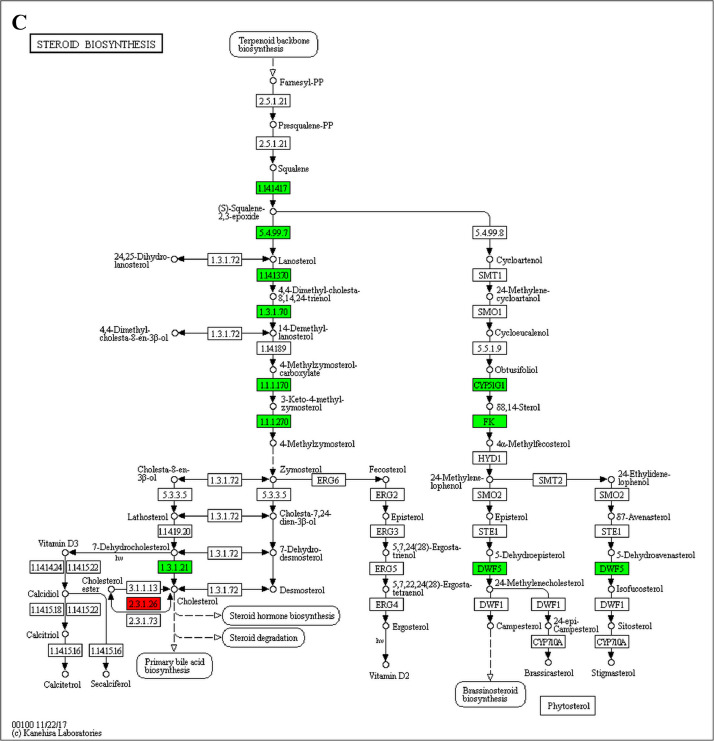
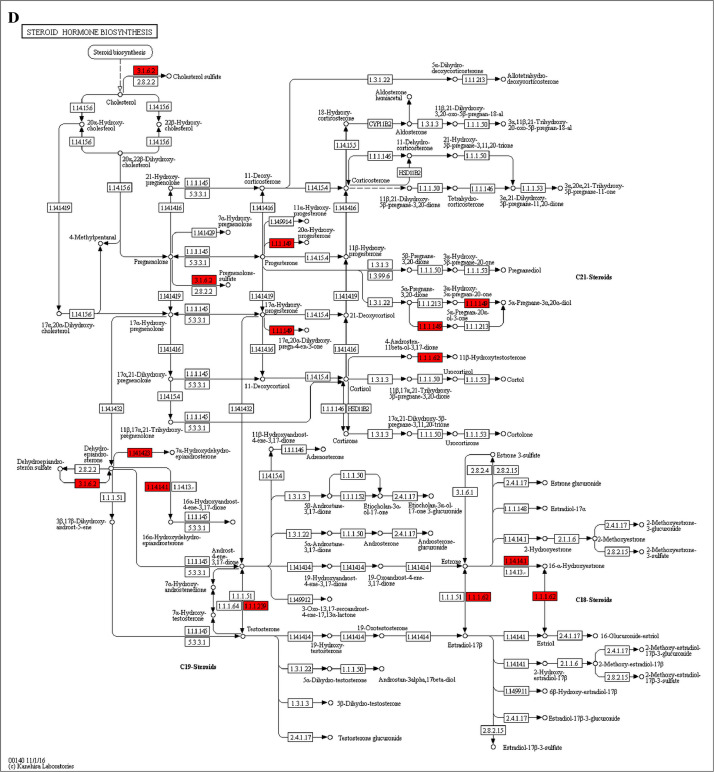
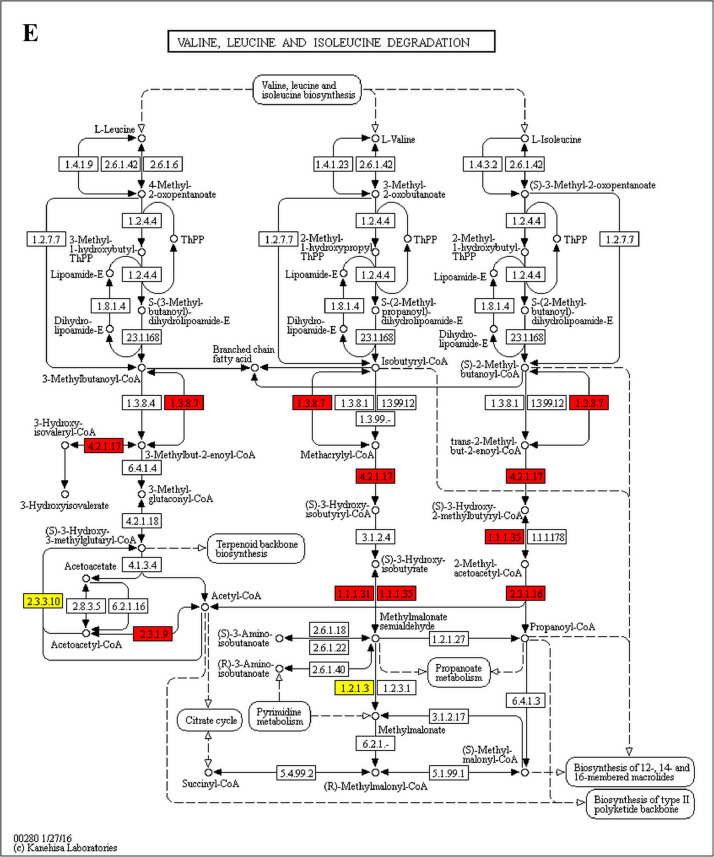
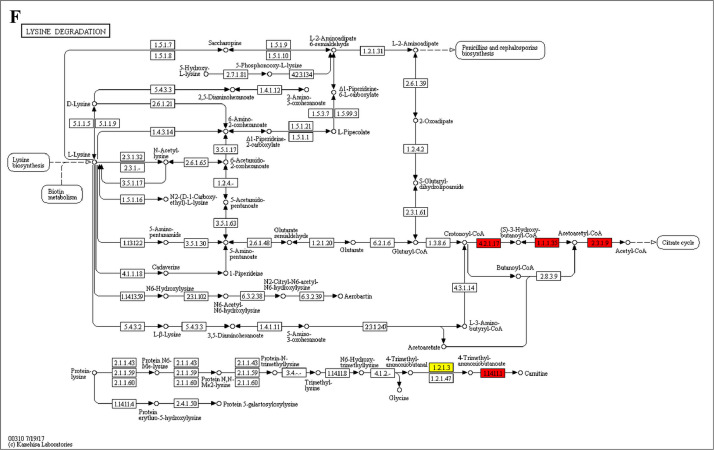
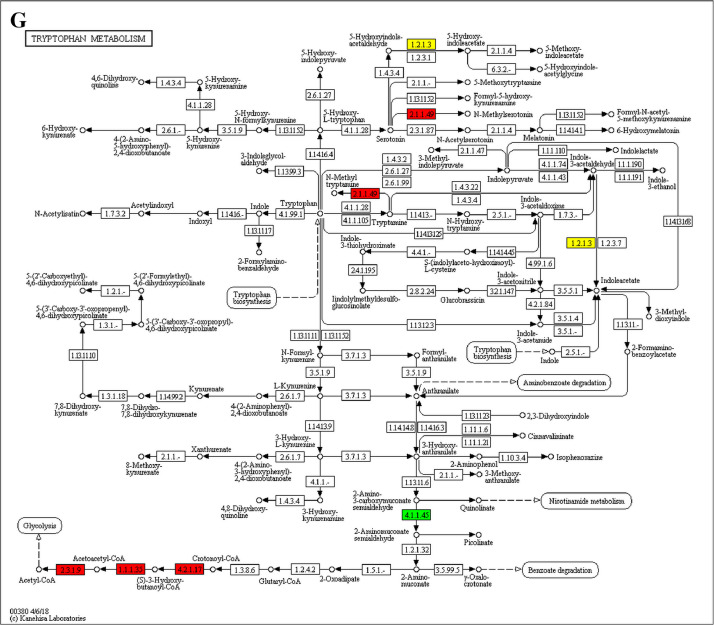
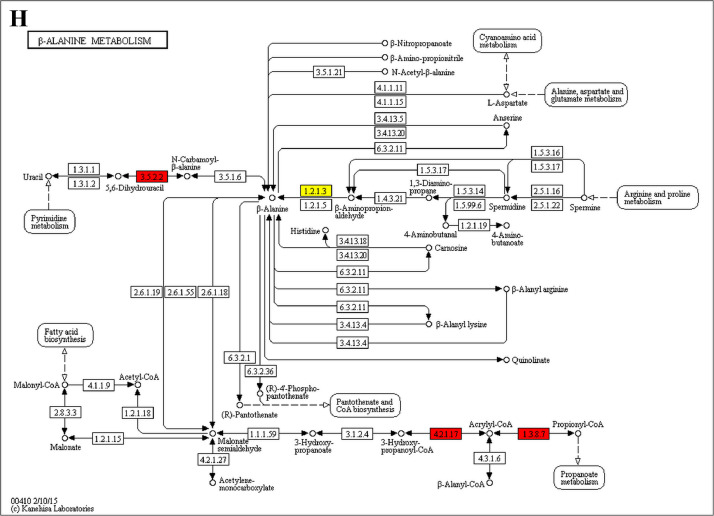
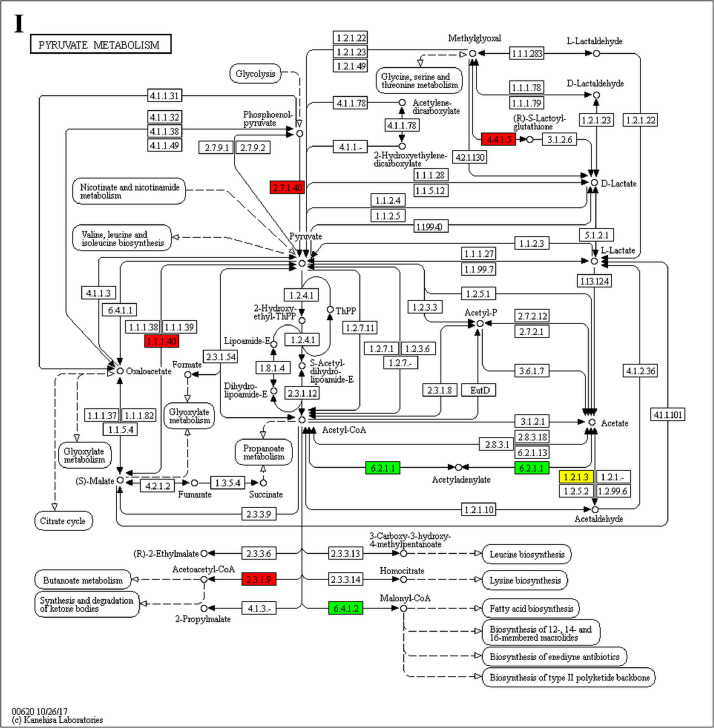
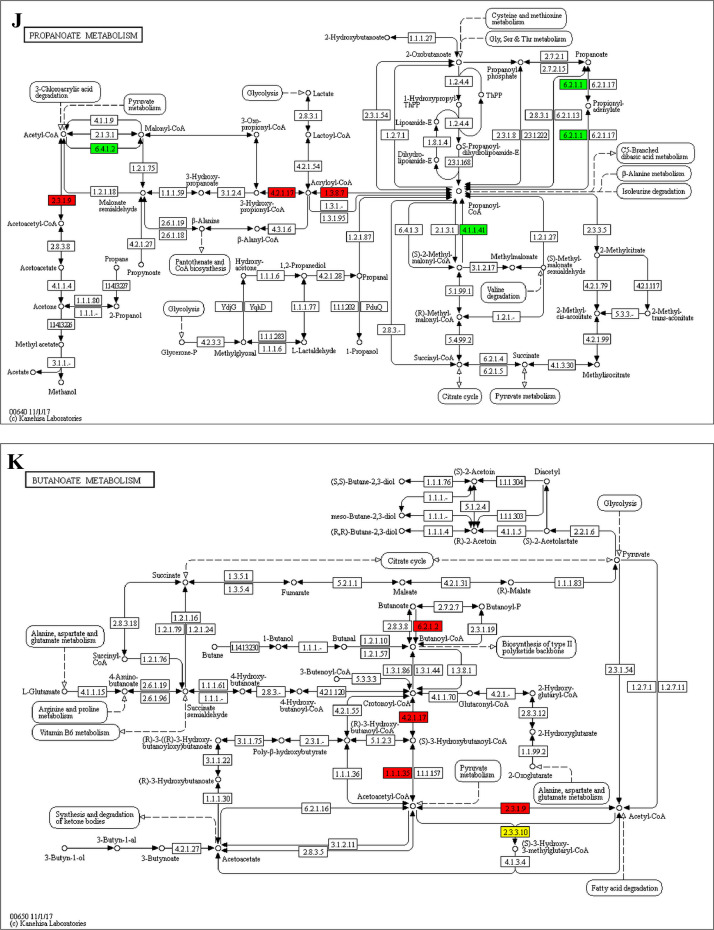
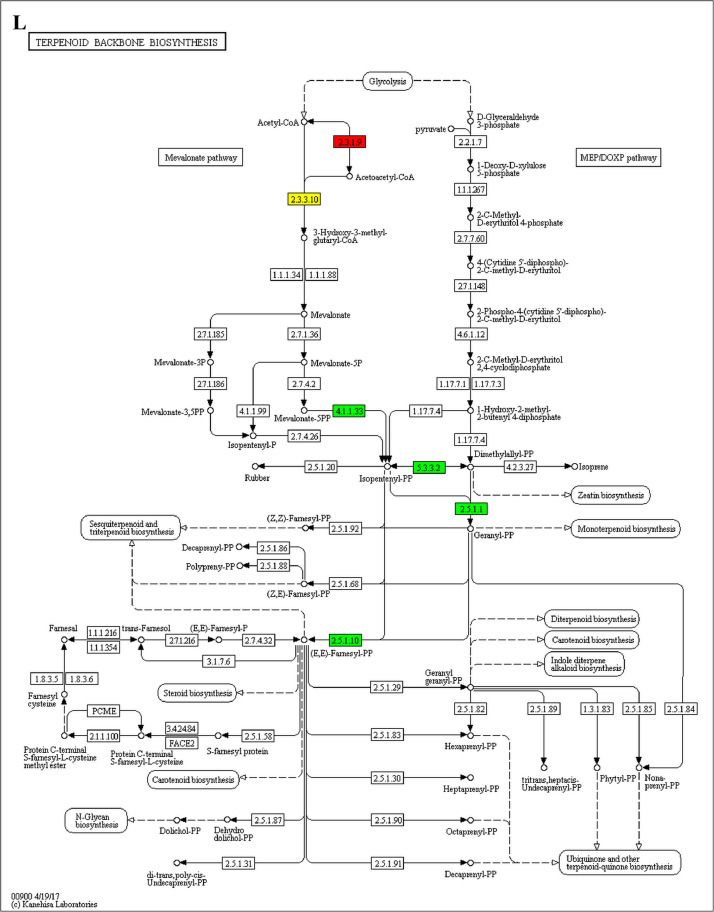
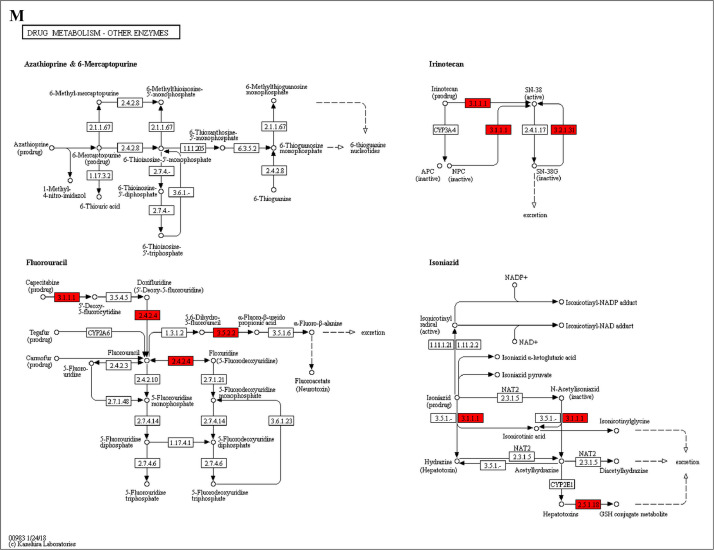
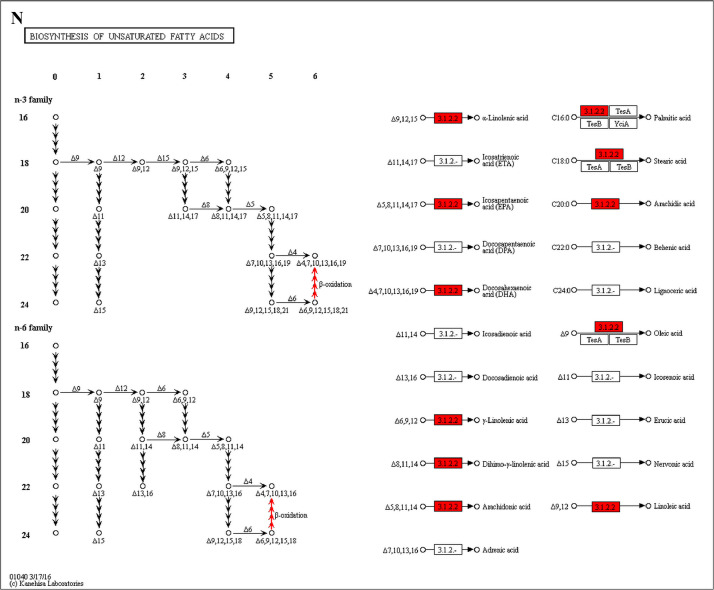
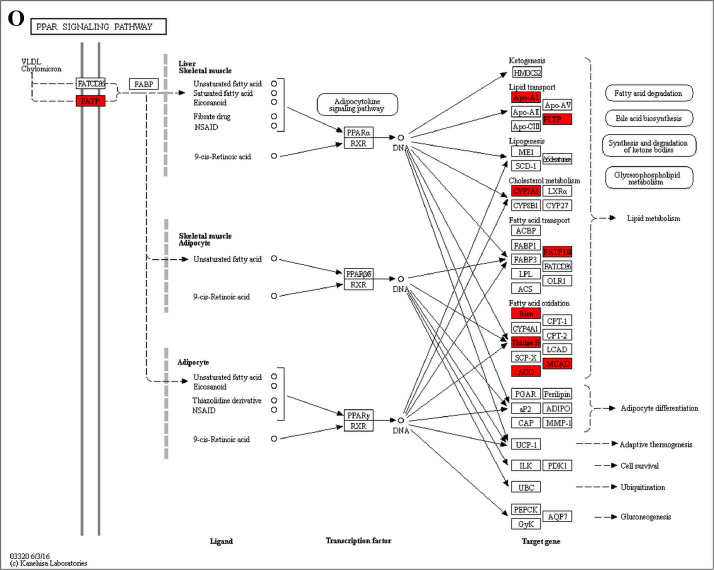
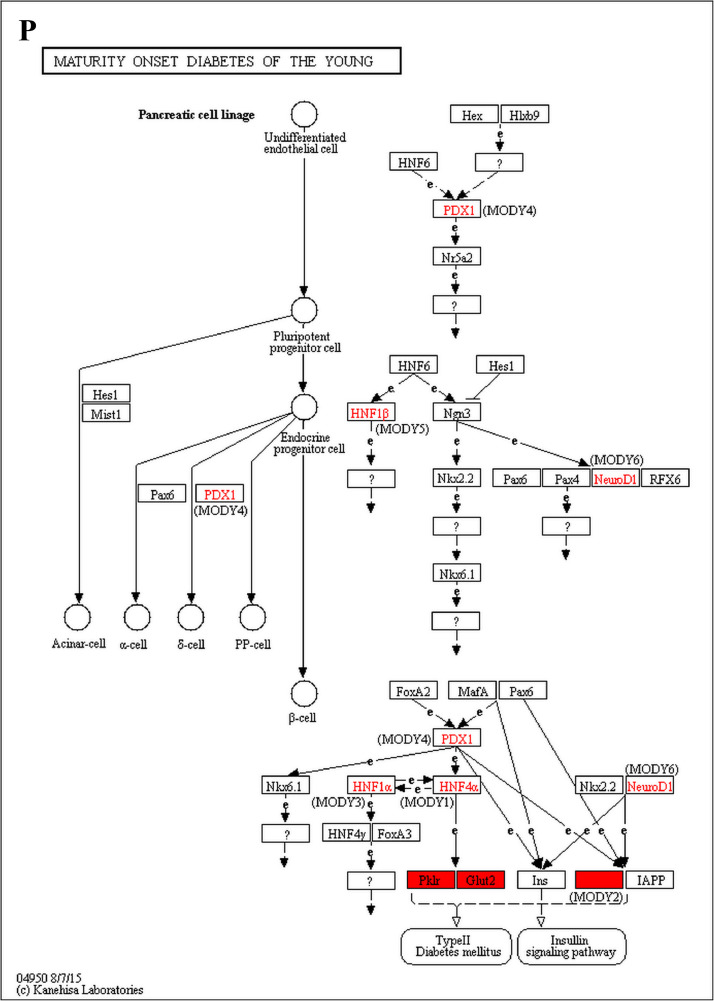
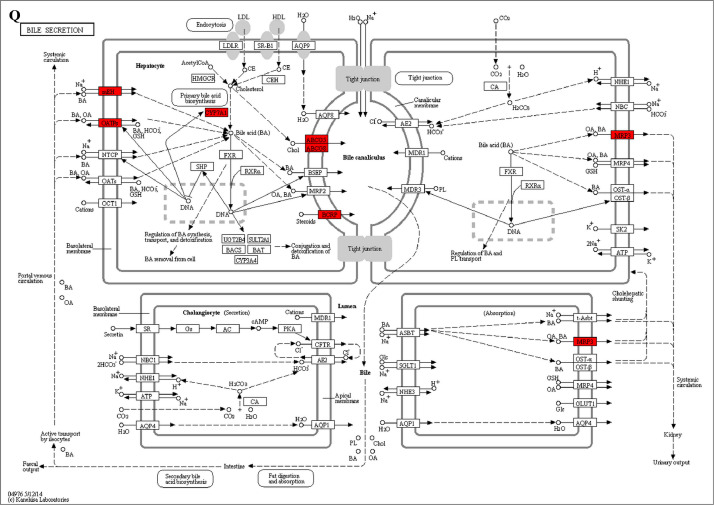
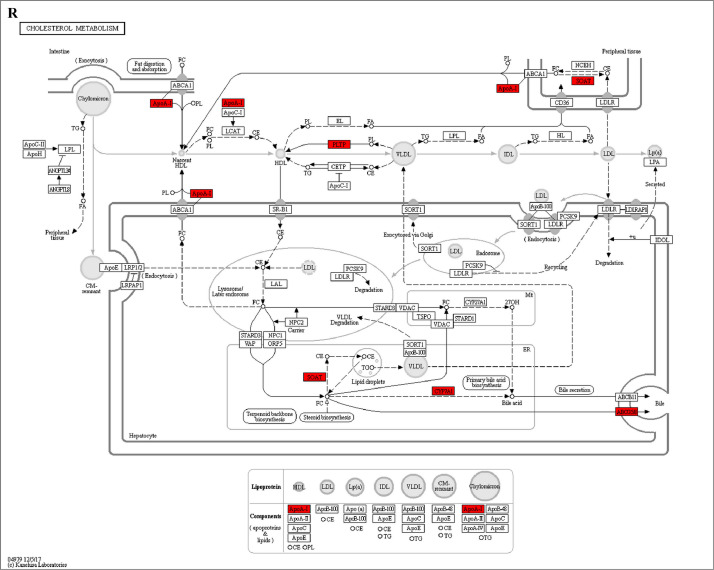
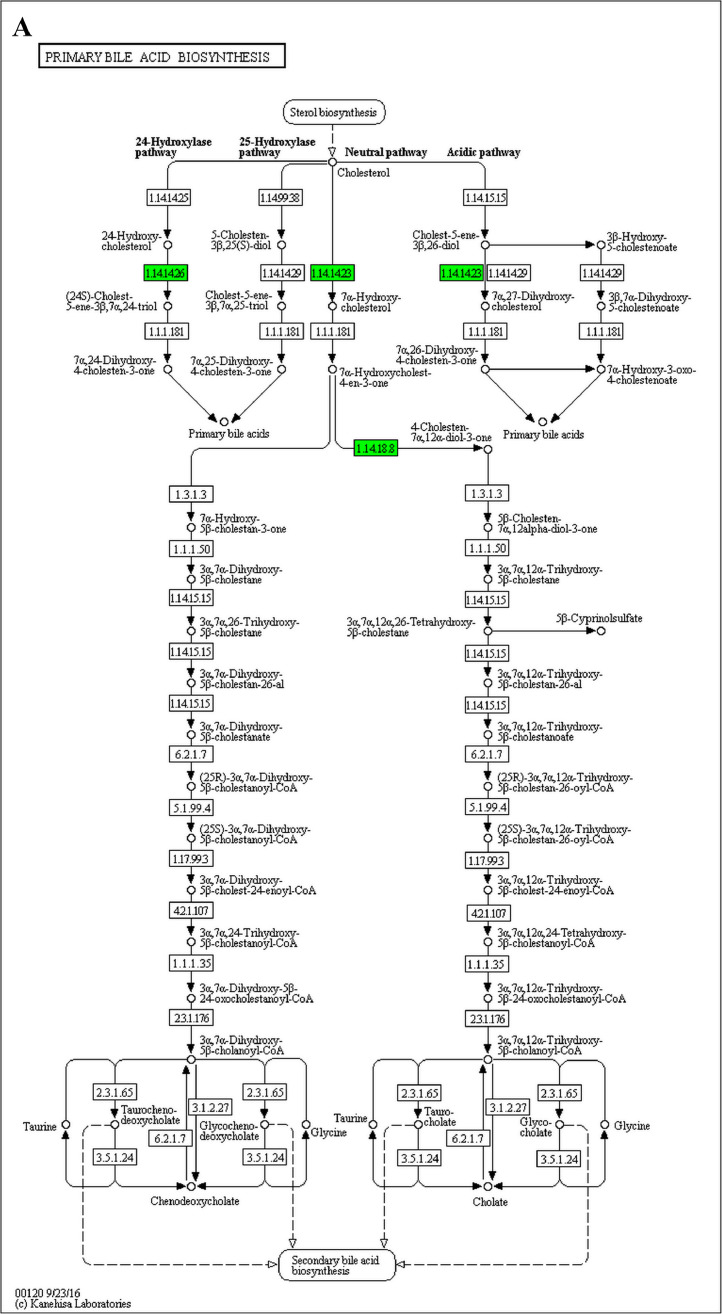
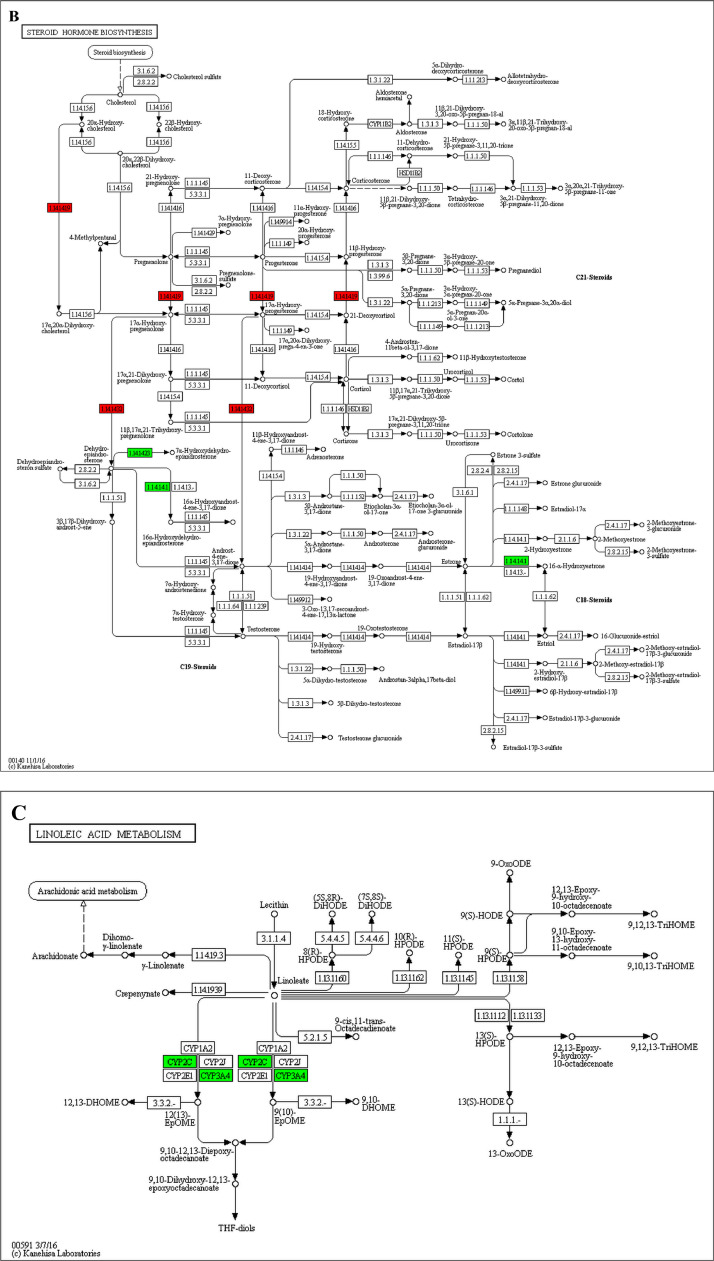
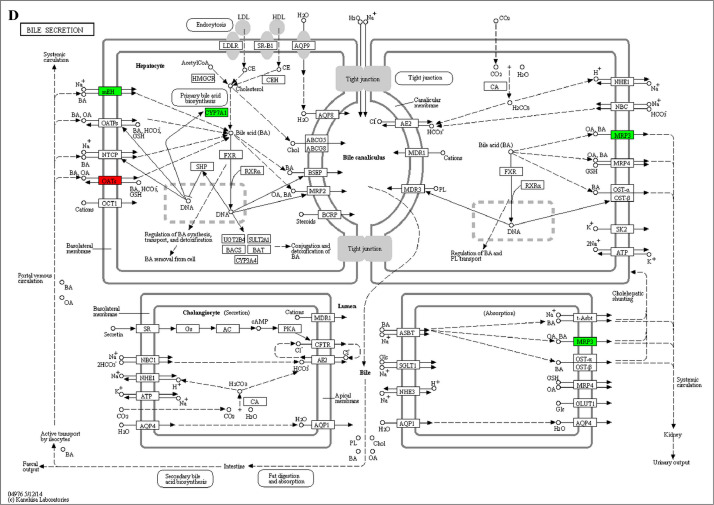
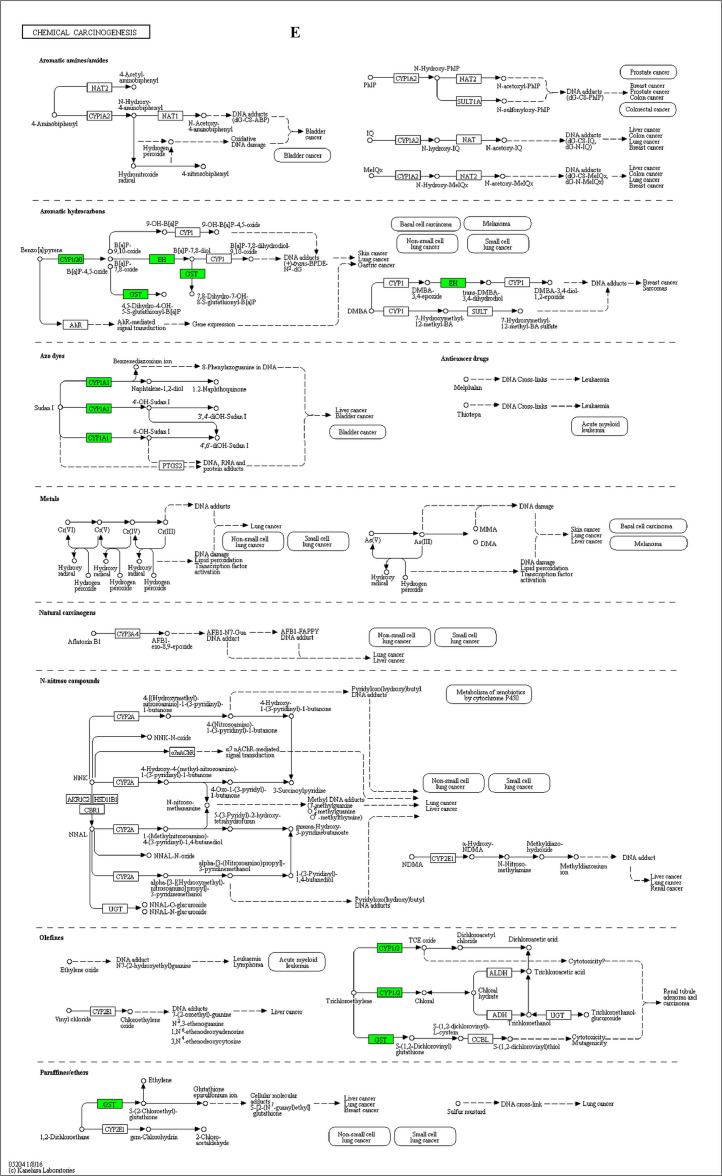
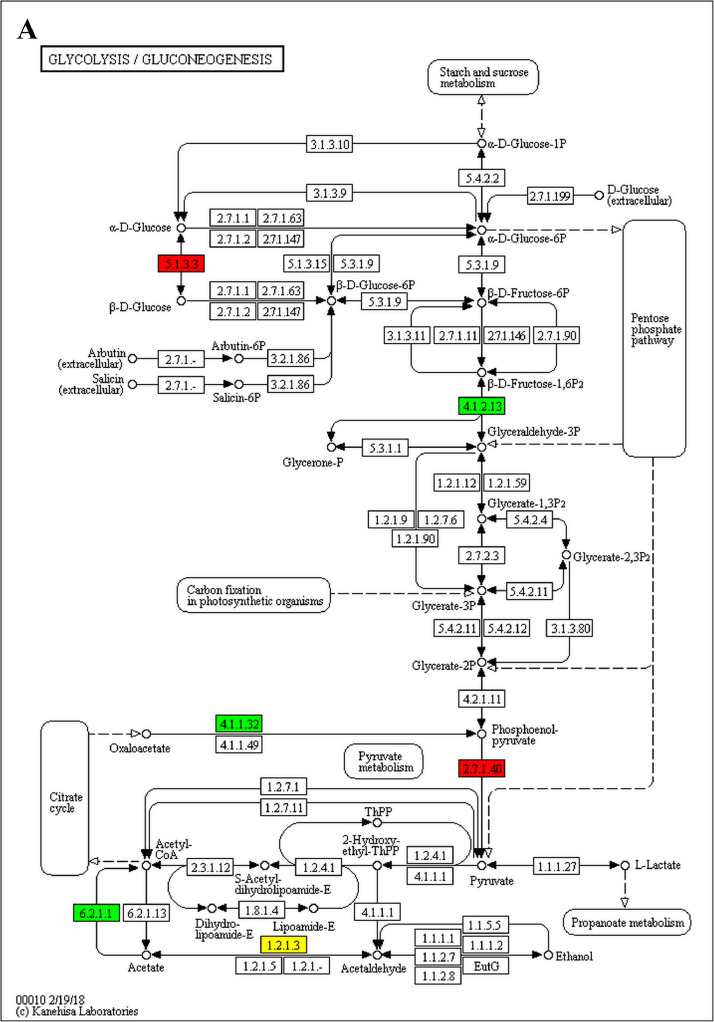
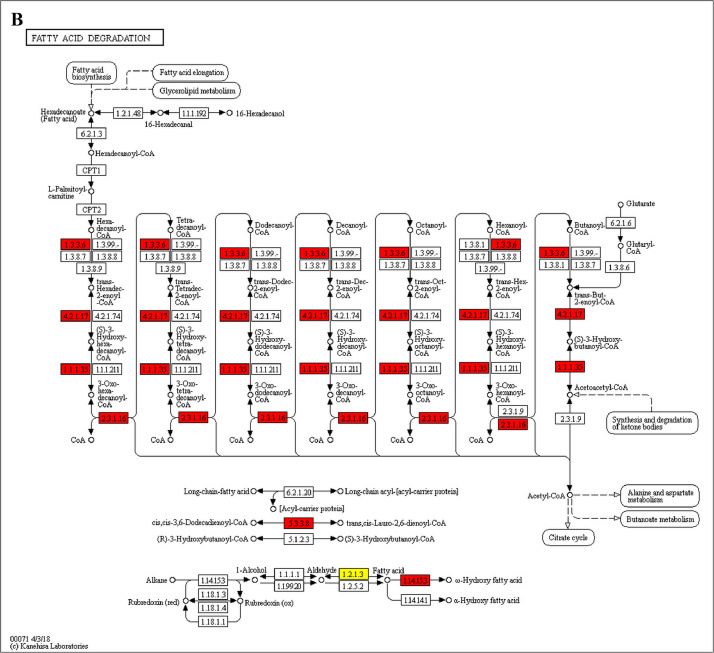
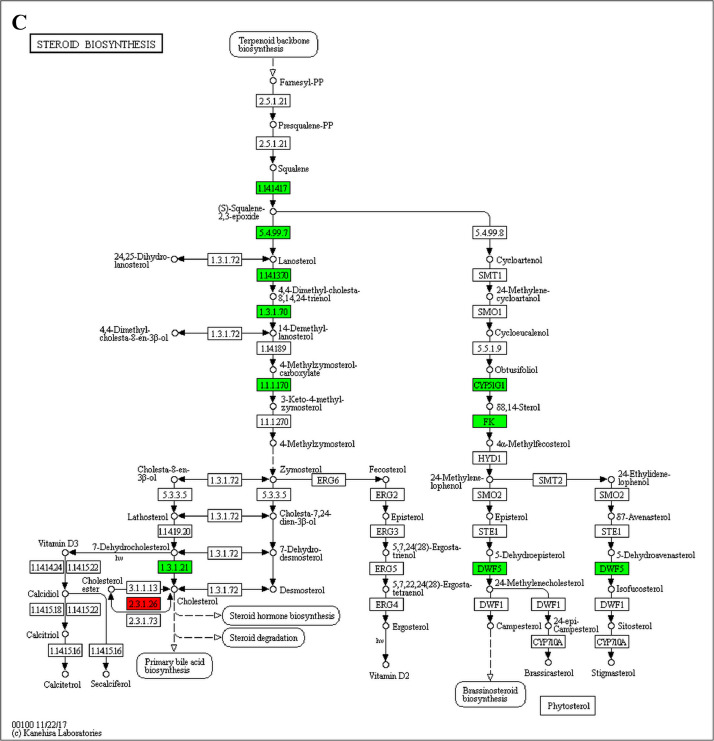
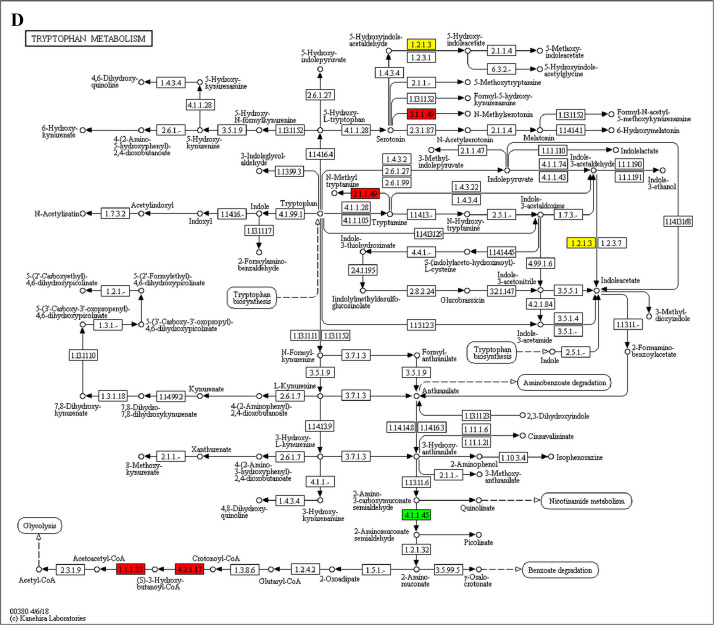
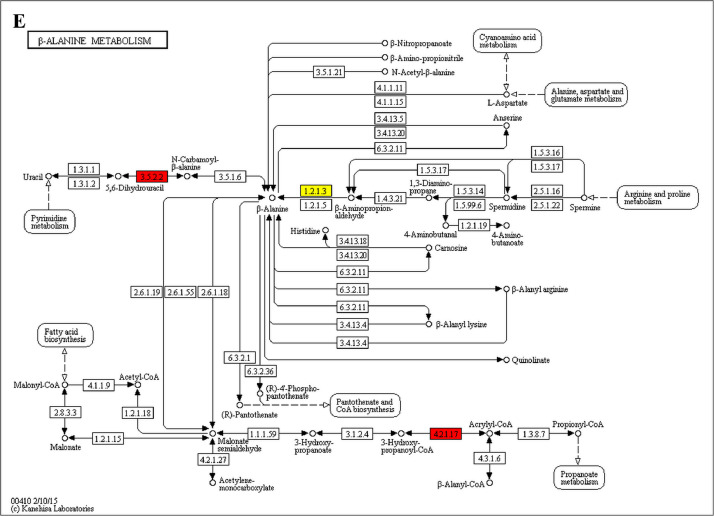
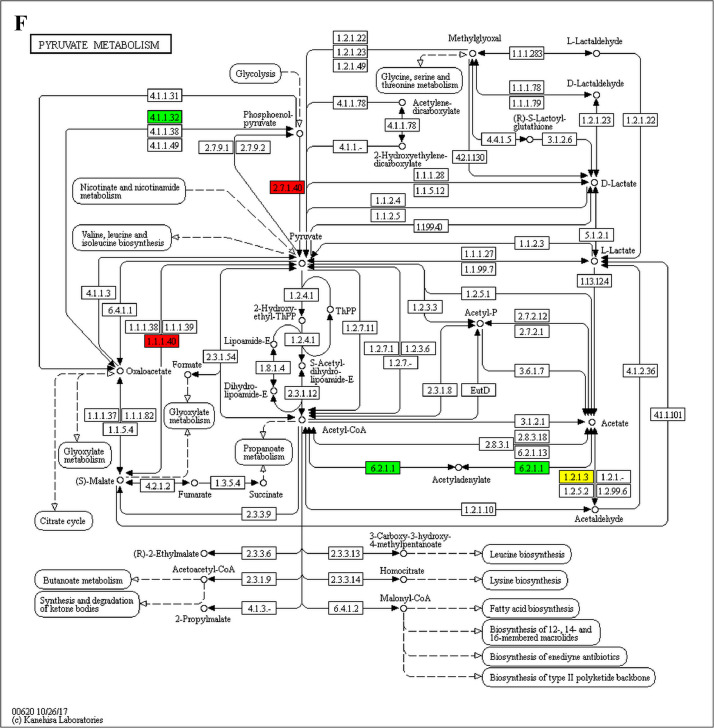
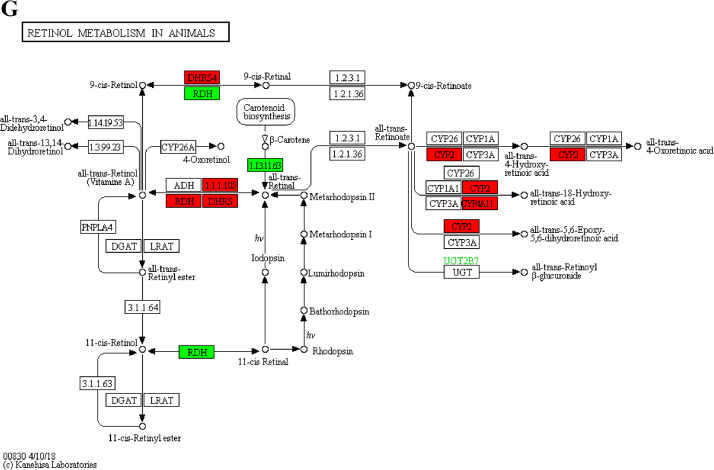
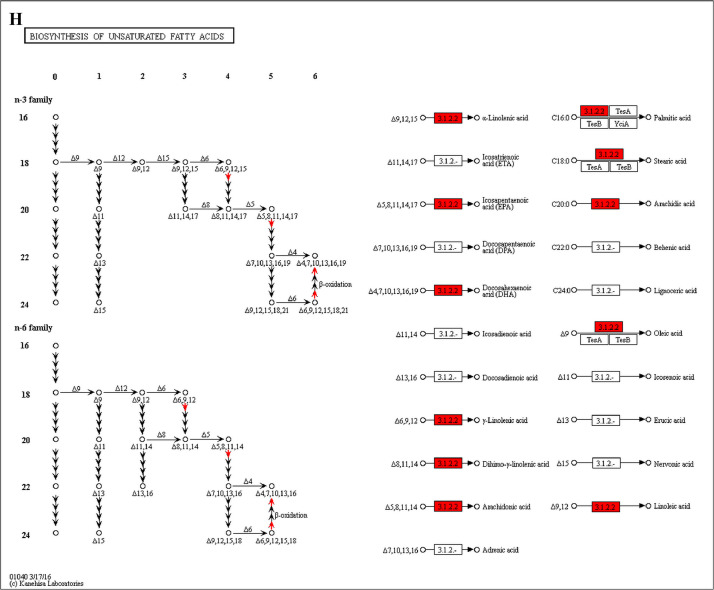
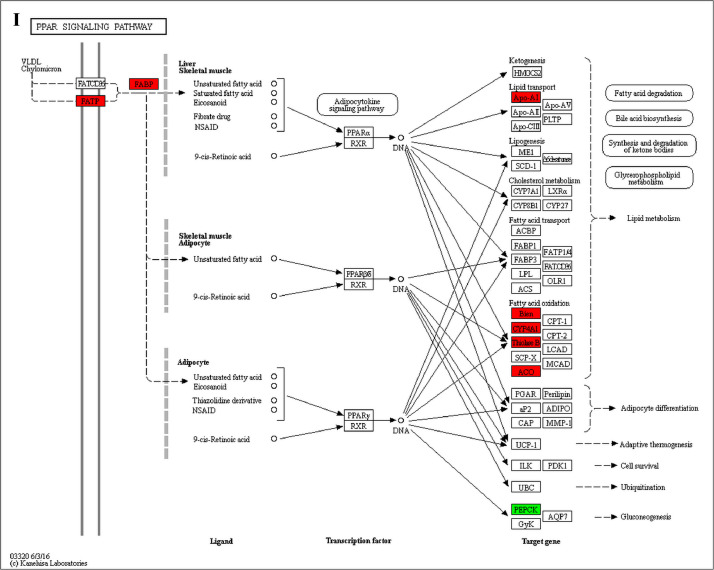
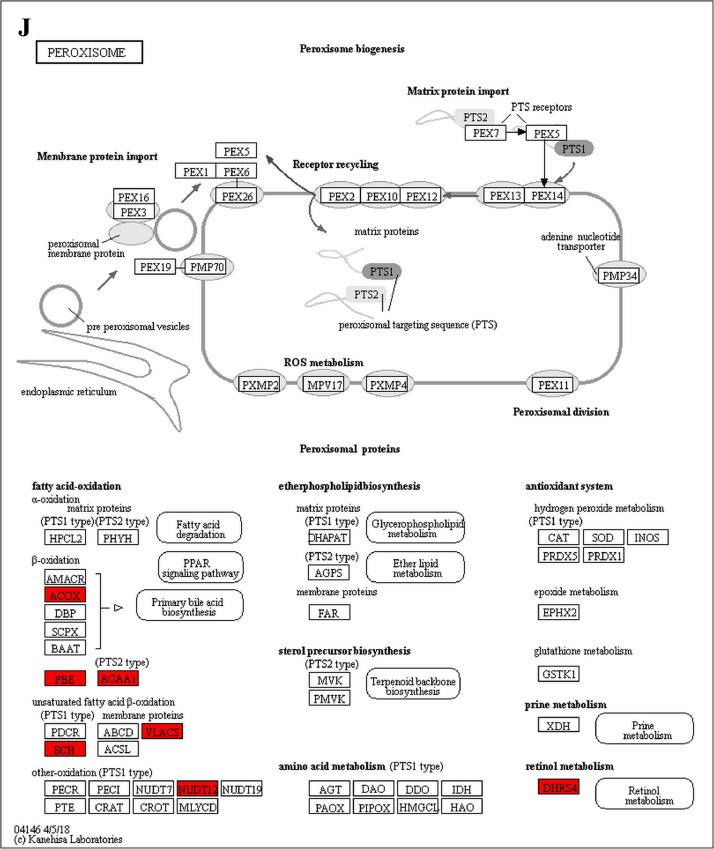
Fructus Rosae Roxburghii (FRR) has been considered as edible and medicinal fruit possessing antiatherosclerotic effect [1], [2], [3], [4], [5], but the mechanism is still unclear. Hyperlipidemia (HLP) is the material basis for atherosclerosis (AS) formation [6,7]. In this study, total cholesterol (TC), triglyceride (TG), low-density lipoprotein (LDL), lower high-density lipoprotein (HDL) and atherosclerotic index (ASI) in mice were analyzed under the action of FRR juice. Then differentially expressed proteins in liver were further analyzed by using TMT labeling and LC-MS/MS for better understanding the effect and molecular mechanism of FRR on diet-induced hyperlipidemic mice [8]. After the protein extraction and trypsin digestion, TMT labeling proteomic analysis were performed. The functions and KEGG signaling pathways of differentially expressed proteins were analyzed by bioinformatics methods. Hence, the potential antiatherosclerotic mechanism of FRR regulating blood lipids from protein level has great significance to explore new drug targets for AS.

Keywords: Antiatherosclerotic mechanism; Atherosclerosis; Fructus Rosae Roxburghii; Hyperlipidemia; KEGG signaling pathway; TMT proteomic analysis.


Conflict of interest statement

The authors declare that they have no known competing financial interests or personal relationships which have, or could be perceived to have, influenced the work reported in this article.

Figures

Fig. 1
Fig. 1
The KEGG pathway enrichment-based clustering analysis in the groups of Diet II vs I, III vs I and II vs III. A: Biological Process; B: Cellular Component; C: KEGG Pathway; D: Molecular Function; E: Protein Domain. The categories were at least enriched in one of protein groups with P<0.05. Filtered P matrix was transformed by the x=−log10 (P).
Fig. 1
Fig. 1
The KEGG pathway enrichment-based clustering analysis in the groups of Diet II vs I, III vs I and II vs III. A: Biological Process; B: Cellular Component; C: KEGG Pathway; D: Molecular Function; E: Protein Domain. The categories were at least enriched in one of protein groups with P<0.05. Filtered P matrix was transformed by the x=−log10 (P).
Fig. 2
Fig. 2
The analysis for enrichment pathway between Diet III vs I groups. A: Galactose metabolism; B: Fatty acid degradation; C: Steroid biosynthesis; D: Steroid hormone biosynthesis; E: Valine, leucine and isoleucine degradation; F: Lysine degradation; G: Tryptophan metabolism; H: β-alanine metabolism; I: Pyruvate metabolism; J: Propanoate metabolism; K: Butanoate metabolism; L: Terpenoid backbone biosynthesis; M: Drug metabolism-other enzymes; N: Biosynthesis of unsaturated fatty acids; O: PPAR signaling pathway; P: Maturity onset diabetes of the young; Q: Bile secretion; R: Cholesterol metabolism. The proteins in green were down-regulated, proteins in red were up-regulated and in yellow some proteins were up-regulated and some were down-regulated.
Fig. 2
Fig. 2
The analysis for enrichment pathway between Diet III vs I groups. A: Galactose metabolism; B: Fatty acid degradation; C: Steroid biosynthesis; D: Steroid hormone biosynthesis; E: Valine, leucine and isoleucine degradation; F: Lysine degradation; G: Tryptophan metabolism; H: β-alanine metabolism; I: Pyruvate metabolism; J: Propanoate metabolism; K: Butanoate metabolism; L: Terpenoid backbone biosynthesis; M: Drug metabolism-other enzymes; N: Biosynthesis of unsaturated fatty acids; O: PPAR signaling pathway; P: Maturity onset diabetes of the young; Q: Bile secretion; R: Cholesterol metabolism. The proteins in green were down-regulated, proteins in red were up-regulated and in yellow some proteins were up-regulated and some were down-regulated.
Fig. 3
Fig. 3
The analysis for enrichment pathway between Diet II vs III groups. A: Primary bile acid biosynthesis; B: Steroid hormone biosynthesis; C: Linoleic acid metabolism; D: Bile secretion; E: Chemical carcinogenesis. The proteins in green were down-regulated, proteins in red were up-regulated and in yellow some proteins were up-regulated and some were down-regulated.
Fig. 3
Fig. 3
The analysis for enrichment pathway between Diet II vs III groups. A: Primary bile acid biosynthesis; B: Steroid hormone biosynthesis; C: Linoleic acid metabolism; D: Bile secretion; E: Chemical carcinogenesis. The proteins in green were down-regulated, proteins in red were up-regulated and in yellow some proteins were up-regulated and some were down-regulated.
Fig. 4
Fig. 4
The analysis for enrichment pathway between Diet II vs I groups. A: Glycolysis/Gluconeogenesis; B: Fatty acid degradation; C: Steroid biosynthesis; D: Tryptophan metabolism; E: β-alanine metabolism; F: Pyruvate metabolism; G: Retinol metabolism in animals; H: Biosynthesis of unsaturated fatty acids; I: PPAR signaling pathway; J: Peroxisome; K: Vitamin digestion and absorption. The proteins in green were down-regulated, proteins in red were up-regulated and in yellow some proteins were up-regulated and some were down-regulated.
Fig. 4
Fig. 4
The analysis for enrichment pathway between Diet II vs I groups. A: Glycolysis/Gluconeogenesis; B: Fatty acid degradation; C: Steroid biosynthesis; D: Tryptophan metabolism; E: β-alanine metabolism; F: Pyruvate metabolism; G: Retinol metabolism in animals; H: Biosynthesis of unsaturated fatty acids; I: PPAR signaling pathway; J: Peroxisome; K: Vitamin digestion and absorption. The proteins in green were down-regulated, proteins in red were up-regulated and in yellow some proteins were up-regulated and some were down-regulated.

Similar articles

References

    1. Lu X., Bao S. Effect of polysaccharides from Fructus Rosae Roxburghii on stress tolerance and immune function. J. GZ Univ. Tradit. Chin. Med. 2002;19:141–142.
    1. Dai T.T., Yang X.S. Advances in chemical constituents and pharmacological activities of Rosa roxburghii. J. GY. Coll. TCM. 2015;37:93–97. doi: 10.19540/j.cnki.cjcmm.20191108.201. - DOI
    1. Zhang C., Liu X., Qiang H. Inhibitory effects of Rosa roxburghii tratt juice on in vitro oxidative modification of low density lipoprotein and on the macrophage growth and cellular cholesteryl ester accumulation induced by oxidized low density lipoprotein. Clin. Chim. Acta. 2001;313:37–43. doi: 10.1016/S0009-8981(01)00647-7. - DOI - PubMed
    1. Xu J., Vidyarthi S.K., Bai W. Nutritional constituents, health benefits and processing of Rosa Roxburghii: a review. J. Func. Foods. 2019;60 doi: 10.1016/J.JFF.2019.103456. - DOI
    1. Burke D.S., Smidt C.R., Vuong L.T. Momordica cochinchinensis, Rosa roxburghii, wolfberry, and sea buckthorn-highly nutritional fruits supported by tradition and science. Curr. Top. Nutraceu. R. 2005;3:59.