[Preprint]. 2021 Apr 19.
doi: 10.26434/chemrxiv.14442785.

Developing a SARS-CoV-2 Antigen Test Using Engineered Affinity Proteins

Affiliations

Developing a SARS-CoV-2 Antigen Test Using Engineered Affinity Proteins

Seunghyeon Kim et al. ChemRxiv. .

Update in

Abstract

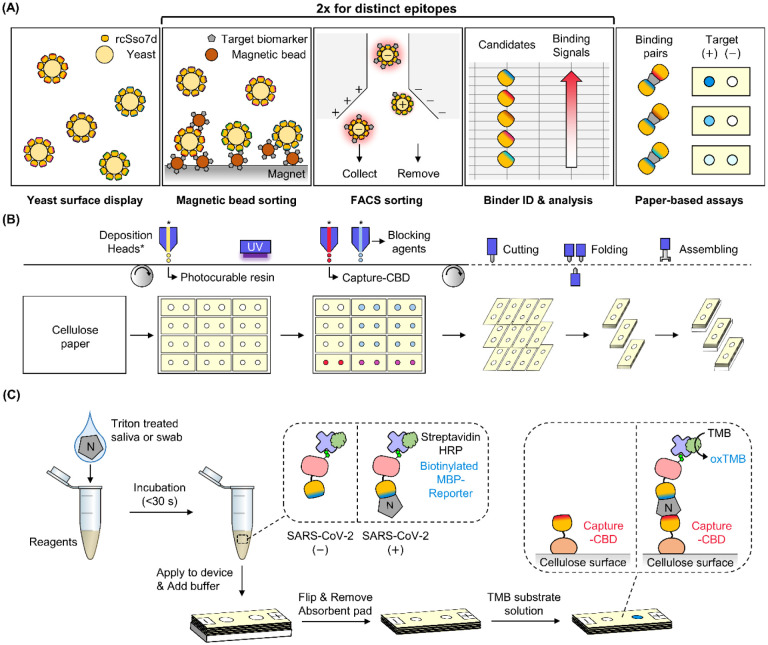
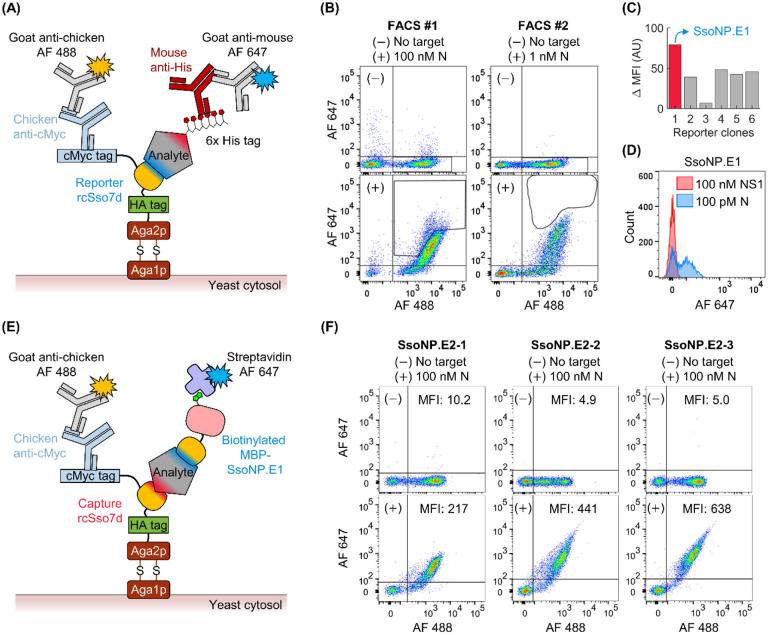
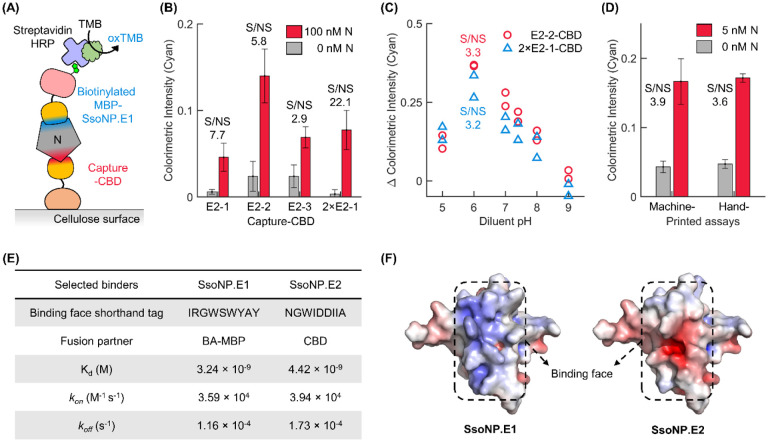
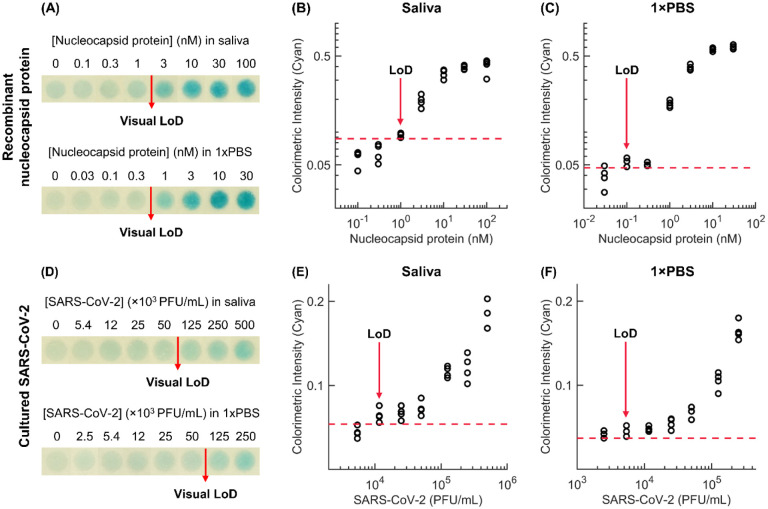
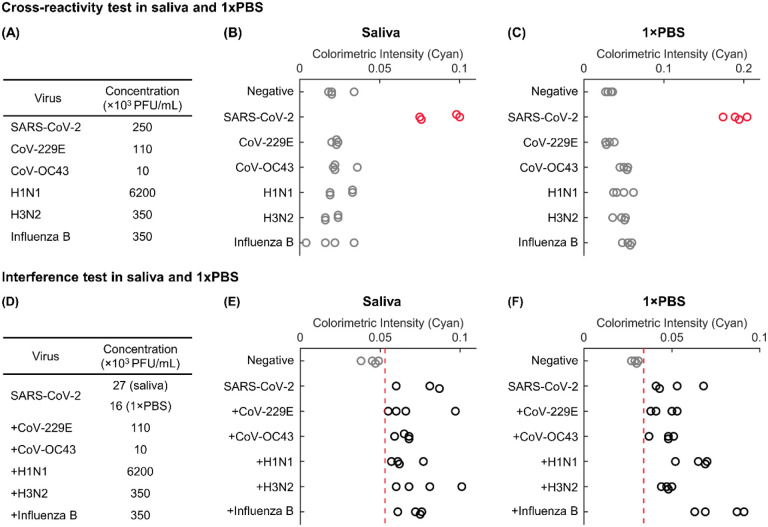
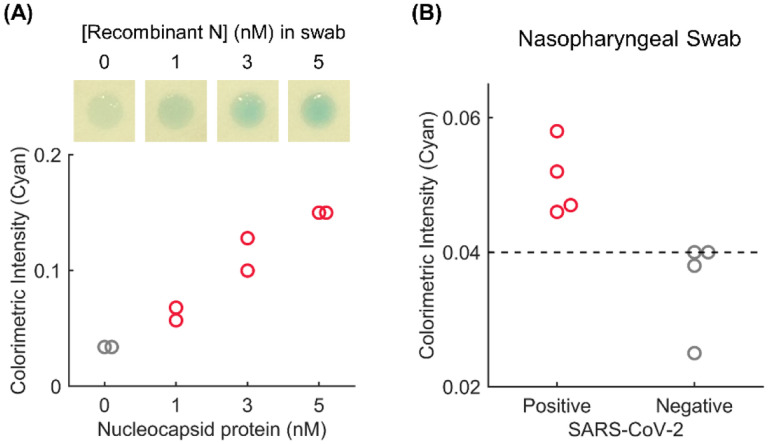
The ongoing COVID-19 pandemic has clearly established how vital rapid, widely accessible diagnostic tests are in controlling infectious diseases and how difficult and slow it is to scale existing technologies. Here, we demonstrate the use of the rapid affinity pair identification via directed selection (RAPIDS) method to discover multiple affinity pairs for SARS-CoV-2 nucleocapsid protein (N-protein), a biomarker of COVID-19, from in vitro libraries in 10 weeks. The pair with the highest biomarker sensitivity was then integrated into a 10-minute, vertical-flow cellulose paper test. Notably, the as-identified affinity proteins were compatible with a roll-to-roll printing process for large-scale manufacturing of tests. The test achieved 40 pM and 80 pM limits of detection in 1×PBS (mock swab) and saliva matrices spiked with cell-culture generated SARS-CoV-2 viruses and is also capable of detection of N-protein from characterized clinical swab samples. Hence, this work paves the way towards the mass production of cellulose paper-based assays which can address the shortages faced due to dependence on nitrocellulose and current manufacturing techniques. Further, the results reported herein indicate the promise of RAPIDS and engineered binder proteins for the timely and flexible development of clinically relevant diagnostic tests in response to emerging infectious diseases.

Keywords: affinity proteins; cellulose; cellulose binding domains; cellulose binding modules; covid-19; directed evolution; enzyme-linked immunosorbent assay; flow test strips; library screening; peptides; proteins; rapid detection test; rcSso7d; roll to roll manufacturing; thermostable protein; yeast surface display.


Conflict of interest statement

DYY is an employee of 3M. JMJ is an employee of Quanterix Corporation.

Figures

Figure 1.
Figure 1.
Development of mass-producible, rapid SARS-CoV-2 antigen tests. (A) Workflow for selecting rcSso7d binding pairs against SARS-CoV-2 nucleocapsid protein (N-protein) using the RAPIDS process. A yeast surface-displayed library of rcSso7d variants is screened via multiple rounds of magnetic bead sorting and fluorescence activated cell sorting (FACS). Lead clones are assessed via flow cytometry titrations with the target biomarker to rank their binding affinities. A selected binding variant is subcloned, expressed and purified from E. coli, and employed as a reporter reagent in the selection of a capture reagent which simultaneously binds to a distinct target epitope. The selection scheme yields several capture binder candidates, which are tested as binding pairs on paper-based assays. (B) Schematic representation of manufacturing the vertical flow paper-based assays. Cellulose paper is continuously fed from one roller to another as hydrophobic patterns are applied, followed by capture binder genetically fused to cellulose-binding domain (Capture-CBD) on test zones of the fourth layer, and then blocking solution on all hydrophilic zones. The roll of biofunctionalized paper can be cut into four-layer pieces, which are then accordion-folded and fused together with removable wicking pads. Details of manufacturing the assays is provided in Materials and Methods. (C) Schematic of vertical flow paper-based assays for SARS-CoV-2 antigen detection. Human saliva or swab samples treated with Triton X-100 are incubated with reagents including reporter binder fused to biotinylated maltose-binding protein (MBP) and streptavidin- (or neutravidin-) horseradish peroxidase (HRP) conjugate, labeling SARS-CoV-2 N-protein with the enzyme. The mixture of samples and reagents is applied to sample ports, followed by wash buffer. The enzyme labeled N-protein is captured on test zones of the bottom layer by pre-immobilized Capture-CBD. The test zones with the HRP-labeled N-protein generate blue color when TMB substrate solution is added.
Figure 2.
Figure 2.
Identification of affinity pairs against SARS-CoV-2 N-protein. (A) Schematic of the protein complex on yeast surface for reporter binder selection in FACS. rcSso7d, flanked by HA/cMyc epitope tags to report display efficiency, is expressed on the yeast surface via genetic fusion to the Aga2p protein, which is released outside of the cell and covalently bonded to Aga1p species in the cell wall. Target binding signals are generated by the association of fluorescently (AF 647) labeled antibody with the hexahistidine tag of the target molecule. (B) FACS plots for two rounds of reporter binder selection against decreasing concentrations of SARS-CoV-2 N-protein. Gates drawn indicate the sub-population that was retained during sorting. (C) Background-subtracted geometric mean fluorescence intensity calculated from FACS plots when reporter binder candidates are incubated with 100 pM SARS-CoV-2 N-protein. Background signals are measured with 100 nM dengue virus serotype 2 non-structural protein 1 (DENV2 NS1) as a specificity check. (D) FACS histogram showing target-specific binding of selected reporter binder, SsoNP.E1, with the target-positive sample (blue) and the target-negative sample (red). The negative sample included 100 nM DENV2 NS1. (E) Schematic of the protein complex on yeast surface for FACS to discover affinity pairs. Yeast cells are fluorescently (AF 647) labeled upon simultaneous binding of the displayed rcSso7d variant to a second epitope (red) in addition to the first epitope bound by the biotinylated MBP-SsoNP.E1 reporter (blue). (F) FACS plots showing target-specific binding of biotinylated MBP-SsoNP.E1 (500 nM) and selected capture binders, SsoNP.E2–1, SsoNP.E2–2, and SsoNP.E2–3, in the sandwich assay format without target (top) and with 100 nM SARS-CoV-2 N-protein (bottom). Geometric mean fluorescence intensity (MFI) quantifies the binding signals for each case.
Figure 3.
Figure 3.
Testing selected binding pairs on paper-based assays. (A) Schematic of the protein complex on test zones of paper-based assays in the presence of SARS-CoV-2 N-protein. CBD-fused capture binder (Capture-CBD) candidates are pre-immobilized on test zones and exposed to the mixture of sample and reagent solution including biotinylated MBP-SsoNP.E1 and HRP-conjugated streptavidin. The desired complex (above) is formed in the presence of the target biomarker, producing blue color as TMB substrate solution is added. Otherwise, the reagents are washed away, leaving only Capture-CBD on test zones. (B) Screening of the selected binding pairs on single-layer paper-based assays. Details of this assay is provided in Supporting Information. Three different capture binder clones (E2–1, E2–2, and E2–3) and a dimer of E2–1 were fused to CBD and formed pairs with biotinylated MBP-SsoNP.E1. The plot shows target-specific signals (S, red) and non-specific signals (NS, gray) in cyan intensity and the ratio of S to NS. Each bar graph consists of an average of four replicates, and error bars represent standard deviation. (C) Final round of binding pair selection in vertical flow paper-based assays with optimizing diluent pH. Target-specific signals (S, 100 nM N-protein) and non-specific signals (NS, 0 nM N-protein) are quantified as cyan colorimetric intensity at various pH. Both binding pairs showed optimal binding signals at pH 6, but E2–2-CBD achieved slightly better sensitivity than 2×E2–1-CBD while maintaining similar ratio of S to NS. (D) Comparing test performance of machine-printed and hand-printed assays. Both assays produce similar target-specific signals (S, 5 nM N-protein) and non-specific signals (NS, 0 nM N-protein) and their ratio (S/NS). These results indicate that the capture reagent and blocking solution preserve their activity after the automated manufacturing process. (E) Binding face amino acid sequences of the selected binders and their biophysical constants in fused forms. (F) The electrostatic surface potential of the selected binders (SsoNP.E1 and SsoNP.E2). Red and blue colors indicate negative and positive potential, respectively. The binding sites for N-protein are highlighted in dashed rectangles and labeled.
Figure 4.
Figure 4.
Detection of recombinant SARS-CoV-2 N-protein or cultured SARS-CoV-2 spiked into saliva and 1×PBS. (A) Representative images of the assay results with recombinant SARS-CoV-2 N-protein spiked into saliva and 1×PBS. Replicates are available in Figure S16. (B, C) Dose response curve for recombinant SARS-CoV-2 N-protein in saliva (B) and 1×PBS (C). Colorimetric intensity (Cyan) values were calculated using ImageJ. The red dotted line (Neg+3σ) represents the mean cyan intensity (Neg) of 0 nM samples plus three times their standard deviation (σ). LoDs in saliva (1 nM) and in 1×PBS (0.1 nM) were calculated as the lowest N-protein concentrations that provided signals above the lines. (D) Representative images of the assay results with cultured SARS-CoV-2 spiked into saliva and 1×PBS. Replicates are available in Figure S17. (E, F) Dose response curve for cultured SARS-CoV-2 in saliva (E) and 1×PBS (F). The red dotted line represents Neg+3σ as described above. LoDs in saliva (1.2×10⁴ PFU/mL) and in 1×PBS (5.4×10³ PFU/mL) were calculated as the lowest N-protein concentrations that provided signals above the lines.
Figure 5.
Figure 5.
Cross-reactivity and interference tests with cultured SARS-CoV-2 spiked into saliva or 1×PBS. (A) Viruses and their concentrations used in cross-reactivity tests. (B, C) Cross-reactivity results in saliva (B) and 1×PBS (C). No SARS-CoV-2 is included in negative control and other virus samples. (D) Viruses and their concentrations used in interference tests. (E, F) Interference results in saliva (E) and 1×PBS (F). Except for negative control, smaller concentrations of SARS-CoV-2 than 3×LoD are included in saliva (2.7×10⁴ PFU/mL) and 1×PBS (1.6×10⁴ PFU/mL). The red dotted lines represent Neg+3σ as described above. The results demonstrate that our binding pair is highly specific to SARS-CoV-2 N-protein and is not subject to interference from other viruses.
Figure 6.
Figure 6.
Detection of SARS-CoV-2 N-protein in clinical samples. (A) Detection of recombinant N-protein spiked into negative nasopharyngeal swab matrices. Top: Representative images of the assay results. Bottom: Colorimetric intensity (Cyan) values were calculated using ImageJ. (B) Vertical flow assay results with four RT-PCR positive and four RT-PCR negative nasopharyngeal swab samples. The dotted line represents a cut-off value for the test, which is determined by the largest colorimetric intensity from the negative samples.

Similar articles

References

    1. Jayamohan H.; Lambert C. J.; Sant H. J.; Jafek A.; Patel D.; Feng H.; Beeman M.; Mahmood T.; Nze U.; Gale B. K. SARS-CoV-2 Pandemic : A Review of Molecular Diagnostic Tools Including Sample Collection and Commercial Response with Associated Advantages and Limitations. Anal. Bioanal. Chem. 2020, 1–23. - PMC - PubMed
    1. Singh A. T.; Lantigua D.; Meka A.; Taing S.; Pandher M.; Camci-Unal G. Paper-Based Sensors: Emerging Themes and Applications. Sensors 2018, 18 (9), 2838. - PMC - PubMed
    1. Martinez A. W.; Phillips S. T.; Carrilho E.; Whitesides G. M. Diagnostics for the Developing World: Microfluidic Paper-Based Analytical Devices. Anal. Chem. 2010, 82 (1), 3–10. - PubMed
    1. Cate D. M.; Adkins J. A.; Mettakoonpitak J.; Henry C. S. Recent Developments in Paper-Based Microfluidic Devices. Anal. Chem. 2015, 87 (1), 19–41. - PubMed
    1. Cheng C.-M.; Martinez A. W.; Gong J.; Mace C. R.; Phillips S. T.; Carrilho E.; Mirica K. A.; Whitesides G. M. Paper-Based ELISA. Angew. Chemie - Int. Ed. 2010, 49 (28), 4771–4774. - PubMed

Publication types

LinkOut - more resources