[Preprint]. 2021 Apr 23:rs.3.rs-380803.
doi: 10.21203/rs.3.rs-380803/v1.

Impaired immune signaling and changes in the lung microbiome precede secondary bacterial pneumonia in COVID-19

Affiliations

Impaired immune signaling and changes in the lung microbiome precede secondary bacterial pneumonia in COVID-19

Alexandra Tsitsiklis et al. Res Sq. .

Abstract

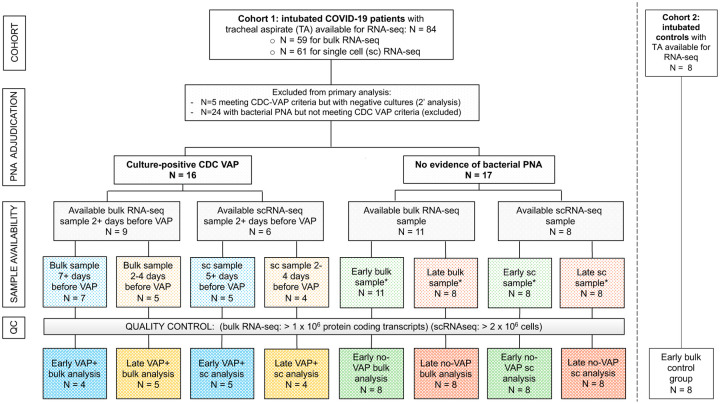
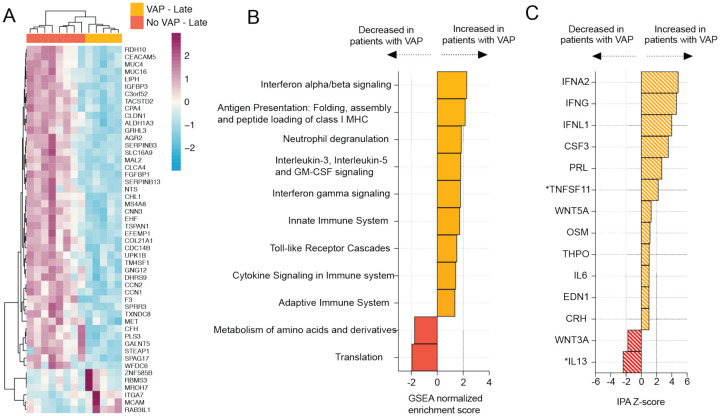
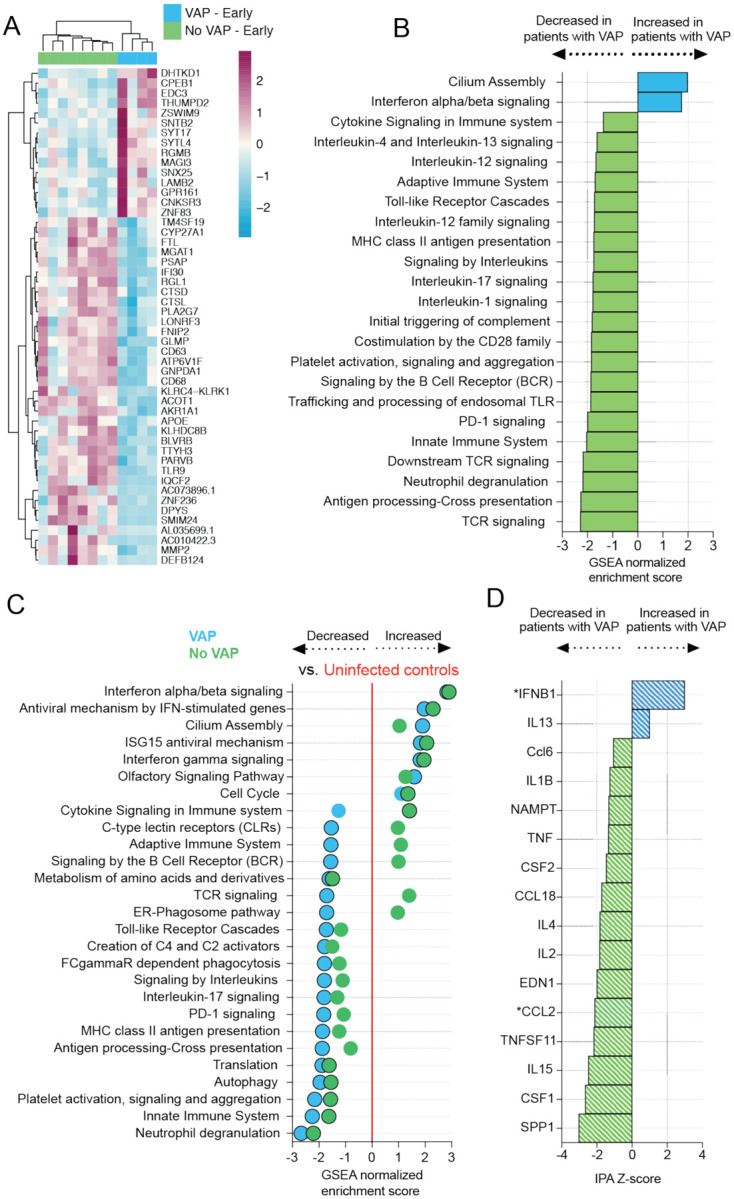
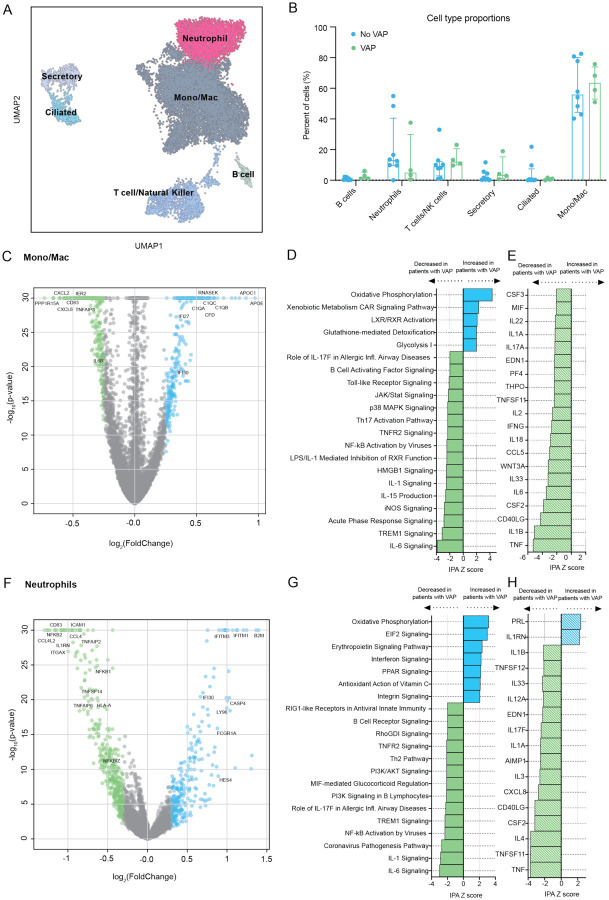
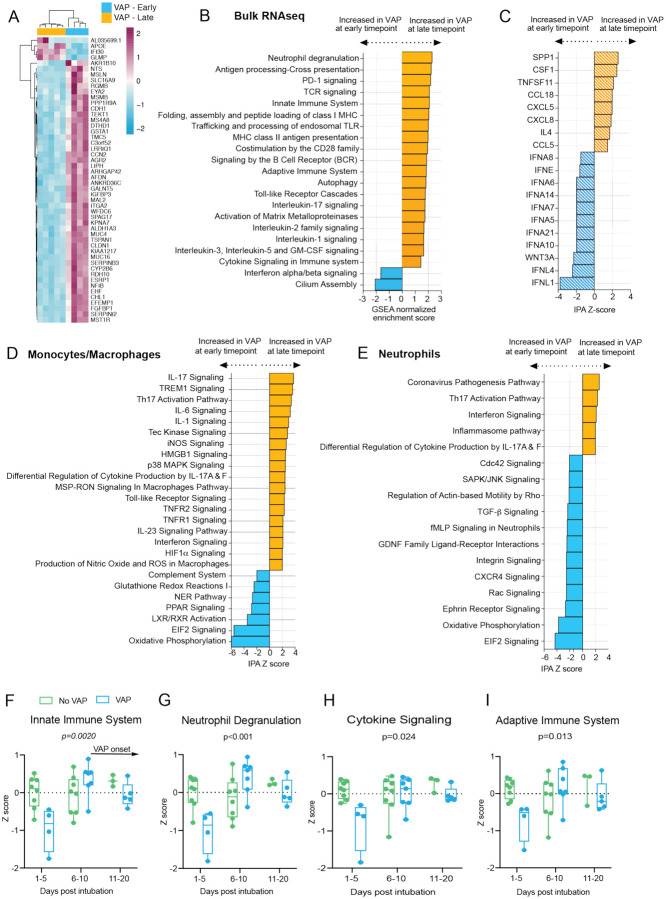
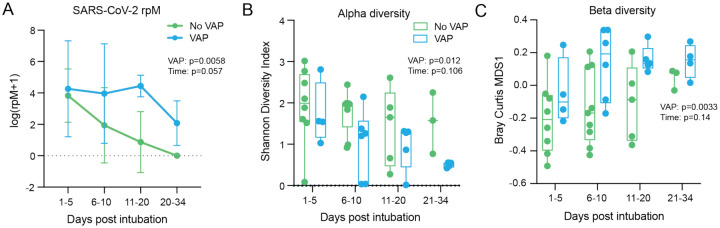
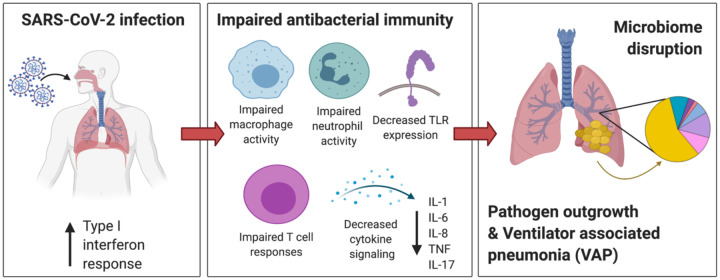
Secondary bacterial infections, including ventilator-associated pneumonia (VAP), lead to worse clinical outcomes and increased mortality following viral respiratory infections including in patients with coronavirus disease 2019 (COVID-19). Using a combination of tracheal aspirate bulk and single-cell RNA sequencing (scRNA-seq) we assessed lower respiratory tract immune responses and microbiome dynamics in 28 COVID-19 patients, 15 of whom developed VAP, and eight critically ill uninfected controls. Two days before VAP onset we observed a transcriptional signature of bacterial infection. Two weeks prior to VAP onset, following intubation, we observed a striking impairment in immune signaling in COVID-19 patients who developed VAP. Longitudinal metatranscriptomic analysis revealed disruption of lung microbiome community composition in patients with VAP, providing a connection between dysregulated immune signaling and outgrowth of opportunistic pathogens. These findings suggest that COVID-19 patients who develop VAP have impaired antibacterial immune defense detectable weeks before secondary infection onset.

Keywords: COVID-19; SARS-CoV-2; VAP; metagenomics; scRNA-seq; secondary bacterial pneumonia.


Figures

Figure 1:
Figure 1:. Study flowchart.
Two patient cohorts were studied. Cohort 1 consisted of COVID-19 patients from the COVID Multiphenotyping for Effective Therapies (COMET) / Immunophenotyping Assessment in a COVID-19 Cohort (IMPACC) studies (described in Methods). Cohort 2 consisted of critically ill intubated control patients from a prior prospective cohort study led by our research group. The “early” samples were the first available tracheal aspirate specimens after intubation. For COVID-19 patients who developed VAP, the “late” samples were obtained a median of two days before VAP onset. Timing of sample collection with respect to VAP versus No-VAP groups was matched at “early” and “late” time points. Controls included eight critically ill, mechanically ventilated patients without LRTI. All COVID-19 patients included in the primary bulk analysis were also included in the longitudinal host expression and microbiome analyses. Abbreviations: VAP=ventilator-associated pneumonia; TA=tracheal aspirate; QC=quality control; sc or scRNA-seq= single cell RNA sequencing; PNA=pneumonia; CDC=United States Centers for Disease Control and Prevention.
Figure 2:
Figure 2:. COVID-19 VAP is associated with a lower respiratory tract transcriptional signature of bacterial infection 2 days before VAP onset.
A) Heatmap of the top 50 differentially expressed genes by adjusted P-value between COVID-19 patients who developed VAP (yellow) versus those who did not (red) at the “late” time-point, 2 days before the onset of VAP, from bulk RNA-seq. B) Gene set enrichment analysis (GSEA) at the “late” time-point based on differential gene expression analyses. GSEA results were considered significant with an adjusted P-value <0.05. C) Ingenuity Pathway Analysis (IPA) of upstream cytokines at the “late” time-point based on differential gene expression analyses. IPA results were considered significant with a Z-score absolute value >2 and overlap P-value <0.05. *Denotes cytokines with an overlap P-value < 0.1. All pathways and cytokines are shown in Supplementary data files 2 and 3.
Figure 3:
Figure 3:. COVID-19 patients who develop VAP have attenuated immune signaling in the lower respiratory tract two weeks before onset of secondary bacterial pneumonia.
A) Heatmap of the top 50 differentially expressed genes by adjusted P-value between COVID-19 patients who developed VAP (blue) versus those who did not (green) at the “early” time-point from bulk RNA-seq. B) Gene set enrichment analysis at the “early” time-point based on differential gene expression analyses. GSEA results were considered significant with an adjusted P-value <0.05. C) Expression of GSEA pathways at the “early” time-point with respect to a baseline of uninfected, intubated controls. Pathways were selected from the GSEA results if they had an adjusted P-value <0.05 in at least one of the comparisons (VAP vs controls or No-VAP vs controls). Pathways with an adjusted P-value <0.05 when compared to controls are indicated by circles with a black outline. D) Ingenuity Pathway Analysis (IPA) of upstream cytokines at the “early” time-point based on differential gene expression analyses. IPA results were considered significant with a Z-score absolute value >2 and overlap P-value <0.05. *Denotes cytokines with an overlap P-value <0.1. All pathways and cytokines are shown in Supplementary data files 2 and 3.
Figure 4:
Figure 4:. scRNA-seq demonstrates that COVID-19 VAP is associated with early impaired anti-bacterial immune signaling in lower respiratory tract monocytes, macrophages and neutrophils.
A) UMAP of single cell RNA-seq data from patients that do or do not develop VAP at the “early” time-point, annotated by cell type. B) Cell type proportions in single cell RNA-seq from VAP and No-VAP patients at the “early” time-point. Bars represent the median with IQR. Statistical significance was determined by Mann-Whitney tests. None of the cell types were significantly different with a p-value <0.05. The p-values for each cell type are as follows: B cells: 0.073; Neutrophils: 0.28; T/NK cells: 0.21; Secretory: 0.46; Ciliated: 0.94, and Mono/Mac: 0.81. C) Volcano plot displaying the differentially expressed genes between VAP and No-VAP patients in monocytes and macrophages. D) Ingenuity Pathway Analysis (IPA) of key canonical pathways and upstream cytokines based on differential gene expression analysis in monocytes and macrophages of patients who develop VAP versus those who do not, with adjusted p-values < 0.05. Only significant pathways (IPA Z-score of >2 or <−2 and overlap p-value <0.05) are shown. E) Volcano plot displaying the differentially expressed genes between VAP and No-VAP patients in neutrophils. F) IPA of canonical pathways and upstream cytokines based on differential gene expression analysis in neutrophils of patients who develop VAP versus those who do not, with adjusted p-values < 0.05. Only significant pathways (IPA Z-score of >2 or <−2 and overlap p-value <0.05) are shown. All pathways and cytokines are shown in Supplementary data files 5 and 6.
Figure 5:
Figure 5:. Temporal dynamics of the host response to VAP
A) Heatmap of the top 50 differentially expressed genes by adjusted P-value between COVID-19 patients who developed VAP at the “early” time-point (blue) versus the “late” time-point (yellow) from bulk RNA-seq. B) Gene set enrichment analysis (GSEA) based on differential gene expression of VAP patients at the “early” vs “late” time-point from bulk RNA-seq. GSEA results were considered significant with an adjusted P-value <0.05. C) Ingenuity Pathway Analysis (IPA) of upstream cytokines based on differential gene expression analyses of VAP patients at the “early” vs “late” time-point from bulk RNA-seq. IPA results were considered significant with a Z-score absolute value >2 and overlap P-value <0.05. (D-E) Ingenuity Pathway Analysis (IPA) of key canonical pathways based on differential gene expression analysis in monocytes and macrophages (D) or neutrophils (E) from scRNA-seq of patients who develop VAP versus those who do not, with adjusted p-values < 0.05. Only significant pathways (IPA Z-score of >2 or <−2 and overlap p-value <0.05) are shown. All pathways and cytokines are shown in Supplementary data files 2, 3, 5, and 6. (F-I) Longitudinal analysis of selected pathway expression in VAP (blue) versus No-VAP (green) patients from bulk RNA-seq samples taken from time of intubation to onset of VAP for all patients. Pathway Z-scores were calculated by averaging Z-scores for the top 20 leading edge genes of each pathway, determined by the results of GSEA comparing VAP versus No-VAP patients at the “early” time-point. Multiple Z-scores per patient at a given time interval were averaged so that each patient corresponds to one datapoint at each interval. Samples from day 21+ after intubation are not shown due to a lack of these later time-points in the No-VAP group. VAP onset in these patients ranged from 10–39 days post intubation. Selected pathways are innate immune system (F), neutrophil degranulation (G), cytokine signaling (H), and adaptive immune system (I). Box plots represent the median and range. Statistical significance was determined by two-way ANOVA, and interaction p-values are shown.
Figure 6:
Figure 6:. Lung microbiome community collapse precedes VAP in COVID-19 patients.
(A) SARS-CoV-2 viral load (reads per million sequenced, rpM) over time by days since intubation in patients who develop VAP vs those who do not. For plotting purposes, log(rpM+1) was used to avoid negative values. Lung microbiome (B) bacterial diversity (Shannon’s Index) and (C) β-diversity (Bray Curtis Index, NMDS scaling) in COVID-19 patients with relation to VAP development over time by days since intubation. Box plots represent the median and range (A-C). Statistical significance was determined by two-way ANOVA. P-values <0.05 were considered significant.
Figure 7:
Figure 7:. Mechanistic hypothesis of secondary bacterial pneumonia susceptibility in patients with COVID-19.
Individual immune responses to SARS-CoV-2 infection drive a restructuring of the microbial community and increase susceptibility to VAP. Those predisposed to VAP have increased type I interferon responses and dysregulated antibacterial immune signaling characterized by impaired macrophage, neutrophil and T cell activity, decreased TLR signaling and impaired activation of key cytokines important for pathogen defense including IL-1, IL-6, IL-8, TNF, and IL-17. This state of suppressed immunity disrupts the lower respiratory tract microbiome, predisposing to outgrowth of bacterial pathogens and VAP.

References

    1. Falsey A. R. et al. Bacterial Complications of Respiratory Tract Viral Illness: A Comprehensive Evaluation. The Journal of Infectious Diseases 208, 432–441 (2013). - PMC - PubMed
    1. Morens D. M., Taubenberger J. K. & Fauci A. S. Predominant role of bacterial pneumonia as a cause of death in pandemic influenza: implications for pandemic influenza preparedness. J Infect Dis 198, 962–970 (2008). - PMC - PubMed
    1. Rouzé A. et al. Relationship between SARS-CoV-2 infection and the incidence of ventilator-associated lower respiratory tract infections: a European multicenter cohort study. Intensive Care Med 1–11 (2021) doi:10.1007/s00134-020-06323-9 - DOI - PMC - PubMed
    1. Luyt C.-E. et al. Ventilator-associated pneumonia in patients with SARS-CoV-2-associated acute respiratory distress syndrome requiring ECMO: a retrospective cohort study. Ann Intensive Care 10, 158 (2020). - PMC - PubMed
    1. Bardi T. et al. Nosocomial infections associated to COVID-19 in the intensive care unit: clinical characteristics and outcome. Eur J Clin Microbiol Infect Dis (2021) doi:10.1007/s10096-020-04142-w - DOI - PMC - PubMed

Publication types

LinkOut - more resources