[Preprint]. 2021 May 12:2021.05.11.443609.
doi: 10.1101/2021.05.11.443609.

Early cross-coronavirus reactive signatures of protective humoral immunity against COVID-19

Affiliations

Early cross-coronavirus reactive signatures of protective humoral immunity against COVID-19

Paulina Kaplonek et al. bioRxiv. .

Update in

  • Early cross-coronavirus reactive signatures of humoral immunity against COVID-19.
    Kaplonek P, Wang C, Bartsch Y, Fischinger S, Gorman MJ, Bowman K, Kang J, Dayal D, Martin P, Nowak RP, Villani AC, Hsieh CL, Charland NC, Gonye ALK, Gushterova I, Khanna HK, LaSalle TJ, Lavin-Parsons KM, Lilley BM, Lodenstein CL, Manakongtreecheep K, Margolin JD, McKaig BN, Rojas-Lopez M, Russo BC, Sharma N, Tantivit J, Thomas MF, Sade-Feldman M, Feldman J, Julg B, Nilles EJ, Musk ER, Menon AS, Fischer ES, McLellan JS, Schmidt A, Goldberg MB, Filbin MR, Hacohen N, Lauffenburger DA, Alter G. Kaplonek P, et al. Sci Immunol. 2021 Oct 15;6(64):eabj2901. doi: 10.1126/sciimmunol.abj2901. Epub 2021 Oct 15. Sci Immunol. 2021. PMID: 34652962 Free PMC article.

Abstract

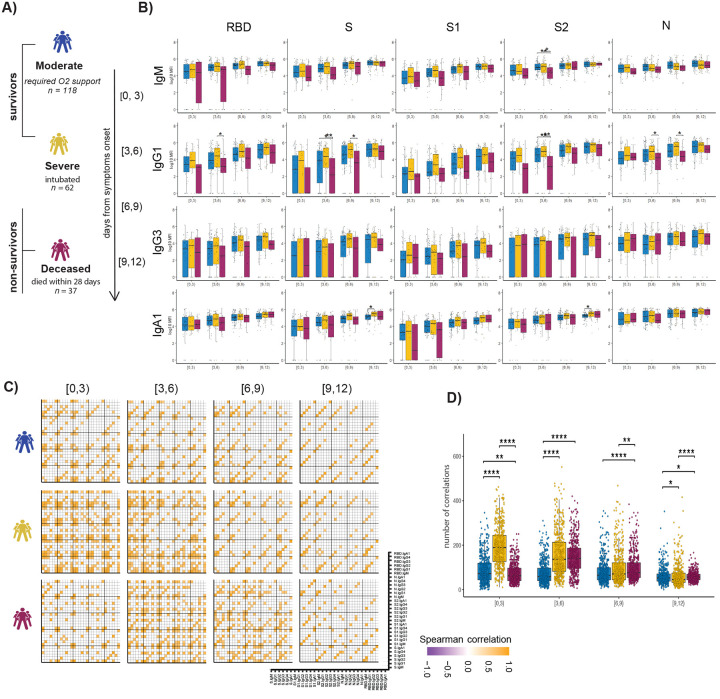
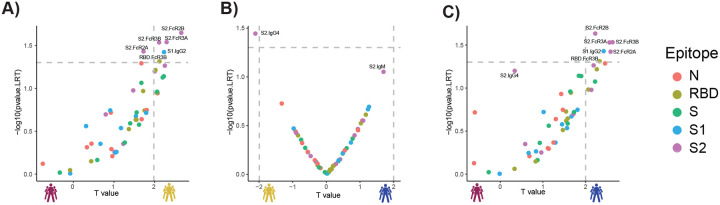
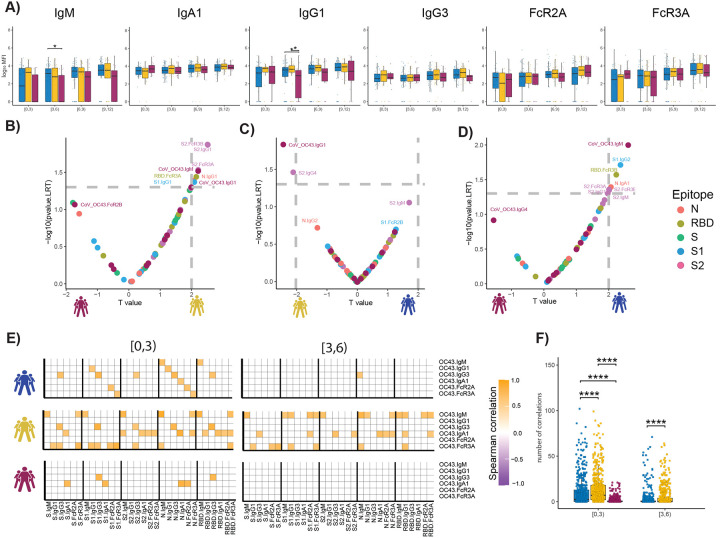
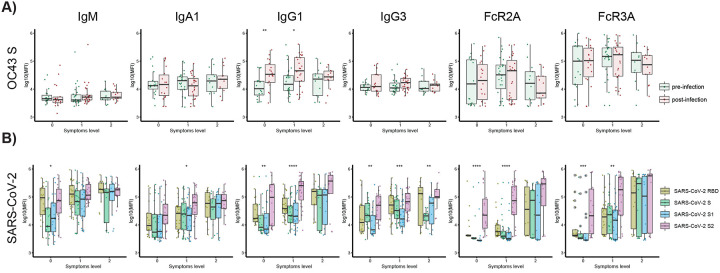
The introduction of vaccines has inspired new hope in the battle against SARS-CoV-2. However, the emergence of viral variants, in the absence of potent antivirals, has left the world struggling with the uncertain nature of this disease. Antibodies currently represent the strongest correlate of immunity against COVID-19, thus we profiled the earliest humoral signatures in a large cohort of severe and asymptomatic COVID-19 individuals. While a SARS-CoV-2-specific immune response evolved rapidly in survivors of COVID-19, non-survivors exhibited blunted and delayed humoral immune evolution, particularly with respect to S2-specific antibody evolution. Given the conservation of S2 across β-coronaviruses, we found the early development of SARS-CoV-2-specific immunity occurred in tandem with pre-existing common β-coronavirus OC43 humoral immunity in survivors, which was selectively also expanded in individuals that develop paucisymptomatic infection. These data point to the importance of cross-coronavirus immunity as a correlate of protection against COVID-19.


Conflict of interest statement

Conflict of interests:

G.A. is a founder of Seromyx Systems Inc. D.D., P.M., A.S.M, and E.R.M. are employees of Space Exploration Technologies Corp. E.S.F. is a founder, scientific advisor and equity holder for: Jengu Therapeutics (board member), Neomorph Inc and Civetta Therapeutics; an equity holder in C4 Therapeutics (CCCC); and a consultant to Novartis, Sanofi, AbbVie, Pfizer, Astellas, EcoR1 capital and Deerfield. The Fischer lab receives or has received research funding from Novartis, Ajax, and Astellas not related to this work. All other authors have declared that no conflict of interest exists.

Figures

Figure 1.
Figure 1.. Evolution of early SARS-CoV-2 specific humoral immune responses following symptom onset across acutely ill COVID-19 patients.
(A) The cartoon shows the study groups based on COVID-19 severity: 217 COVID-19-infected patients were sampled on days 0, 3, and 7 after admission to the hospital. Patients were classified into three groups based on the maximal acuity within 28 days of enrollment: Moderate: hospitalized that required supplemental oxygen (n = 118). Severe: intubation, mechanical ventilation, and survival to 28 days (n = 62). Deceased: death within 28 days (n = 37). Based on the day of symptom onset, the samples were divided into four temporal groups: [0, 3), [3, 6), [6, 9), [9, 12). (B) The whisker plots show the distribution of antibody titers across moderate (blue), severe (yellow), and deceased (red) over the study time course. The solid black line represents the median, and the box boundary (upper and below) represents the first and third quartiles. The dots show the scaled values of each sample. A two-sample Wilcox test was used to evaluate statistical differences across groups for all the intervals and features. The P-values were corrected from multiple hypothesis testing using the Benjamini-Hochbery procedure per each interval. Significance corresponds to adjusted P-values. (* p < 0.05, ** p < 0.01). (C) The correlation heatmap shows pairwise Spearman correlation matrices of SARS-CoV-2-specific antibody response across COVID-19 severity groups (moderate, severe, and deceased) for all four intervals. Correlation coefficients are shown only if they are larger than 0.6 and statistically significant after Benjamini-Hochberg correction for multiple hypothesis testing. Negative correlations are indicated in purple, positive correlations are shown in orange. (D) The statistical evaluation of the effect of sample size. The spearman correlation is calculated by randomly selected ten samples per category for 500 runs. The number of statistically significant correlations (larger than 0.6) is calculated and tested by the Mann-Whitney U test. Significance corresponds to adjusted P-values. (* p < 0.05, ** p < 0.01, *** p <0.001, **** p <0.0001).
Figure 2.
Figure 2.. Selective enrichment of S2-specific responses across COVID-19 patients.
(A–C) Volcano plots of pairwise comparisons across pairs of each of the three groups highlight differences across groups controlling for age, BMI, heart, lung and kidney diseases. The volcano plots include comparisons of (A) individuals that passed away within 28 days (deceased) vs. severe survivors; (B) subjects who experienced moderate disease vs. severe survivors; (C) subjects who ultimately passed away (deceased) vs. subjects who developed moderate disease. The x-axis represents the t value of the full model, and the y-axis denotes the p values by likelihood ratio test comparing the null model and full model. The null/full model represents the association between each individual measurement (response) and all collected clinical information with/without disease severity (see methods). The horizontal gray dashed line denotes the p-value equals 0.05, and the vertical gray dashed line denotes a manually selected threshold (t values = 2).
Figure 3.
Figure 3.. The temporal evolution of the human OC43 specific humoral immune response.
(A) The whisker bar graphs show the distribution of human OC43 receptor binding domain (RBD)-specific antibody titers and OC43-specific antibody mediated Fc-receptor binding profiles across moderate, severe, and non-survivor COVID-19 groups over the study time course. The solid black line represents the median and box boundary (upper and bottom). (B–D) The volcano plots show the pairwise comparisons across the three COVID-19 severity groups, (A) individuals that passed away within 28 days (deceased) vs. severe survivors; (B) subjects who experienced moderate disease vs. severe survivors; (C) subjects who ultimately passed away (deceased) vs. subjects who developed moderate disease, including human OC43 RBD-specific humoral immune data. (E) The correlation heatmap shows the pairwise Spearman correlation matrices between OC43-specific and SARS-CoV-2 antibody levels across three COVID-19 severity groups (moderate, severe, and non-survivors) across the study time course. The correlation coefficients were shown only if statistically significant (adjust p-value < 0.05) after Benjamini-Hochberg correction from multiple hypothesis testing. (F) The statistical evaluation of the effect of sample size. The spearman correlation is calculated by randomly selected ten samples per category for 500 runs (the deceased group in day interval [3,6), is not included since the number of samples is less than 10). The number of statistically significant correlations (larger than 0.6) is calculated and tested by the Mann-Whitney U test. Significance corresponds to adjusted P-values. (* p < 0.05, ** p < 0.01, *** p <0.001, **** p <0.0001).
Figure 4.
Figure 4.. SARS-CoV-2 S2-specific antibody functionality tracks with asymptomatic SARS-CoV-2 infection.
(A) The whisker box plots show the overall humoral immune response to OC43 RBD-spike titers across a community based SARS-CoV-2 infection cohort divided by individuals that were asymptomatic (symptoms level 0) or experienced symptoms (symptoms level 1 or level 2, based on degree of symptoms) pre- and post-infection. (B) The bar graphs illustrate the SARS-CoV-2 specific humoral immune response across the RBD, S, S1, and S2 antigens across the same community based surveillance study divided by the degree of symptoms (symptoms levels). The dots show the scaled values of each sample. A two-sample Wilcox test was used to evaluate statistical differences across different epitopes for all the symptom categories. Significance corresponds to adjusted P-values. (* p < 0.05, ** p < 0.01, *** p <0.001, **** p <0.0001).

Similar articles

References

    1. Jackson LA, Anderson EJ, Rouphael NG, Roberts PC, Makhene M, Coler RN, et al. An mRNA Vaccine against SARS-CoV-2 - Preliminary Report. N Engl J Med. 2020;383(20):1920–31. - PMC - PubMed
    1. Knoll MD, Wonodi C. Oxford-AstraZeneca COVID-19 vaccine efficacy. Lancet. 2021;397(10269):72–4. - PMC - PubMed
    1. Polack FP, Thomas SJ, Kitchin N, Absalon J, Gurtman A, Lockhart S, et al. Safety and Efficacy of the BNT162b2 mRNA Covid-19 Vaccine. N Engl J Med. 2020;383(27):2603–15. - PMC - PubMed
    1. Liu Y, Liu J, Plante KS, Plante JA, Xie X, Zhang X, et al. The N501Y spike substitution enhances SARS-CoV-2 transmission. bioRxiv. 2021. - PMC - PubMed
    1. Chen RE, Zhang X, Case JB, Winkler ES, Liu Y, VanBlargan LA, et al. Resistance of SARS-CoV-2 variants to neutralization by monoclonal and serum-derived polyclonal antibodies. Nat Med. 2021. - PMC - PubMed

Publication types

LinkOut - more resources