[Preprint]. 2021 May 12:2021.05.11.443693.
doi: 10.1101/2021.05.11.443693.

Modeling SARS-CoV-2 and Influenza Infections and Antiviral Treatments in Human Lung Epithelial Tissue Equivalents

Affiliations

Modeling SARS-CoV-2 and Influenza Infections and Antiviral Treatments in Human Lung Epithelial Tissue Equivalents

Hoda Zarkoob et al. bioRxiv. .

Update in

Abstract

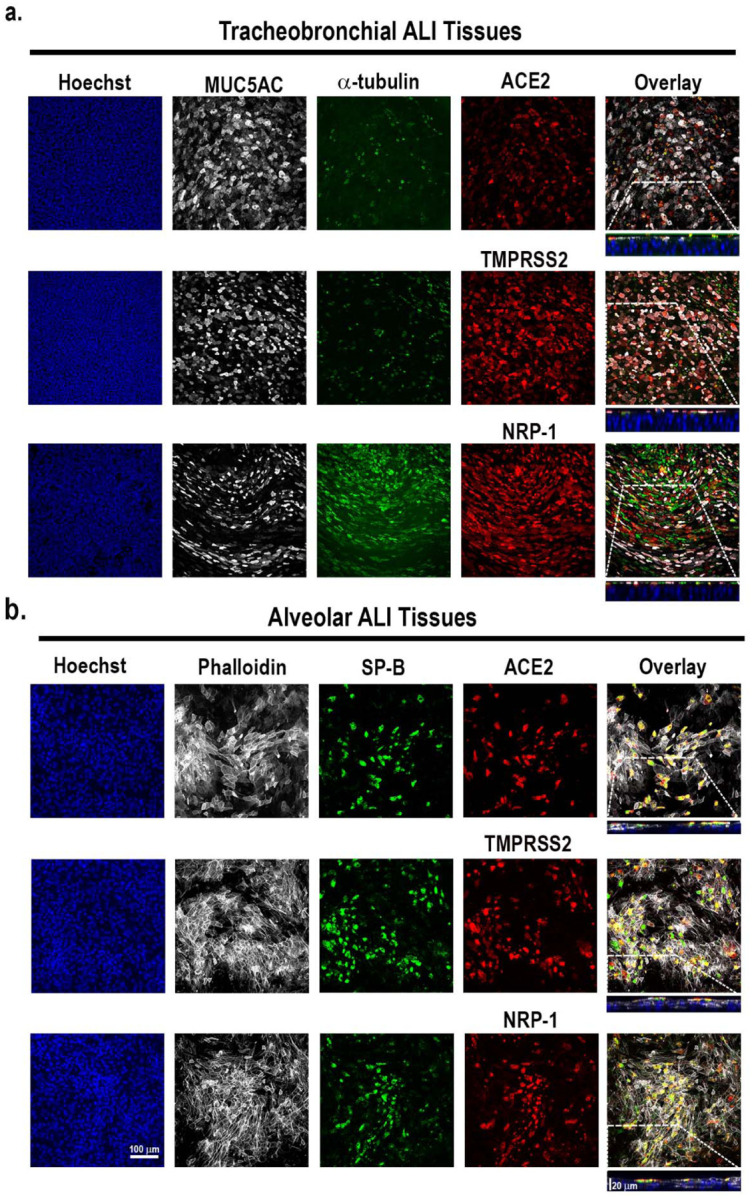
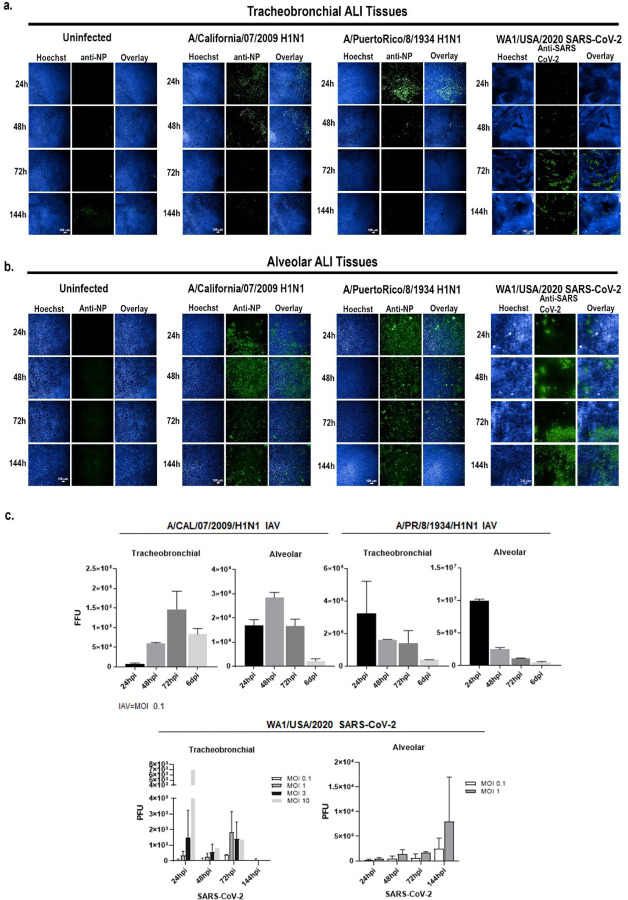
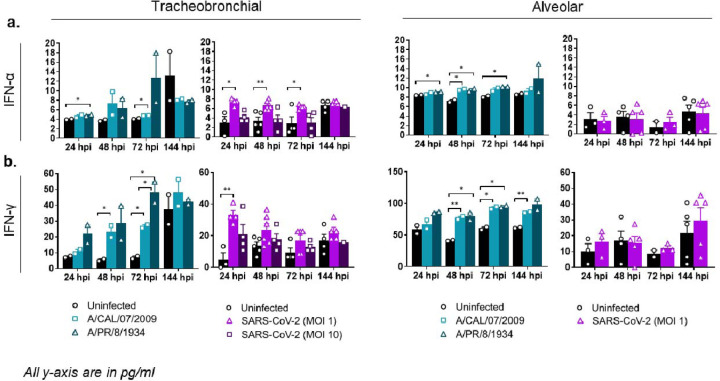
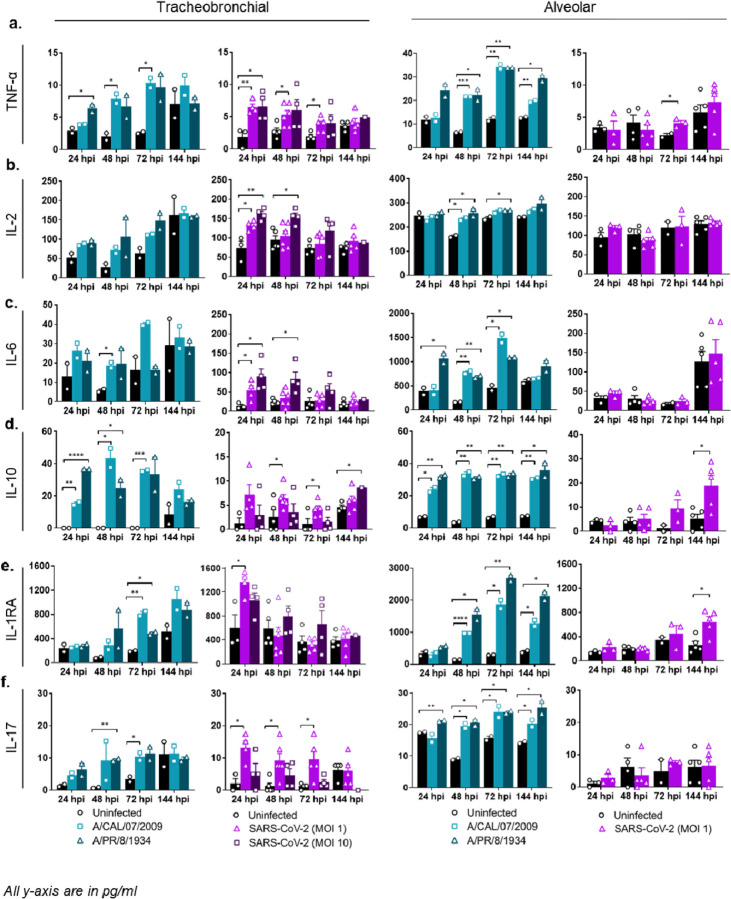
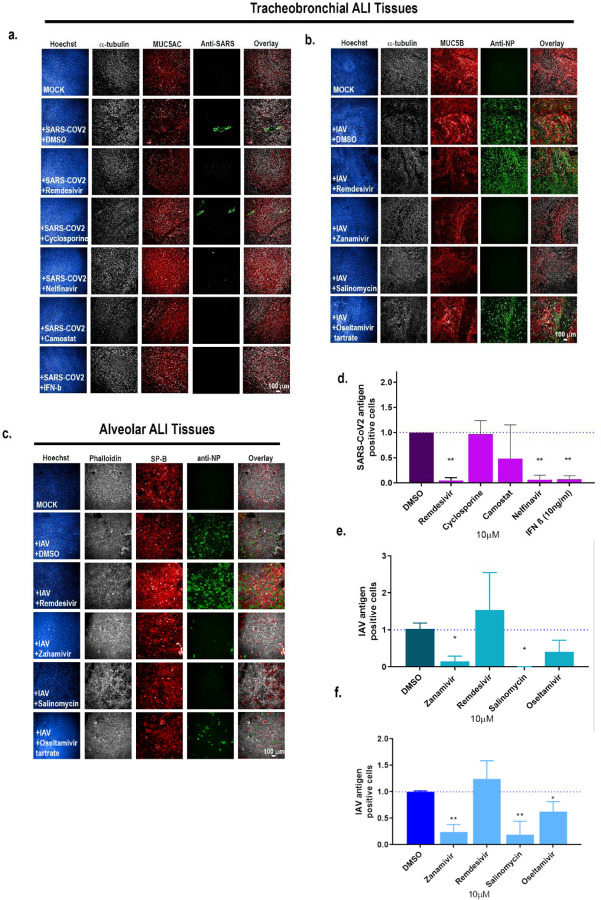
Severe acute respiratory syndrome coronavirus-2 (SARS-CoV-2) is the third coronavirus in less than 20 years to spillover from an animal reservoir and cause severe disease in humans. High impact respiratory viruses such as pathogenic beta-coronaviruses and influenza viruses, as well as other emerging respiratory viruses, pose an ongoing global health threat to humans. There is a critical need for physiologically relevant, robust and ready to use, in vitro cellular assay platforms to rapidly model the infectivity of emerging respiratory viruses and discover and develop new antiviral treatments. Here, we validate in vitro human alveolar and tracheobronchial tissue equivalents and assess their usefulness as in vitro assay platforms in the context of live SARS-CoV-2 and influenza A virus infections. We establish the cellular complexity of two distinct tracheobronchial and alveolar epithelial air liquid interface (ALI) tissue models, describe SARS-CoV-2 and influenza virus infectivity rates and patterns in these ALI tissues, the viral-induced cytokine production as it relates to tissue-specific disease, and demonstrate the pharmacologically validity of these lung epithelium models as antiviral drug screening assay platforms.


Conflict of interest statement

Conflict of Interest

There are no conflicts of interest to report.

Figures

Figure 1:
Figure 1:. Apical expression patterns of known SARS-CoV-2 entry co-factors in tracheobronchial and alveolar ALI tissue equivalents.
Post-day 21 tissues were stained with antibodies targeting hACE2, TMPRSS2, and NRP-1, as well as tissue-specific markers. a) Representative stained images of tracheobronchial ALI tissues with Hoechst (nuclei marker, blue), α -tubulin (ciliated cell marker, green), MUC5B (goblet cell marker, white) and hACE2 (top panel, red), TMPRSS2 (middle panel, red) or NRP-1 (bottom panel, red). The overlay image represents the maximum intensity projection of stained markers. The y/z plane cross section taken from the highlighted portion shows the selective apical expression of hACE2, TMPRSS2, and NRP-1. b) Representative stained images of alveolar ALI tissues with Hoechst (nuclei marker, blue), surfactant protein B (SP-B, ATII/pneumonocyte type II cell marker, green) and phalloidin (f-actin, white) co-stained with hACE2 (top panel, red), TMPRSS2 (middle panel, red) or NRP-1 (bottom panel, red). The overlay image represents the maximum intensity projection of stained markers and a y/z plane cross section from the highlighted portion shows the selective apical expression of hACE2, TMPRSS2, or NRP-1 in the tissues, contrasted to phalloidin, which is present throughout the tissue cross-section. Scale bar is 100 μm. Cross-section scale bar is 20 μm.
Figure 2:
Figure 2:. IAV and SARS-CoV-2 productively infect tracheobronchial and alveolar ALI tissue equivalents.
Tracheobronchial and alveolar ALI tissues were infected with IAV strains pH1N1 or PR8 (1×10e5 TCID50 units), or SARS-CoV-2 (1e5 TCID50 units), (n=3). Infected tissues were fixed for 24 hpi for IAV inoculated tissue, 36 hpi for SARS-CoV-2 inoculated tracheobronchial ALI tissue, or 144 hpi for SARS-CoV-2 inoculated alveolar ALI tissue and stained with antibodies against selected cell markers and virus antigens as indicated: a) Tracheobronchial ALI tissues were stained with anti-α-tubulin (ciliated cell marker, red), anti-MUC5AC or MUC5B (goblet cell markers, white), and anti-keratin 5 (basal cell marker, magenta), along with anti-IAV N protein (green, top three panels) or anti-SARS-CoV-2 (monoclonal antibody cocktail targeting S and N proteins, green, bottom two panels) as the marker of infected cells. b) Alveolar tissues were stained with anti-surfactant protein B (SP-B, ATII cell marker, red), phalloidin (F-actin, general cell marker, white) along with anti-IAV N protein (green top three panels) or anti-SARS-CoV-2 (green, bottom two panels) as the marker of infected cells. Scale bar is 100 μm and 200 μm in IAV and SARS-CoV-2 infected tissues, respectively.
Figure 3:
Figure 3:. IAV and SARS-CoV-2 exhibit different infection kinetics in tracheobronchial and alveolar ALI tissue equivalents.
Tracheobronchial and alveolar ALI tissues were infected with IAV pH1N1 or PR8 at approx. MOI of 0.1, and SARS-CoV-2 at MOI of 1 (fixed tissue samples shown) or as indicated in titer plots. Apical washes were collected and tissues fixed at 24, 48, 72 and 144 hpi. a) Tracheobronchial and b) alveolar ALI tissues were stained with anti-IAV N protein and anti-SARS-CoV-2 to label infected cells (shown in green) as well as the nuclear dye Hoechst (blue). c) Production of infectious virus from the apical chamber of tracheobronchial or alveolar ALI tissues after exposure to pH1N1 (MOI of 0.1), PR8 (MOI of 0.1), or SARS-CoV-2 (MOI of 0.1 and 1 for alveolar tissues; MOIs of 0.1, 1, 3, and 10 for tracheobronchial tissues) at 24, 48, 72, or 144 hpi. IAV titers were measured using a focus forming unit assay on LLC-MMK2 SIAT1 cells, SARS-CoV-2 was measured using plaque assay on Vero E6 cells, and expressed as total FFU (IAV) or PFU (SARS-CoV-2)/tissue. Data is represented as M±SD for a minimum of n=2 independent experiments/biological replicates. No virus was detected in uninfected controls (data not shown).
Figure 4:
Figure 4:. Alveolar and tracheobronchial ALI tissues produce tissue-specific chemokines and growth factors in response to IAV and SARS-CoV-2 infection.
Basal compartment media were collected from tracheobronchial (left two panels) or alveolar (right two panels) ALI tissues at indicated time-points and analyzed for cytokine and chemokine secretion by Luminex assay. IAV infected tissues (approx. MOI of 0.1) are represented in shades of teal, where light teal shows infection with the IAV pH1N1 strain and dark teal shows infection with the IAV PR8 strain, whereas SARS-CoV-2 infected tissues are represented in shades of purple, with progressing color from low MOI (1) to high MOI (10): (a) CCL2/MCP-1, (b) CCL3/MIP-1α, (c) IL-8, (d) CXCL10/IP-10, (e) G-CSF, (f) EN-RAGE/S100A. All measurements on y axis are in pg/ml. Data is represented as M±SEM for a minimum of n=2 independent experiments and/or biological replicates; Student t-test of IAV or SARS-CoV-2 infected tissues vs. uninfected controls at each timepoint: *p < 0.05, **p < 0.005, ***p < 0.0005, ****p < 0.00005.
Figure 5:
Figure 5:. Alveolar and tracheobronchial ALI tissues produce moderate levels of IFN in response to IAV and SARS-CoV-2 infection.
Basal compartment media were collected from tracheobronchial (left two panels) or alveolar (right two panels) ALI tissues at indicated time-points and analyzed for cytokine and chemokine secretion by Luminex assay. IAV infected tissues (approx. MOI=0.1) are represented in shades of teal, where light teal shows infection with the IAV pH1N1 strain and dark teal shows infection with the IAV PR8 strain, whereas SARS-CoV-2 infected tissues are represented in shades of purple, with progressing color from low MOI (1) to high MOI (10): (a) IFN-α, (b) IFN-γ. All measurements on y axis are in pg/ml. Data is represented as M±SEM for a minimum of n=2 independent experiments and/or biological replicates; Student t-test of IAV or SARS-CoV-2 infected tissues vs. uninfected controls at each timepoint: *p < 0.05, **p < 0.005, ***p < 0.0005, ****p < 0.00005.
Figure 6.
Figure 6.. Production of Th1/Th2/Th17 markers.
Basal compartment media were collected from tracheobronchial (left two panels) or alveolar (right two panels) ALI tissues at indicated time-points and analyzed for cytokine and chemokine secretion by Luminex assay. IAV infected tissues (MOI of 0.1) are represented in shades of teal, where light teal shows infection with the IAV pH1N1 strain and dark teal shows infection with the IAV PR8 strain, whereas SARS-CoV-2 infected tissues are represented in shades of purple, with progressing color from low MOI (1) to high MOI (10): (a) TNF-α, (b) IL-2, (c) IL-6, (d) IL-10, (e) IL-1RA, (f) IL-17. All measurements on y axis are in pg/ml. Data is represented as M±SEM for a minimum of n=2 independent experiments and/or biological replicates; Student t-test of IAV or SARS-CoV-2 infected tissues vs. uninfected controls at each timepoint: *p < 0.05, **p < 0.005, ***p < 0.0005, ****p < 0.00005.
Figure 7:
Figure 7:. Tracheobronchial and alveolar ALI tissue equivalents predictively measure antiviral compound response in the context of SARS-CoV-2 and IAV infection.
Selected compounds were added to the basal media chamber (10 μM final concentration) of the tracheobronchial and alveolar ALI tissues for 1 h and then infected with IAV PR8 (approx. MOI of 0.1), and SARS-CoV-2 (MOI of 0.1). IAV and SARS-CoV-2 infected tissues were fixed for 24 and 36 hpi, respectively, and stained with antibodies against selected cell markers and viral specific antigens. (a, b) Tracheobronchial ALI tissues were stained with anti-α-tubulin (ciliated cell marker, white), anti-MUC5AC or anti-MUC5B (goblet cell marker, red), along with anti-N protein (green, right five panels) and anti-SARS-CoV-2 (monoclonal antibody cocktail targeting S and N proteins, green) as the marker of infected cells. (c) Alveolar ALI tissues were stained with anti SP-B (ATII cell marker, red), phalloidin (F-actin, white), anti-N (green). Scale bar is 100 μm. (d, e) Image-based quantification of infected cells in compound treated and subsequent (d) SARS-CoV-2 or IAV infected tracheobronchial (e) or alveolar (f) ALI tissues. Data is represented as M±SD for a minimum of n=2 independent experiments and/or biological replicates; Student t-test of IAV or SARS-CoV-2 infected tissues vs. uninfected controls at each timepoint: *p < 0.05, **p < 0.005, ***p < 0.0005, ****p < 0.00005.

Similar articles

Cited by

References

    1. Zhu N., et al., A Novel Coronavirus from Patients with Pneumonia in China, 2019. New England Journal of Medicine, 2020. 382(8): p. 727–733. - PMC - PubMed
    1. Cucinotta D. and Vanelli M., WHO Declares COVID-19 a Pandemic. Acta Bio-Medica: Atenei Parmensis, 2020. 91(1): p. 157–160. - PMC - PubMed
    1. Chen R.E., et al., Resistance of SARS-CoV-2 variants to neutralization by monoclonal and serum-derived polyclonal antibodies. Nature Medicine, 2021. - PMC - PubMed
    1. Wang M., et al., Remdesivir and chloroquine effectively inhibit the recently emerged novel coronavirus (2019-nCoV) in vitro. Cell Research, 2020. 30(3): p. 269–271. - PMC - PubMed
    1. Blanco-Melo D., et al., Imbalanced Host Response to SARS-CoV-2 Drives Development of COVID-19. Cell, 2020. 181(5): p. 1036–1045.e9. - PMC - PubMed

Publication types

LinkOut - more resources