. 2021 Aug;64(8):1850-1865.
doi: 10.1007/s00125-021-05470-y. Epub 2021 May 20.

HAND2 is a novel obesity-linked adipogenic transcription factor regulated by glucocorticoid signalling

Affiliations

HAND2 is a novel obesity-linked adipogenic transcription factor regulated by glucocorticoid signalling

Maude Giroud et al. Diabetologia. 2021 Aug.

Abstract

Aims/hypothesis: Adipocytes are critical cornerstones of energy metabolism. While obesity-induced adipocyte dysfunction is associated with insulin resistance and systemic metabolic disturbances, adipogenesis, the formation of new adipocytes and healthy adipose tissue expansion are associated with metabolic benefits. Understanding the molecular mechanisms governing adipogenesis is of great clinical potential to efficiently restore metabolic health in obesity. Here we investigate the role of heart and neural crest derivatives-expressed 2 (HAND2) in adipogenesis.

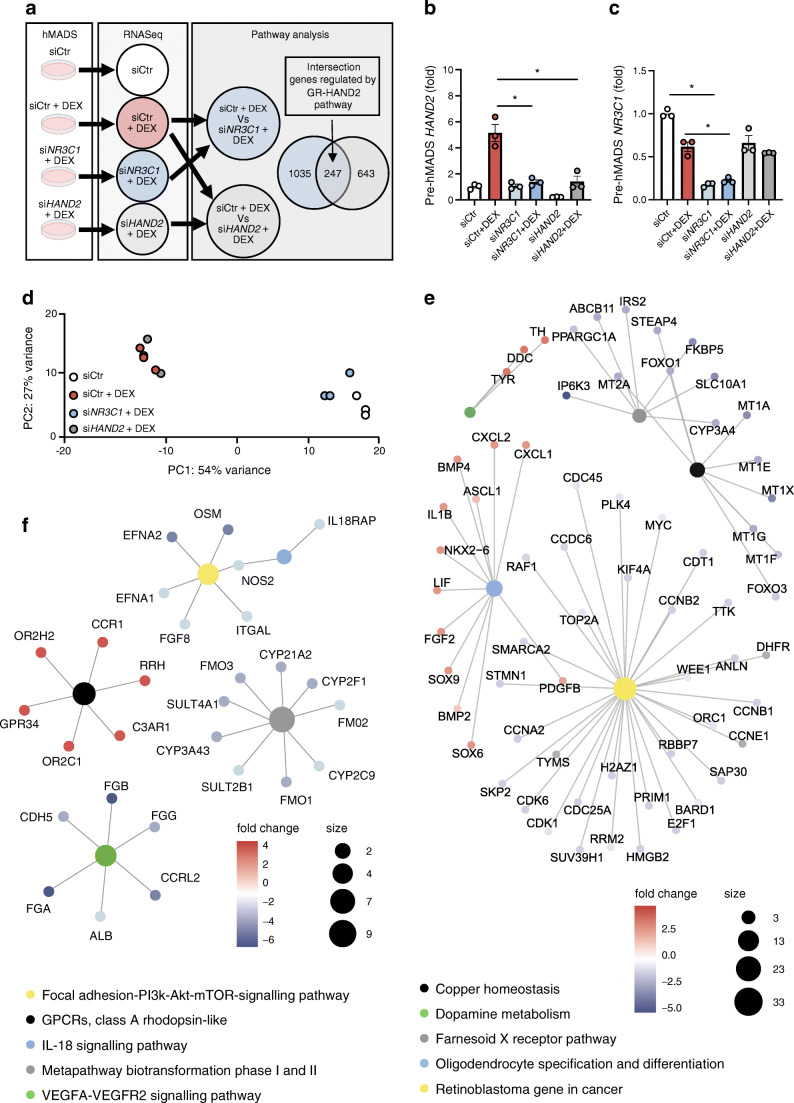
Methods: Human white adipose tissue (WAT) was collected from two cross-sectional studies of 318 and 96 individuals. In vitro, for mechanistic experiments we used primary adipocytes from humans and mice as well as human multipotent adipose-derived stem (hMADS) cells. Gene silencing was performed using siRNA or genetic inactivation in primary adipocytes from loxP and or tamoxifen-inducible Cre-ERT2 mouse models with Cre-encoding mRNA or tamoxifen, respectively. Adipogenesis and adipocyte metabolism were measured by Oil Red O staining, quantitative PCR (qPCR), microarray, glucose uptake assay, western blot and lipolysis assay. A combinatorial RNA sequencing (RNAseq) and ChIP qPCR approach was used to identify target genes regulated by HAND2. In vivo, we created a conditional adipocyte Hand2 deletion mouse model using Cre under control of the Adipoq promoter (Hand2AdipoqCre) and performed a large panel of metabolic tests.

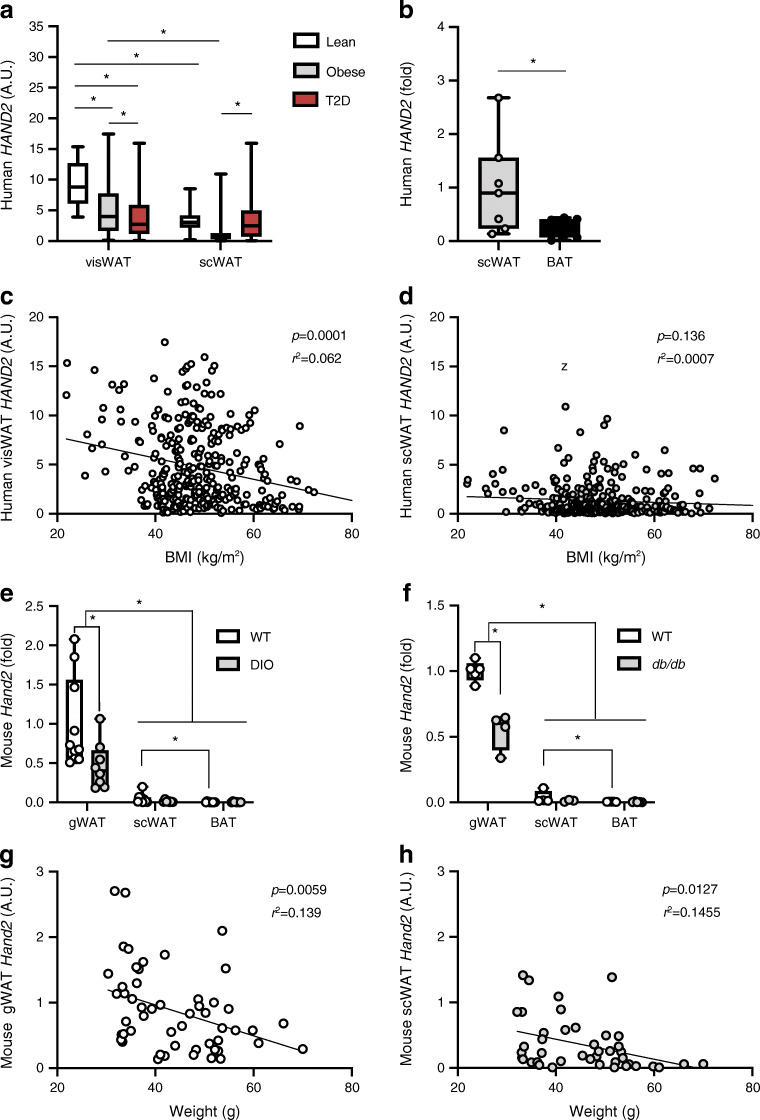
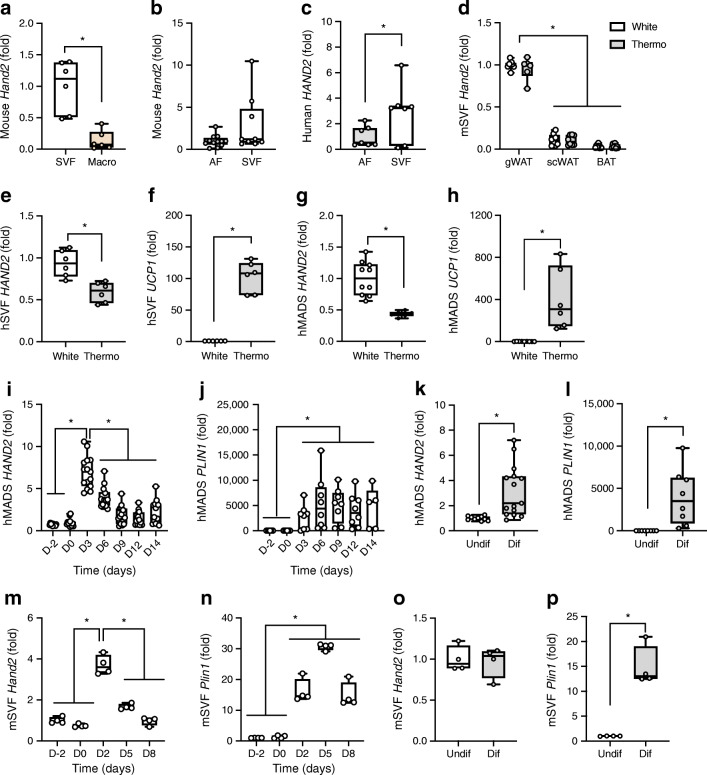
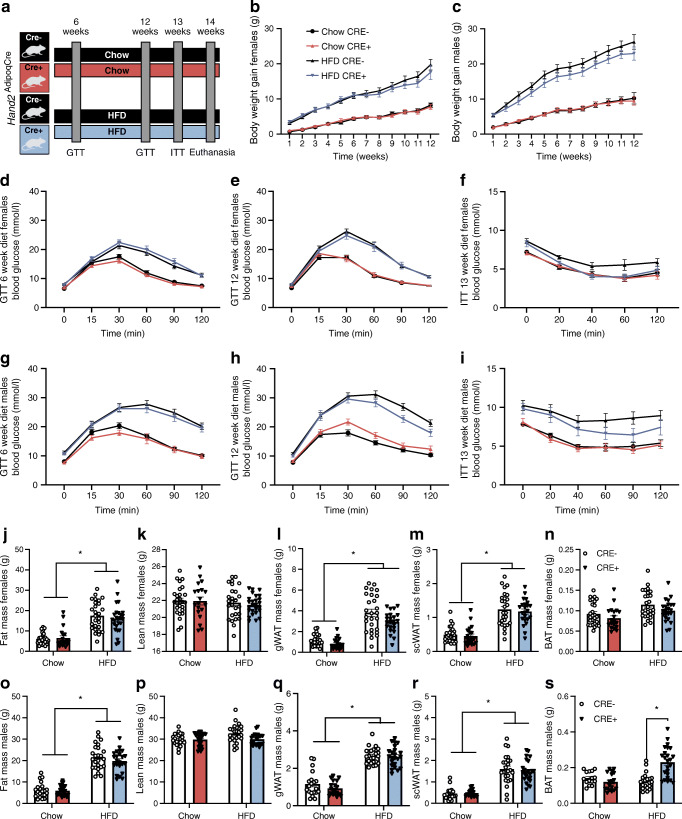
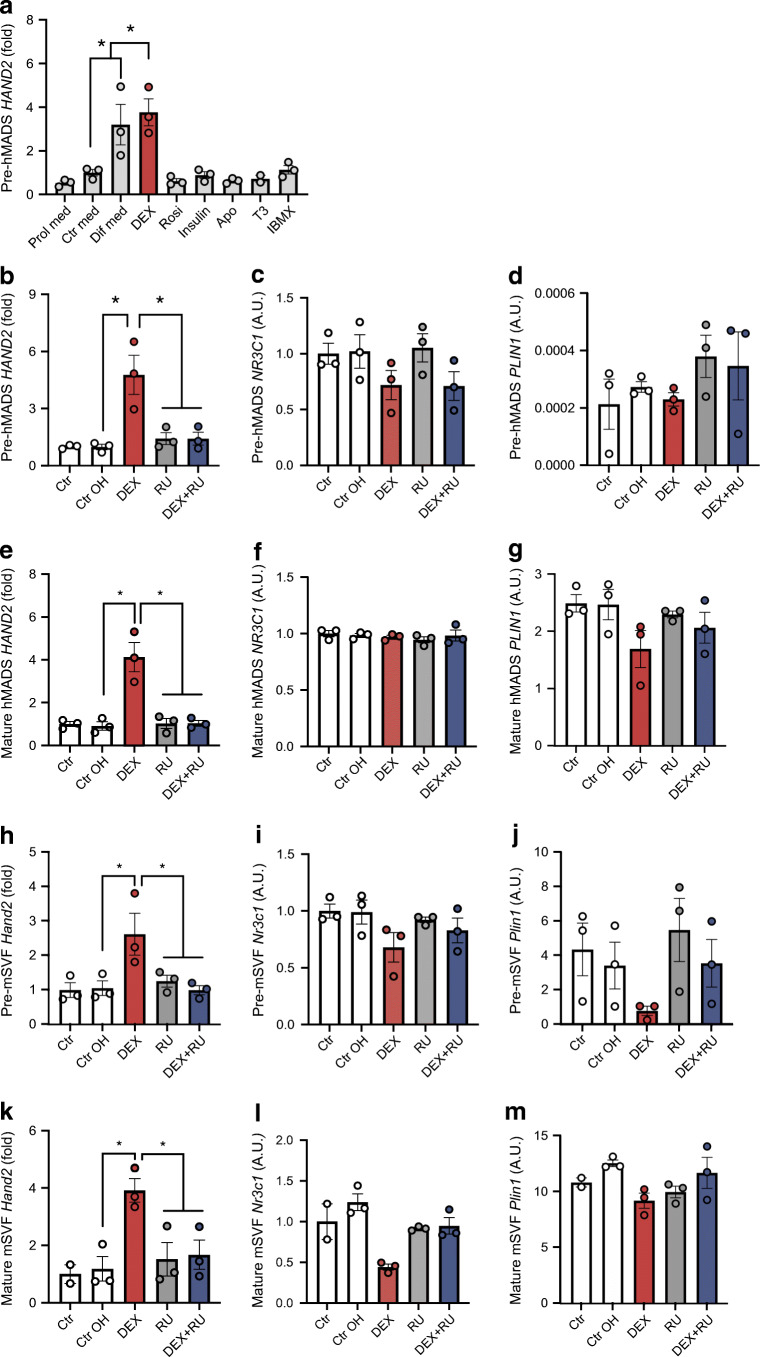
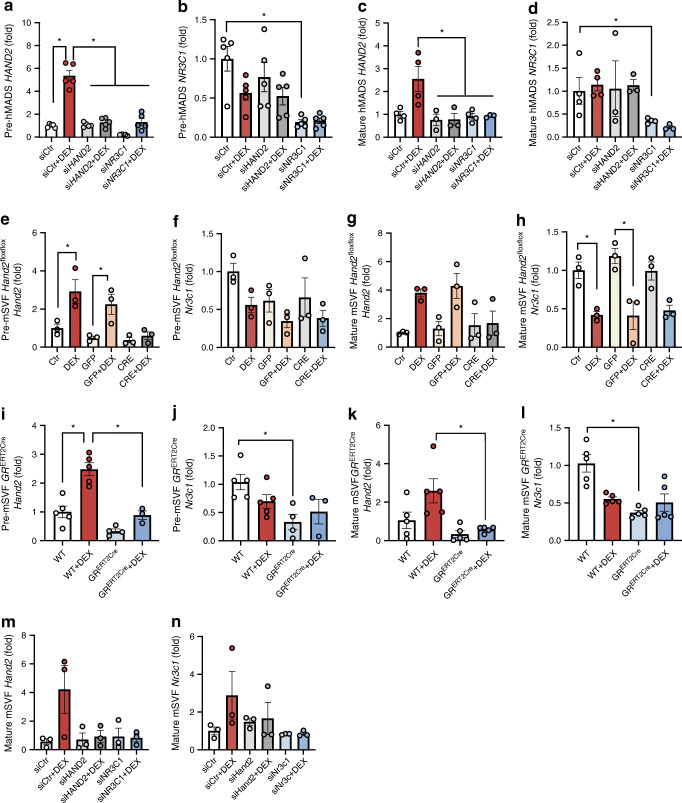
Results: We found that HAND2 is an obesity-linked white adipocyte transcription factor regulated by glucocorticoids that was necessary but insufficient for adipocyte differentiation in vitro. In a large cohort of humans, WAT HAND2 expression was correlated to BMI. The HAND2 gene was enriched in white adipocytes compared with brown, induced early in differentiation and responded to dexamethasone (DEX), a typical glucocorticoid receptor (GR, encoded by NR3C1) agonist. Silencing of NR3C1 in hMADS cells or deletion of GR in a transgenic conditional mouse model results in diminished HAND2 expression, establishing that adipocyte HAND2 is regulated by glucocorticoids via GR in vitro and in vivo. Furthermore, we identified gene clusters indirectly regulated by the GR-HAND2 pathway. Interestingly, silencing of HAND2 impaired adipocyte differentiation in hMADS and primary mouse adipocytes. However, a conditional adipocyte Hand2 deletion mouse model using Cre under control of the Adipoq promoter did not mirror these effects on adipose tissue differentiation, indicating that HAND2 was required at stages prior to Adipoq expression.

Conclusions/interpretation: In summary, our study identifies HAND2 as a novel obesity-linked adipocyte transcription factor, highlighting new mechanisms of GR-dependent adipogenesis in humans and mice.

Data availability: Array data have been submitted to the GEO database at NCBI (GSE148699).

Keywords: Adipocytes; Dexamethasone; Differentiation; Glucocorticoid receptor; HAND2; Human adipose tissue; Mesenchymal stem cells; Obesity; Transcription factor; hMADS.


Figures

Fig. 1
Fig. 1
White adipocyte HAND2 is correlated to obesity in mice and humans. (a, b) HAND2 expression in visWAT vs scWAT from lean, obese or diabetic participants (n = 318 participants; cohort 1) (a), and in human scWAT vs BAT (n = 7 individuals) (b). (c, d) HAND2 expression correlated with BMI in visWAT (c) and scWAT (d) (n = 318 participants; cohort 1). (e, f) Hand2 expression in wild-type vs DIO mice (n = 10 mice) (e) and in WT vs db/db mice (n = 5 mice) (f). (g, h) Hand2 expression correlated with body weight in mouse gWAT (g) and scWAT (h) (n = 54 mice). Data are presented as arbitrary units representing copy number of HAND2 normalised to HPRT1 (a, c, d) or Tbp (g, h); as fold change compared to scWAT (b); or as fold change compared to gWAT/WT (e, f). Statistics: one-way ANOVA with Tukey test (a), two-tailed paired t test (b), correlation (c, d, g, h), two-way ANOVA with Tukey test (e, f). Data are presented as median with upper and lower quartile ± maximum and minimum (a, b, e, f). Statistical significance is indicated by *p < 0.05. A.U., arbitrary units; T2D, type 2 diabetes; WT, wild-type
Fig. 2
Fig. 2
HAND2 is induced in early differentiation and expressed in both pre-adipocytes and mature adipocytes. (ac) Hand2 expression in mSVF vs macrophages (n = 6 replicates) (a), vs adipocyte fraction (AF n = 12 replicates, SVF n = 9 replicates) (b) and in human AF vs hSVF (n = 7 replicates) (c). (d) Hand2 expression in mSVF from different fat depots differentiated using rosiglitazone into white or thermogenic adipocytes (n = 8 replicates). (e, f) HAND2 (e) and UCP1 (f) expression in hSVF differentiated into adipocytes (White n = 9 replicates, Thermo n = 6 replicates). (g, h) HAND2 (g) and UCP1 (h) expression in hMADS mature adipocytes (White n = 10 replicates, Thermo n = 6 replicates). (i, j) HAND2 (i) and PLIN1 (j) expression in hMADS cells during differentiation (n = 9–15 replicates). (k, l) HAND2 (k) and PLIN1 (l) expression in hMADS pre-adipocytes and mature adipocytes (n = 12 replicates). (m, n) Hand2 (m) and Plin1 (n) expression during mSVF differentiation (n = 4 replicates). (o, p) Hand2 (o) and Plin1 (p) expression in mSVF pre-adipocytes and mature adipocytes (n = 4 replicates). Data are presented as fold change compared to the condition mSVF (a); to the condition AF (b, c); to the condition gWAT/White (d); to the condition White (e–h); to the condition D-2 (i, j, m, n); to the condition Undif (k, l, o, p). Statistics: two-tailed unpaired t test (a, b, c, e, f, g, h, k, l, o, p); one-way ANOVA with Tukey test (i, j, m, n), two-way ANOVA with Tukey test (d); median with upper and lower quartile ± maximum and minimum (a–p). Statistical significance is indicated by *p < 0.05. AF, adipocyte fraction; D, day; Dif, differentiated; Macro, macrophages; Thermo, thermogenic; Undif, undifferentiated
Fig. 3
Fig. 3
Loss of HAND2 impairs adipocyte differentiation. (a) Experimental protocol. (b) HAND2 mRNA expression was measured day 0 and day 2 (n = 6 replicates). (c) Heat map, generated from the microarray data, of the most inhibited genes (n = 4–5 replicates). (df) Gene expression of adipogenesis markers (n = 4 replicates). (gj) Oil Red O staining of hMADS cells (g, h) (n = 4 replicates) and mSVF (i, j) transfected with siHand2 2 days prior to induction and collected at day 6 (n = 12 replicates). (km) Hand2 (k), Plin1 (l) and Pparg (m) expression in mSVF transfected with siHand2 2 days prior to induction and collected at day 0 and day 2 following the induction. Data were presented as fold change compared with the condition D0/siCtr (b, km); to the condition siCtr (df, h). Statistics: two-way ANOVA with Tukey test (b, km), two-tailed unpaired t test (df, h, j); median with upper and lower quartile ± maximum and minimum (b, d, e, f, h, j); mean ± SEM (km). Statistical significance is indicated by *p < 0.05. Ctr, control; D, day; ORO, Oil Red O; ROI, region of interest
Fig. 4
Fig. 4
Metabolic phenotyping of Hand2AdipoqCre mice fed an HFD. (a) Hand2AdipoqCre (CRE+) and wild-type (CRE−) littermates, females and males, were fed an HFD (60%) for 6 or 12 weeks. Several metabolic variables were measured. (b, c) Body weight gain in females (b) and males (c). (di) GTT in females (d) and males (g) after 6 weeks of HFD diet; GTT and ITT in females (e, f) and males (h, i) after 12 weeks of HFD diet. (js) Final measurement of body composition (j, k, o, p) and adipose depot weight in females (ln) and males (qs). Each variable has been measured in three cohorts in females (Chow CRE− n=27 mice, Chow CRE+ n=20 mice, HFD CRE− n=27 mice, HFD CRE+ n=24 mice) and males (Chow CRE− n=21 mice, Chow CRE+ n=26 mice, HFD CRE− n=25 mice, HFD CRE+ n=23 mice). Statistics: two-way ANOVA with Tukey test; mean ± SEM (bs). Statistical significance is indicated by *p < 0.05
Fig. 5
Fig. 5
DEX regulates HAND2 expression. (a) HAND2 expression in hMADS pre-adipocytes. Proliferation media (DMEM 10% serum), control media (DMEM + F12), differentiation media (DMEM + F12 + 1 μmol/l DEX + 100 nmol/l rosiglitazone + 10 nmol/l insulin + 10 μg/ml apotransferrin + 0.2 nmol/l T3 + 500 μmol/l IBMX), rosiglitazone (DMEM + F12 + 100 nmol/l rosiglitazone), DEX (DMEM + F12 + 1 μmol/l DEX), insulin (DMEM + F12 + 10 nmol/l insulin), apo-transferrin (DMEM + F12 + 10 μg/ml apotransferrin), T3 (DMEM + F12 + 0.2 nmol/l T3), IBMX (DMEM + F12 + 500 μmol/l IBMX) (n = 3 replicates). (bg) HAND2, NR3C1 and PLIN1 expression in hMADS pre-adipocytes (n = 3 replicates) (bd) and mature adipocytes (n = 3 replicates) (eg), treated with 2% ethanol, with DEX (1 μmol/l) and/or RU-486 (2 μmol/l) for 12 h (n = 3 replicates). (hm) Hand2, Nr3c1 and Plin1 expression in mSVF pre-adipocytes (n = 3 replicates) (hj) and mature adipocytes (n = 3 replicates) (km), treated with DEX (1 μmol/l) and/or RU-486 (2 μmol/l) for 12 h. Data are presented as fold change compared with the condition Ctr med (a), to the condition Ctr (b, e, h, k). Data are presented as arbitrary units representing copy number normalised to TBP (c, d, f, g, i, j, l, m). Statistics: one-way ANOVA with Tukey test; mean ± SEM. Statistical significance is indicated by *p < 0.05. Apo, apo-transferrin; Ctr, control; Ctr OH, 2% ethanol; Dif, differentiation; IBMX, isobutylmethylxanthine; med, media; Rosi, rosiglitazone; RU, RU-486
Fig. 6
Fig. 6
HAND2 is regulated by GCs via the GR. (ad) HAND2 and NR3C1 expression in hMADS pre-adipocytes (n = 5 replicates) (a,b) and mature adipocytes (n = 4 replicates) (c,d), transfected with siHAND2 or siNR3C1, treated or not with DEX (1 μmol/l) for 12 h. (eh) Hand2 and Nr3c1 expression in mSVF pre-adipocytes (n = 3 replicates) (e,f) and mature adipocytes (n = 3 replicates) (g,h) from Hand2flox/flox mice. (il) Hand2 and Nr3c1 expression in mSVF in pre-adipocytes (n = 3–5 replicates) (i, j) and differentiated adipocytes (n = 5 replicates) (k,l), all treated with tamoxifen and treated or not with DEX (1 μmol/l) for 12 h from GRERT2Cre mice. (m,n) Hand2 and Nr3c1 expression in mSVF differentiated adipocytes and transfected with siHand2 or siNr3c1 24 h before DEX treatment (1 μmol/l) for 12 h. Data are presented as fold change compared to the condition siCtr (ad, m,n); to the condition Ctr (eh), to the condition WT (il). Statistics: two-way ANOVA with Tukey test; mean ± SEM (an). Statistical significance is indicated by *p < 0.05, WT, wild-type
Fig. 7
Fig. 7
Gene networks during adipocyte differentiation regulated by the GR–HAND2 pathway. (a) Experimental protocol: hMADS pre-adipocytes were transfected with siNR3C1 or siHAND2 36 h prior to a 12 h treatment with DEX (1 μmol/l). Pathway analysis was performed on the genes regulated by NR3C1 and commonly regulated by NR3C1 and HAND2 (n = 3 replicates). (bc) qPCR analysis of HAND2 and NR3C1 gene expression. (d) Principal component analyses of the RNAseq data. (e,f) GO pathway analysis of siCtr + DEX vs siNR3C1 + DEX (e) and of the intersection between siCtr + DEX vs siNR3C1 + DEX and siCtr + DEX vs siHAND2 + DEX (f). Data are presented as fold change compared with the condition siCtr (b,c). Statistics: two-way ANOVA with Tukey test; mean ± SEM (b,c). Statistical significance is *p < 0.05. GPCR, G protein-coupled receptors; mTOR, mammalian target of rapamycin; PC, principal component; PI3K, phosphatidylinositol 3-kinase; VEGF, vascular endothelial growth factor

References

    1. Bartelt A, Heeren J. Adipose tissue browning and metabolic health. Nat Rev Endocrinol. 2014;10(1):24–36. doi: 10.1038/nrendo.2013.204. - DOI - PubMed
    1. Lowe CE, O’Rahilly S, Rochford JJ. Adipogenesis at a glance. J Cell Sci. 2011;124(16):2681–2686. doi: 10.1242/jcs.079699. - DOI - PubMed
    1. Petrovic N, Walden TB, Shabalina IG, Timmons JA, Cannon B, Nedergaard J. Chronic peroxisome proliferator-activated receptor gamma (PPARgamma) activation of epididymally derived white adipocyte cultures reveals a population of thermogenically competent, UCP1-containing adipocytes molecularly distinct from classic brown adipocytes. J Biol Chem. 2010;285(10):7153–7164. doi: 10.1074/jbc.M109.053942. - DOI - PMC - PubMed
    1. Buren J, Liu H, Jensen J, Eriksson J (2002) Dexamethasone impairs insulin signalling and glucose transport by depletion of insulin receptor substrate-1, phosphatidylinositol 3-kinase and protein kinase B in primary cultured rat adipocytes. Eur J Endocrinol 419–429. 10.1530/eje.0.1460419 - PubMed
    1. Zinker B, Mika A, Nguyen P, et al. Liver-selective glucocorticoid receptor antagonism decreases glucose production and increases glucose disposal, ameliorating insulin resistance. Metabolism. 2007;56(3):380–387. doi: 10.1016/j.metabol.2006.10.021. - DOI - PubMed

Publication types

MeSH terms

Substances