. 2021 Dec;31(12):9620-9627.
doi: 10.1007/s00330-021-08046-x. Epub 2021 May 20.

Liver fibrosis staging by deep learning: a visual-based explanation of diagnostic decisions of the model

Affiliations

Liver fibrosis staging by deep learning: a visual-based explanation of diagnostic decisions of the model

Yunchao Yin et al. Eur Radiol. 2021 Dec.

Abstract

Objectives: Deep learning has been proven to be able to stage liver fibrosis based on contrast-enhanced CT images. However, until now, the algorithm is used as a black box and lacks transparency. This study aimed to provide a visual-based explanation of the diagnostic decisions made by deep learning.

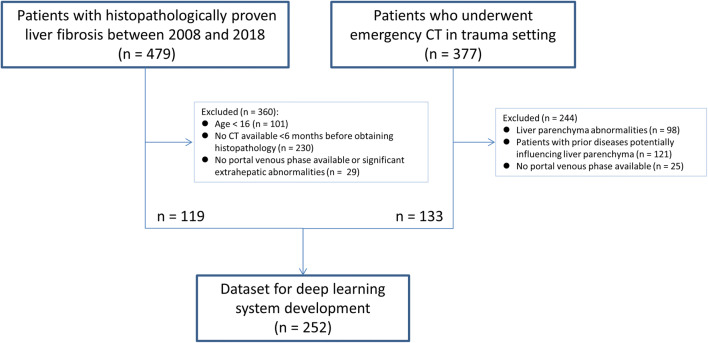
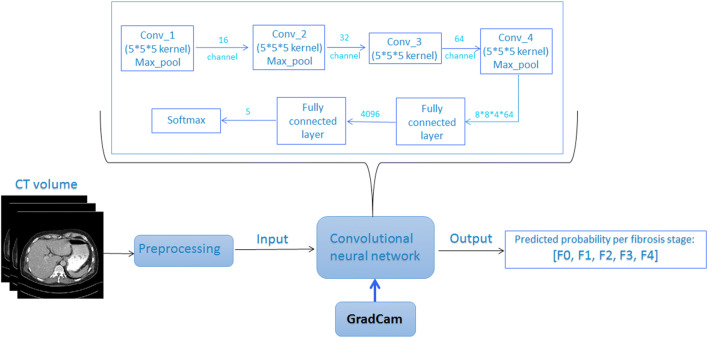
Methods: The liver fibrosis staging network (LFS network) was developed at contrast-enhanced CT images in the portal venous phase in 252 patients with histologically proven liver fibrosis stage. To give a visual explanation of the diagnostic decisions made by the LFS network, Gradient-weighted Class Activation Mapping (Grad-cam) was used to produce location maps indicating where the LFS network focuses on when predicting liver fibrosis stage.

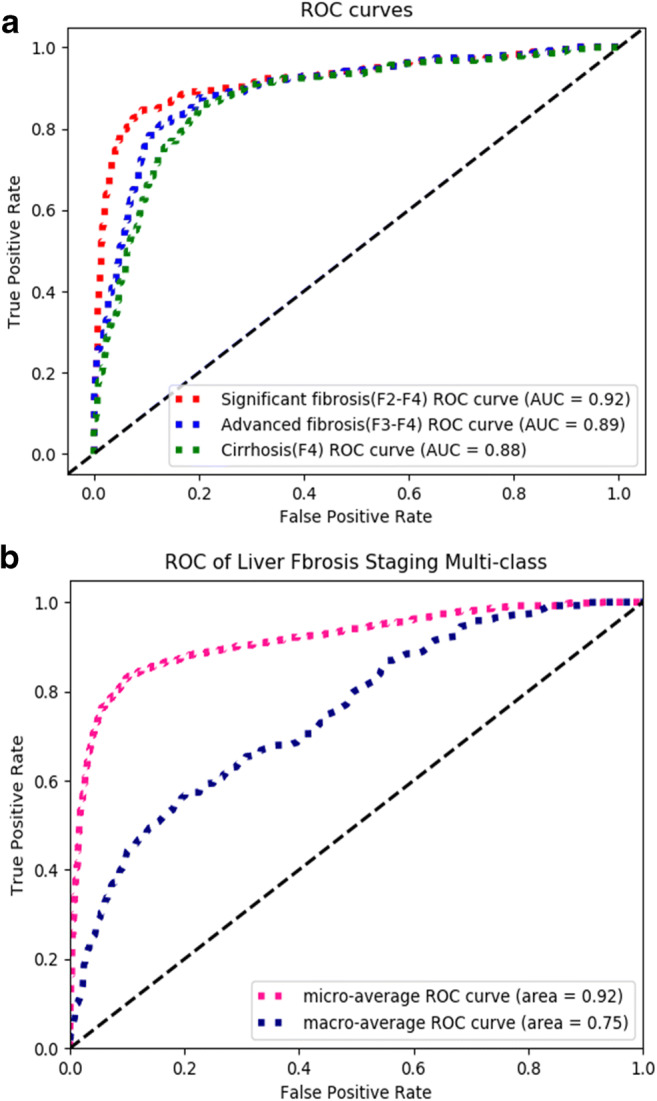
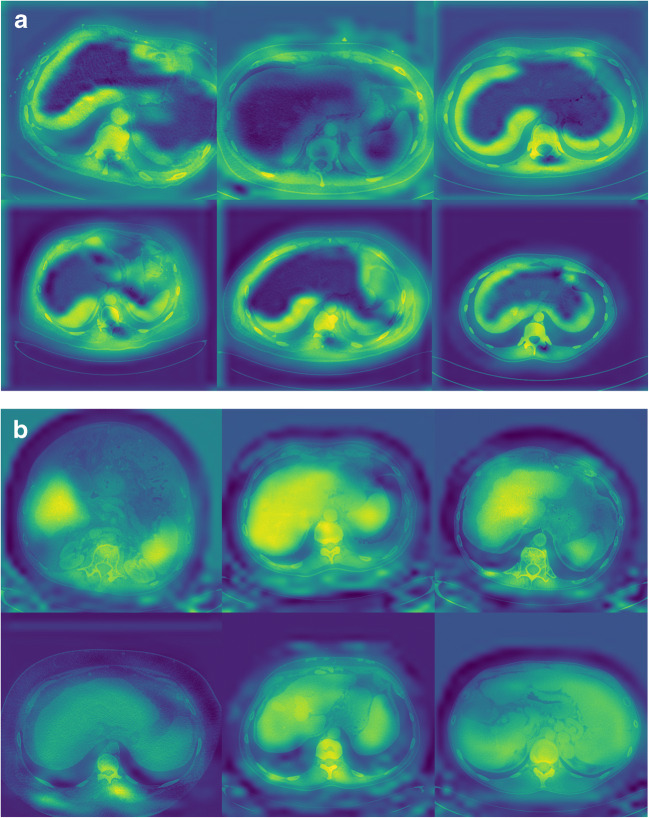
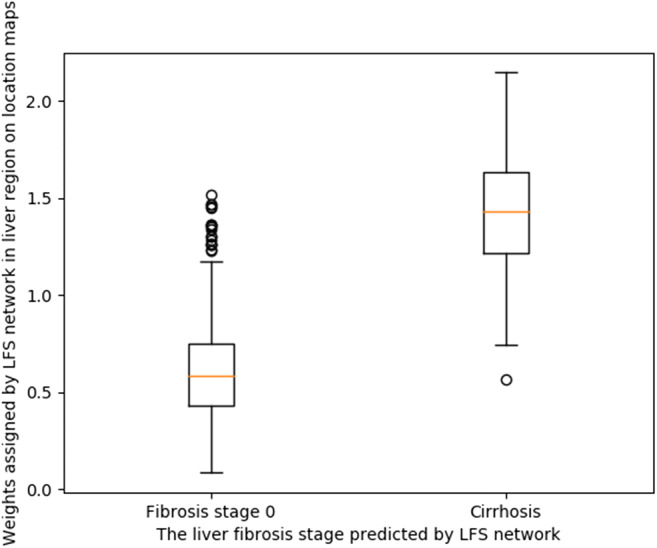
Results: The LFS network had areas under the receiver operating characteristic curve of 0.92, 0.89, and 0.88 for staging significant fibrosis (F2-F4), advanced fibrosis (F3-F4), and cirrhosis (F4), respectively, on the test set. The location maps indicated that the LFS network had more focus on the liver surface in patients without liver fibrosis (F0), while it focused more on the parenchyma of the liver and spleen in case of cirrhosis (F4).

Conclusions: Deep learning methods are able to exploit CT-based information from the liver surface, liver parenchyma, and extrahepatic information to predict liver fibrosis stage. Therefore, we suggest using the entire upper abdomen on CT images when developing deep learning-based liver fibrosis staging algorithms.

Key points: • Deep learning algorithms can stage liver fibrosis using contrast-enhanced CT images, but the algorithm is still used as a black box and lacks transparency. • Location maps produced by Gradient-weighted Class Activation Mapping can indicate the focus of the liver fibrosis staging network. • Deep learning methods use CT-based information from the liver surface, liver parenchyma, and extrahepatic information to predict liver fibrosis stage.

Keywords: Algorithms; Deep learning; Liver cirrhosis; Neural networks, computer; Tomography, X-ray computed.


Conflict of interest statement

The authors of this manuscript declare no relationships with any companies whose products or services may be related to the subject matter of the article.

Figures

Fig. 1
Fig. 1
Flowchart of patient inclusion. Abbreviation: CT = computed tomography
Fig. 2
Fig. 2
Overall scheme of liver fibrosis staging by deep learning. The computed tomography (CT) scan was first pre-processed by tissue windowing and standardized to [0,1]. Then, 32 consecutive slices of the 3D segmented liver were randomly selected as a patch per training iteration to feed into the convolutional neural network. The network put out the array of predicted probabilities at fibrosis stage (F0–F4). During testing of the trained liver fibrosis staging network, Grad-Cam was integrated between the third convolutional layer and the final convolutional layer to generate the maps showing the location of the network’s focus. Abbreviations: CT: computed tomography; Conv: convolutional layer; Max_pool: maximum pooling layer; GradCam: Gradient-weighted Class Activation Mapping; 5*5 kernel: a kernel with size [5] is used to extract features in the convolutional layer; channel: number of kernels applied in between convolutional layers; Softmax: softmax activation function
Fig. 3
Fig. 3
Receiver operating characteristic (ROC) curves of the test sets. a ROC curves of the predicted liver fibrosis severity on the test sets, including significant fibrosis, advanced fibrosis, and cirrhosis. b Macro-averaged ROC curve reducing the F0–F4 stages’ classification to multiple sets of two-class classifications, and micro-averaged ROC curve averaging each sample of an aggregate result
Fig. 4
Fig. 4
a Shown are location maps overlaid on axial computed tomography images of the upper abdomen at different levels in patients without liver fibrosis (stage F0). The liver surface is highlighted in these location maps, which indicates that information exploited from the liver surface contributed to the convolutional neural network's prediction of F0 liver fibrosis. b Shown are location maps overlaid on axial computed tomography images of the upper abdomen at different levels in patients with cirrhosis (stage F4). The liver parenchyma and spleen are highlighted in these location maps, which indicates that information exploited from the liver parenchyma and spleen contributed to the convolutional neural network’s prediction of F4 liver fibrosis (cirrhosis)
Fig. 5
Fig. 5
Distribution of mean weights assigned by the liver fibrosis staging (LFS) network in the liver parenchyma on the location maps. The weights represent the importance of the liver parenchyma on CT for the LFS network when making diagnostic decisions. The two groups are divided according to the liver fibrosis stage predicted by the LFS network

References

    1. Lee UE, Friedman SL. Mechanisms of hepatic fibrogenesis. Best Pract Res Clin Gastroenterol. 2011;25:195–206. doi: 10.1016/j.bpg.2011.02.005. - DOI - PMC - PubMed
    1. Böttcher K, Pinzani M. Pathophysiology of liver fibrosis and the methodological barriers to the development of anti-fibrogenic agents. Adv Drug Deliv Rev. 2017;121:3–8. doi: 10.1016/j.addr.2017.05.016. - DOI - PubMed
    1. Thampanitchawong P, Piratvisuth T. Liver biopsy: complications and risk factors. World J Gastroenterol. 1999;5:301–304. doi: 10.3748/wjg.v5.i4.301. - DOI - PMC - PubMed
    1. Mehta SH, Lau B, Afdhal NH, Thomas DL. Exceeding the limits of liver histology markers. J Hepatol. 2009;50:36–41. doi: 10.1016/j.jhep.2008.07.039. - DOI - PMC - PubMed
    1. Standish RA, Cholongitas E, Dhillon A, Burroughs AK, Dhillon AP. An appraisal of the histopathological assessment of liver fibrosis. Gut. 2006;55:569–578. doi: 10.1136/gut.2005.084475. - DOI - PMC - PubMed