. 2021 Nov;47(10-11):859-876.
doi: 10.1007/s10886-021-01276-9. Epub 2021 May 20.

Ocean Acidification Amplifies the Olfactory Response to 2-Phenylethylamine: Altered Cue Reception as a Mechanistic Pathway?

Affiliations

Ocean Acidification Amplifies the Olfactory Response to 2-Phenylethylamine: Altered Cue Reception as a Mechanistic Pathway?

Paula Schirrmacher et al. J Chem Ecol. 2021 Nov.

Abstract

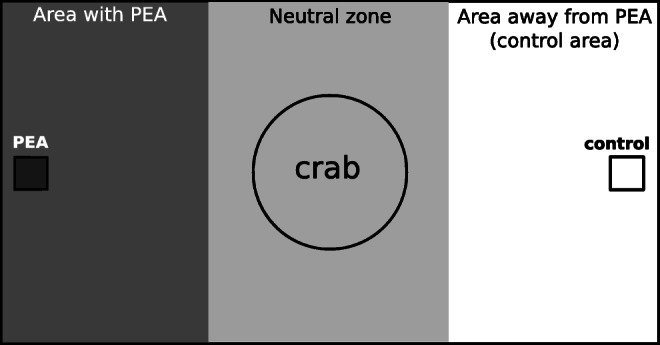
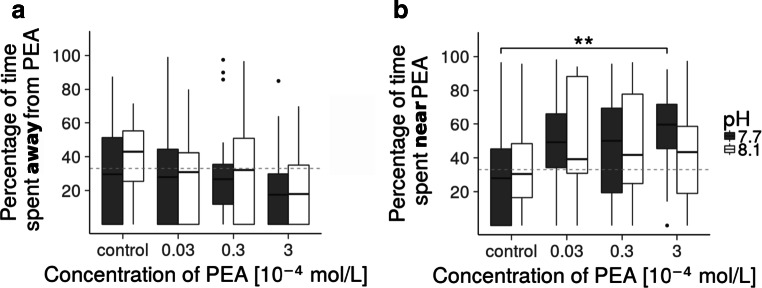
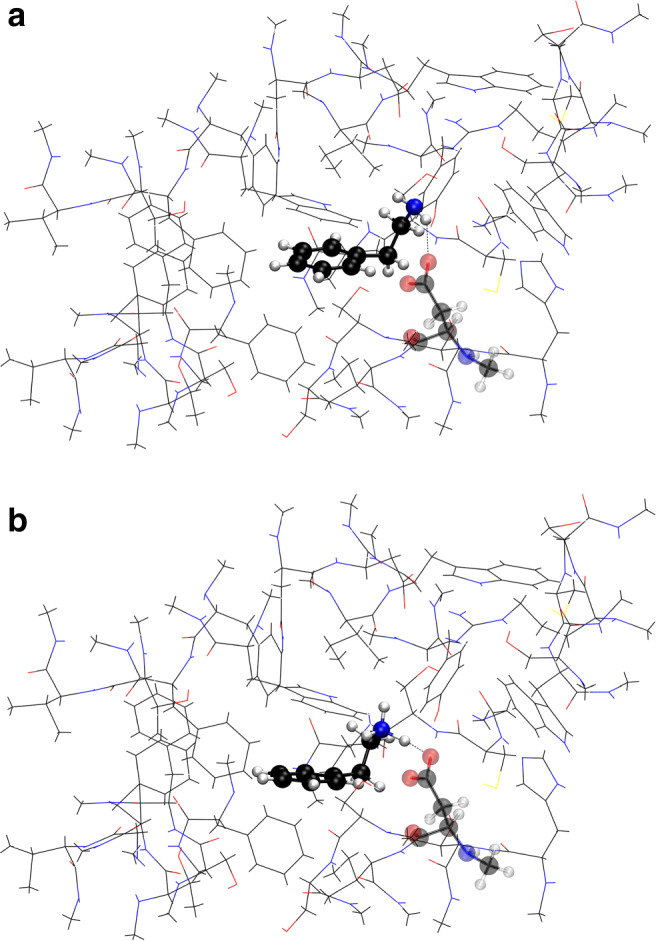
With carbon dioxide (CO2) levels rising dramatically, climate change threatens marine environments. Due to increasing CO2 concentrations in the ocean, pH levels are expected to drop by 0.4 units by the end of the century. There is an urgent need to understand the impact of ocean acidification on chemical-ecological processes. To date, the extent and mechanisms by which the decreasing ocean pH influences chemical communication are unclear. Combining behaviour assays with computational chemistry, we explore the function of the predator related cue 2-phenylethylamine (PEA) for hermit crabs (Pagurus bernhardus) in current and end-of-the-century oceanic pH. Living in intertidal environments, hermit crabs face large pH fluctuations in their current habitat in addition to climate-change related ocean acidification. We demonstrate that the dietary predator cue PEA for mammals and sea lampreys is an attractant for hermit crabs, with the potency of the cue increasing with decreasing pH levels. In order to explain this increased potency, we assess changes to PEA's conformational and charge-related properties as one potential mechanistic pathway. Using quantum chemical calculations validated by NMR spectroscopy, we characterise the different protonation states of PEA in water. We show how protonation of PEA could affect receptor-ligand binding, using a possible model receptor for PEA (human TAAR1). Investigating potential mechanisms of pH-dependent effects on olfactory perception of PEA and the respective behavioural response, our study advances the understanding of how ocean acidification interferes with the sense of smell and thereby might impact essential ecological interactions in marine ecosystems.

Keywords: Chemically-mediated behaviour; Chemoattractant; DFT; Ligand protonation; Pagurus bernhardus; TAAR1 receptor.


Conflict of interest statement

The authors declare that they have no conflict of interest.

Figures

Fig. 1
Fig. 1
Visualisation of the possible mechanisms by which decreased pH can result in an alteration in hermit crab response to PEA. The pathway of signal transmission from source to response is shown with light grey arrows. The potential mechanisms of a decreased pH interfering with this pathway are shown in dark gray and numbered. Thereby the decreased pH can affect the signal source (1), the signalling cue (2), the receptor or its interaction with the ligand (3) and the signal transduction (4). In this study, the hypothesised scenarios are pathway 2 & 3, whereby the decreased pH alters crucial characteristics of the signalling molecule and subsequently its interaction with the receptor. This ultimately affects the behavioural response
Fig. 2
Fig. 2
Conformations of protonated PEA (PEAH+) with torsion angle τ of the amino side chain in dark red. The anti conformation (a) corresponds to an extended geometry with τ ≈ 180. The torsion angle of the folded conformation (gauche, b) is τ ≈± 60 and leads to a weak π-hydrogen bond (dotted line)
Fig. 3
Fig. 3
Set-up of the behaviour experiment. The hermit crab was caged with a plastic cylinder in the middle of the neutral zone whilst the cues were dropped on either side of the tank on filter paper (squares). After 20 seconds of diffusion time, the cylinder was lifted and the movement pattern of the hermit crab was observed or recorded by video for 2 minutes. For data analysis, the time spent in the three areas (dark gray, gray, white) of the tank was measured
Fig. 4
Fig. 4
Secondary structure of the TAAR1 receptor with the alpha helix in purple, turns in cyan and coils in white. The amino acids of the binding pocket are shown in green stick representation. The majority of the chosen binding pocket is part of the alpha helix
Fig. 5
Fig. 5
Behavioural response of hermit crabs (n = 20) to PEA at current pH (8.1) and end-of-the-century level (7.7). Percentage of time spent in the third of the tank furthest away from PEA (a) and near the PEA source (b) at different PEA concentrations. The dashed gray line indicates a third of the time. At pH 7.7 (dark gray), hermit crabs spent significantly more time near the highest dose (b, p < 0.01, indicated by bracket with asterisks). There was no significant difference at pH 8.1 (white). The boxplot depicts the median with first and third quartile of the distribution. Whiskers extend to 1.5 × the interquartile range; data beyond that range are defined as outliers and plotted individually
Fig. 6
Fig. 6
Energy scan around the amino side chain torsion angle of neutral (a) and protonated (b) PEA, and the interaction of water with the folded conformations of neutral PEA gauche 2 (c) and gauche 1 (d). Energy values are relative to the energy of the gauche 1 conformation calculated in the respective environment. Conformations for selected torsion angles are depicted in a filmstrip above the scan. Favoured geometries are energetic minima; both protonation states show minima at one extended and two folded conformations. The potential energy curve in two solvation models are compared to gas phase (red circles). The implicit water model (blue squares) is extended by including the interaction of one explicit water molecule with the amino group (hybrid water model, green triangles). As only one water molecule is added, this scan is asymmetric. Hydrogen atoms are depicted in white, carbon atoms in black, nitrogen atoms in blue and oxygen atoms in red
Fig. 7
Fig. 7
Charge distributions (a & b) and dipole moment (c & d) of folded PEA in the implicit solvation model in the protonated (b & d) and neutral state (a & c). Electron density isosurfaces (a & b) are colour-coded according to the molecular electrostatic potential with blue representing negative, green neutral and red positive charge. The 30 % transparency of the electron density surface shows the conformation of the molecule underneath with hydrogen atoms in white, carbon atoms in black and nitrogen atoms in blue. The dipole moment (c & d) is represented by a red arrow pointing from negative to positive charge
Fig. 8
Fig. 8
Chemical and biological effect of PEA. a shows the difference in time spent in the PEA area at the highest concentration and the corresponding negative control for the two pH conditions [%] with standard error bars. The asterisk indicates a significantly higher response at pH 7.7 (one-sided t-test, p = 0.04). b is a plot of the Hendersson-Hasselbalch equation for PEA to visualise the proportion of the neutral (red, dashed) and protonated (blue, solid) state present across the pH range. The pH range from 8.1 to 7.7 is shaded in green
Fig. 9
Fig. 9
Conformation of neutral (a) and protonated PEA (b) inside the TAAR1 receptor pocket. PEA and Asp103 (transparent) are shown as ball-and-stick model, whilst the rest of the binding pocket is stylised as lines

References

    1. Adamo C, Barone V. Toward reliable density functional methods without adjustable parameters: The pbe0 model. J Chem Phys. 1999;110(13):6158–6170.
    1. Anderson K, Mathis A. Friends in low places: Responses of a bethic stream fish to intra-prey-guild alarm cues. Ethology. 2016;122(12):954–962.
    1. Andujar S, Tosso R, Suvire F, Angelina E, Peruchena N, Cabedo N, Cortes D, Enriz R. Searching the “biologically relevant” conformation of dopamine: a computational approach. J Chem Inf Model. 2011;52(1):99–112. - PubMed
    1. Barone V, Cossi M. Quantum calculation of molecular energies and energy gradients in solution by a conductor solvent model. J Phys Chem A. 1998;102(11):1995–2001.
    1. Barroso N, Rodriguez M. Action of β-phenylethylamine and related amines on nigrostriatal dopamine neurotransmission. European J Pharmacol. 1996;297(3):195–203. - PubMed

LinkOut - more resources