. 2021 Jul;37(7):985-998.
doi: 10.1007/s12264-021-00698-5. Epub 2021 May 20.

Homeobox Gene Six3 is Required for the Differentiation of D2-Type Medium Spiny Neurons

Affiliations

Homeobox Gene Six3 is Required for the Differentiation of D2-Type Medium Spiny Neurons

Xiaolei Song et al. Neurosci Bull. 2021 Jul.

Abstract

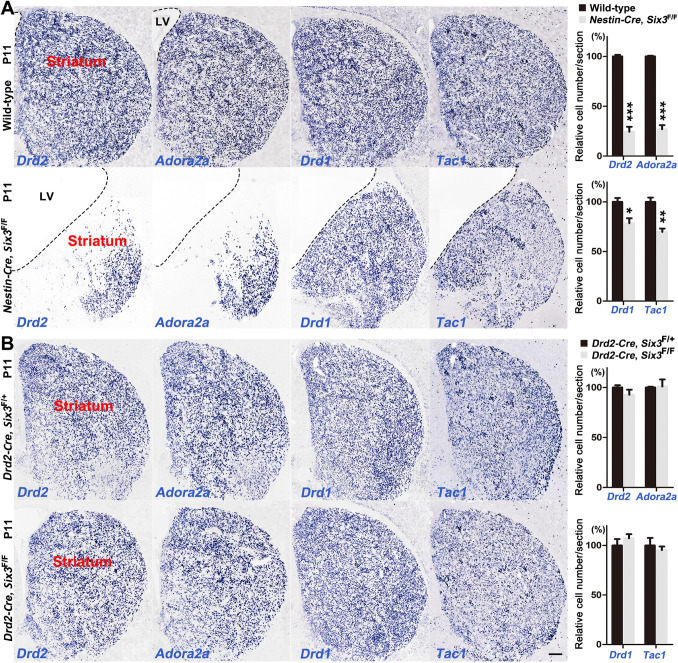
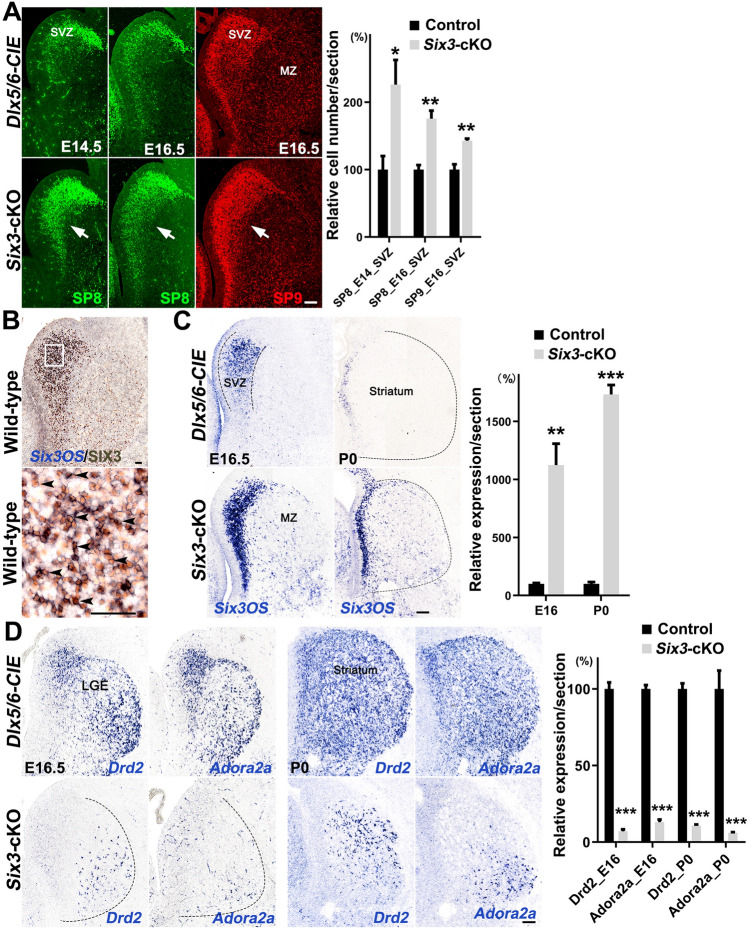
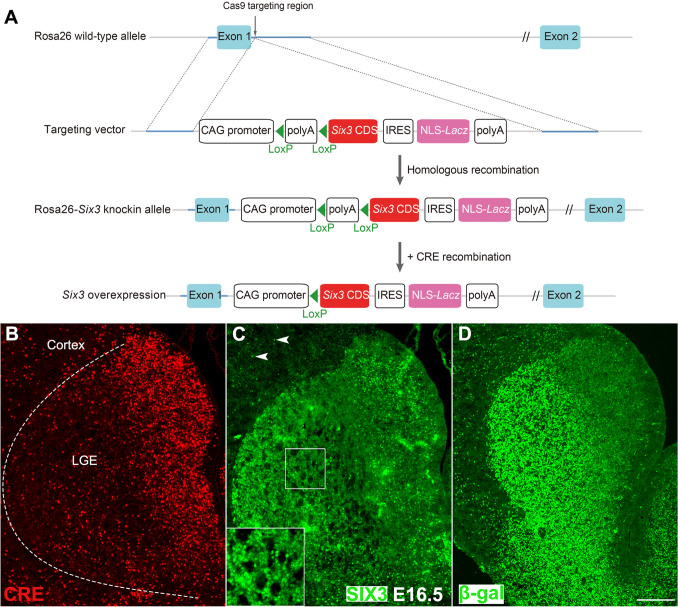
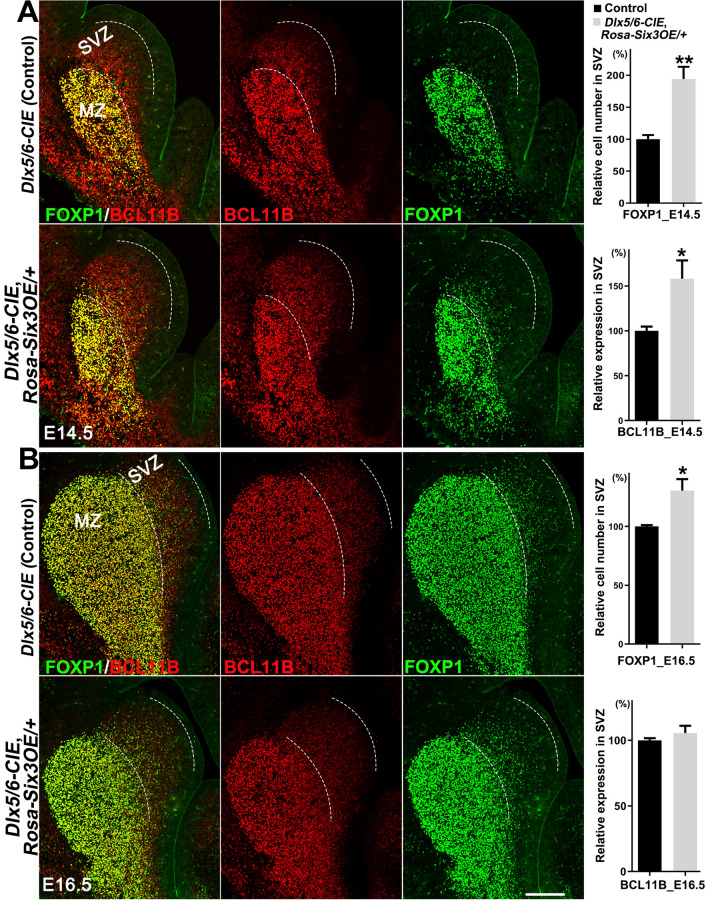
Medium spiny neurons (MSNs) in the striatum, which can be divided into D1 and D2 MSNs, originate from the lateral ganglionic eminence (LGE). Previously, we reported that Six3 is a downstream target of Sp8/Sp9 in the transcriptional regulatory cascade of D2 MSN development and that conditionally knocking out Six3 leads to a severe loss of D2 MSNs. Here, we showed that Six3 mainly functions in D2 MSN precursor cells and gradually loses its function as D2 MSNs mature. Conditional deletion of Six3 had little effect on cell proliferation but blocked the differentiation of D2 MSN precursor cells. In addition, conditional overexpression of Six3 promoted the differentiation of precursor cells in the LGE. We measured an increase of apoptosis in the postnatal striatum of conditional Six3-knockout mice. This suggests that, in the absence of Six3, abnormally differentiated D2 MSNs are eliminated by programmed cell death. These results further identify Six3 as an important regulatory element during D2 MSN differentiation.

Keywords: Drd2; LGE; Medium spiny neuron; Six3; striatum.


Conflict of interest statement

The authors declare that they have no conflict of interest.

Figures

Fig. 1
Fig. 1
Six3 mainly functions in D2 MSN precursor cells. A Left panels, in situ RNA hybridization for Drd2, Adora2a, Drd1 and Tac1 in the striatum of wild-type control and Nestin-Cre, Six3F/F mice at P11. Note that most of the Drd2+ and Adora2a+ cells in the medial LGE of Nestin-Cre, Six3F/F mice were lost. Right panel, quantification of Drd2, Adora2a, Drd1 and Tac1 (n = 3–4). The dotted lines indicate the border of the lateral ventricle (LV) and striatum. B Left panels, in situ hybridization for Drd2, Adora2a, Drd1 and Tac1 in the striatum of control and Drd2-Cre, Six3F/F mice at P11. Note that the development of both D1 and D2 MSNs was unaffected in the striatum of Drd2-Cre, Six3F/F mice compared to the controls (Drd2-Cre, Six3F/+). Right panel, quantification of Drd2, Adora2a, Drd1, and Tac1 (n = 3–4). Data shown are the mean + SEM (*P < 0.05, **P < 0.01, ***P < 0.001, Student’s t-test; scale bar, 200 μm).
Fig. 2
Fig. 2
Neurogenesis is reduced in the LGE of Six3-cKO mice. A Upper panels. FOXP1 immunofluorescence and Ebf1 and Isl1 in situ hybridization in the LGE of control and Six3-cKO mice at E16.5. The LGE SVZ of Six3-cKO mice contains fewer FOXP1+, Ebf1+ and Isl1+ cells than those of controls. The dotted lines indicate the border of the LGE SVZ and MZ. Lower panels, quantification of FOXP1, Ebf1, and Isl1. Data shown are the mean + SEM (n = 3–4; *P < 0.05, ***P < 0.001, Student’s t-test). B Upper panels, BCL11B and EBF1 immunofluorescence in the striatum of control and Six3-cKO mice at P0. BCL11B+/EBF1+ cells represent D1 MSNs, and BCL11B+/EBF1 cells represent D2 MSNs. Inserts show magnified images of BCL11B and EBF1 co-expression in control and Six3-cKO mice. BCL11B+/EBF1 cells (D2 MSNs) are indicated by white dots in the right panel. Lower left panel, quantification showing that the number of BCL11B+/EBF1 cells, but not BCL11B+/EBF1+ cells, was significantly lower in the striatum of Six3-cKO mice than in control. Lower right panel, percentages of (BCL11B+/EBF1+)/BCL11B+ and (BCL11B+/EBF1)/BCL11B+ cells. Dotted line indicates the striatal border. Data shown are the mean + SEM (n = 3; *P < 0.05, Student’s t-test; scale bar, 200 μm).
Fig. 3
Fig. 3
Cell proliferation is unaffected in Six3-cKO mice. A, B Upper panels, immunofluorescence images showing BrdU-pulse labeling for 0.5 h in the LGE of control and Six3-cKO mice at E14.5 (A) and E16.5 (B). Lower panels, numbers of BrdU+ cells in the LGE VZ and SVZ at E14.5 (A) and E16.5 (B). There is no significant difference in the number of BrdU+ cells between the LGEs of Six3-cKO and control mice. C Upper panels, KI67 immunofluorescence in the LGE of control and Six3-cKO mice at E16.5. Dotted lines indicate the border of the LGE VZ, SVZ, and MZ. Lower panel, quantification data (mean + SEM, n = 3, Student’s t-test; scale bar, 100 μm).
Fig. 4
Fig. 4
Differentiation of striatal D2 MSNs is blocked in Six3-cKO mice. A Left panels, immunofluorescence images showing SP8 (E14.5 and E16.5) and SP9 (E16.5) expression in the LGE. Arrows indicate that SP8+ and SP9+ cells are accumulated in the vLGE SVZ of Six3-cKO mice compared to controls. Right panel, quantification data is shown (n = 3–4). B Left panels, immunohistochemistry images showing SIX3 protein and Six3OS mRNA expression in the LGE of wild-type mice at E16.5. The magnified image shows that most, if not all, of the Six3OS+ cells in the LGE SVZ express the SIX3 protein. Right panels, quantification. C Left panels, in situ hybridization for Six3OS in the LGE of control and Six3-cKO mice at E16.5 and P0. Six3OS is mainly expressed in the LGE SVZ, but the expression of Six3OS is greatly increased in the LGE of Six3-cKO mice. Note that many Six3OS+ cells are distributed in the LGE MZ and striatum of Six3-cKO mice. Right panel, quantification data (n = 3–4). D Left panels, in situ hybridization for Drd2 and Adora2a in control and Six3-cKO mice at E16.5 and P0. Drd2 and Adora2a are strongly expressed in the controls at both E16.5 and P0. However, very little Drd2 and Adora2a mRNA is expressed in the LGE and striatum of Six3-cKO mice at E16.5 and P0. Right panel, quantification data (n = 3; mean + SEM; *P < 0.05, **P < 0.01, ***P < 0.001, Student’s t-test). Note that many SP9+ cells, BCL11B+/EBF1 cells, and Six3OS+ cells are located in the LGE MZ and striatum of Six3-cKO mice in A and B. Dotted lines indicate the borders of the LGE. Scale bars, 100 μm in A, C, and D; 50 μm in B.
Fig. 5
Fig. 5
Generation of mice with conditional overexpression of Six3. A A cassette containing the CAG promoter-Flox-STOP-Flox-Six3-IRES-Lacz sequence was knocked into the downstream of exon 1 of Rosa26 (gene trap ROSA 26). The Lacz gene contains a nuclear localization sequence (NLS). B–D Immunofluorescence images showing CRE, SIX3, and β-galactosidase (β-gal) expression in Dlx5/6-CIE, Rosa26-Six3OE/+ mice at E16.5. Arrowheads in C show ectopic expression of SIX3 in Dlx5/6+ cells in the cortex. Boxes show magnified images of SIX3 expression in the LGE MZ (scale bar, 200 μm).
Fig. 6
Fig. 6
Overexpression of Six3 in the LGE promotes the differentiation of MSN precursor cells. A Left, immunofluorescence images showing FOXP1 and BCL11B expression in the LGE of control and Dlx5/6-CIE, Rosa-Six3OE/+ mice at E14.5. Note that there are very few FOXP1+ cells in the LGE SVZ of controls. BCL11B expression is up-regulated in the LGE SVZ of Dlx5/6-CIE, Rosa-Six3OE/+ mice compared to controls. Right, quantification showing that the number of FOXP1+ cells in the LGE SVZ is significantly higher in Dlx5/6-CIE, Rosa-Six3OE/+ mice than in controls. B Left, immunofluorescence images showing FOXP1 and BCL11B expression in the LGE of control and Dlx5/6-CIE, Rosa-Six3OE/+ mice at E16.5. BCL11B expression is higher in the LGE SVZ of Dlx5/6-CIE, Rosa-Six3OE/+ mice than in controls. Right, quantification data (n = 3; mean + SEM; *P < 0.05, **P < 0.01, Student’s t-test; scale bar, 200 μm).
Fig. 7
Fig. 7
Apoptosis is increased in the striatum of postnatal Six3-cKO mice. A Immunofluorescence images showing cleaved Caspase-3 expression in the striatum of Dlx5/6-CIE controls and Six3-cKO mice at P0 and P3 (dotted lines, border of the striatum; inserts, magnified images of cleaved Caspase-3). B Quantification showing the number of cleaved Caspase-3+ cells was significantly higher in Six3-cKO mice than in control at P0 and P3, while there was no significant difference at P7 and P11 (n = 3; mean + SEM; **P < 0.01, Student’s t-test; scale bar, 100 μm).

Similar articles

Cited by

References

    1. Gerfen CR, Paletzki R, Heintz N. GENSAT BAC cre-recombinase driver lines to study the functional organization of cerebral cortical and basal ganglia circuits. Neuron. 2013;80:1368–1383. - PMC - PubMed
    1. Gerfen CR, Surmeier DJ. Modulation of striatal projection systems by dopamine. Annu Rev Neurosci. 2011;34:441–466. - PMC - PubMed
    1. Reiner A, Albin RL, Anderson KD, D'Amato CJ, Penney JB, Young AB. Differential loss of striatal projection neurons in Huntington disease. Proc Natl Acad Sci USA. 1988;85:5733–5737. - PMC - PubMed
    1. Ni RJ, Huang ZH, Shu YM, Wang Y, Li T, Zhou JN. Atlas of the striatum and globus pallidus in the tree shrew: Comparison with rat and mouse. Neurosci Bull. 2018;34:405–418. - PMC - PubMed
    1. Zhang H, Yang J, Wang X, Yao X, Han H, Gao Y, et al. Altered local field potential relationship between the parafascicular thalamic nucleus and dorsal striatum in hemiparkinsonian rats. Neurosci Bull. 2019;35:315–324. - PMC - PubMed

LinkOut - more resources