Metabolic Changes Are Associated with Melphalan Resistance in Multiple Myeloma
- PMID: 34014671
- PMCID: PMC11636643
- DOI: 10.1021/acs.jproteome.1c00022
Metabolic Changes Are Associated with Melphalan Resistance in Multiple Myeloma
Abstract
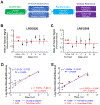
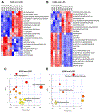
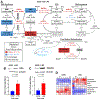
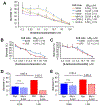
Multiple myeloma is an incurable hematological malignancy that impacts tens of thousands of people every year in the United States. Treatment for eligible patients involves induction, consolidation with stem cell rescue, and maintenance. High-dose therapy with a DNA alkylating agent, melphalan, remains the primary drug for consolidation therapy in conjunction with autologous stem-cell transplantation; as such, melphalan resistance remains a relevant clinical challenge. Here, we describe a proteometabolomic approach to examine mechanisms of acquired melphalan resistance in two cell line models. Drug metabolism, steady-state metabolomics, activity-based protein profiling (ABPP, data available at PRIDE: PXD019725), acute-treatment metabolomics, and western blot analyses have allowed us to further elucidate metabolic processes associated with melphalan resistance. Proteometabolomic data indicate that drug-resistant cells have higher levels of pentose phosphate pathway metabolites. Purine, pyrimidine, and glutathione metabolisms were commonly altered, and cell-line-specific changes in metabolite levels were observed, which could be linked to the differences in steady-state metabolism of naïve cells. Inhibition of selected enzymes in purine synthesis and pentose phosphate pathways was evaluated to determine their potential to improve melphalan's efficacy. The clinical relevance of these proteometabolomic leads was confirmed by comparison of tumor cell transcriptomes from newly diagnosed MM patients and patients with relapsed disease after treatment with high-dose melphalan and autologous stem-cell transplantation. The observation of common and cell-line-specific changes in metabolite levels suggests that omic approaches will be needed to fully examine melphalan resistance in patient specimens and define personalized strategies to optimize the use of high-dose melphalan.
Keywords: LC−MS metabolomics; RNAseq; activity-based protein profiling (ABPP); metabolism; multiple myeloma; pentose phosphate pathway; proteometabolomics; purines.
Conflict of interest statement
Conflict of Interest Statement
The following authors (OH and ZJ) are employed by M2Gen, a for profit company focused on providing oncology health informatics solutions to accelerate cancer treatment discovery, development, and delivery by leveraging clinical and molecular data.
Figures


Similar articles
-
Proteometabolomics of Melphalan Resistance in Multiple Myeloma.Methods Mol Biol. 2019;1996:273-296. doi: 10.1007/978-1-4939-9488-5_21. Methods Mol Biol. 2019. PMID: 31127562 Free PMC article.
-
Autologous haematopoietic stem-cell transplantation versus bortezomib-melphalan-prednisone, with or without bortezomib-lenalidomide-dexamethasone consolidation therapy, and lenalidomide maintenance for newly diagnosed multiple myeloma (EMN02/HO95): a multicentre, randomised, open-label, phase 3 study.Lancet Haematol. 2020 Jun;7(6):e456-e468. doi: 10.1016/S2352-3026(20)30099-5. Epub 2020 Apr 30. Lancet Haematol. 2020. PMID: 32359506 Clinical Trial.
-
Chemotherapy plus lenalidomide versus autologous transplantation, followed by lenalidomide plus prednisone versus lenalidomide maintenance, in patients with multiple myeloma: a randomised, multicentre, phase 3 trial.Lancet Oncol. 2015 Dec;16(16):1617-29. doi: 10.1016/S1470-2045(15)00389-7. Epub 2015 Nov 17. Lancet Oncol. 2015. PMID: 26596670 Clinical Trial.
-
[High-dose melphalan in patients with multiple myeloma].Bull Cancer. 1999 Mar;86(3):283-8. Bull Cancer. 1999. PMID: 10210762 Review. French.
-
The role of high-dose melphalan and autologous stem cell transplant in the rapidly evolving era of modern multiple myeloma therapy.Clin Adv Hematol Oncol. 2016 Sep;14(9):719-28. Clin Adv Hematol Oncol. 2016. PMID: 27673290 Review.
Cited by
-
Proteome Coverage after Simultaneous Proteo-Metabolome Liquid-Liquid Extraction.J Proteome Res. 2023 Mar 3;22(3):951-966. doi: 10.1021/acs.jproteome.2c00758. Epub 2023 Feb 10. J Proteome Res. 2023. PMID: 36763818 Free PMC article.
-
Impacting T-cell fitness in multiple myeloma: potential roles for selinexor and XPO1 inhibitors.Front Immunol. 2023 Oct 26;14:1275329. doi: 10.3389/fimmu.2023.1275329. eCollection 2023. Front Immunol. 2023. PMID: 37954586 Free PMC article. Review.
-
Metabolic reprogramming induced by PSMA4 overexpression facilitates bortezomib resistance in multiple myeloma.Ann Hematol. 2025 Feb;104(2):1023-1037. doi: 10.1007/s00277-024-06163-3. Epub 2025 Jan 4. Ann Hematol. 2025. PMID: 39755751 Free PMC article.
-
Mitochondrial metabolic determinants of multiple myeloma growth, survival, and therapy efficacy.Front Oncol. 2022 Sep 16;12:1000106. doi: 10.3389/fonc.2022.1000106. eCollection 2022. Front Oncol. 2022. PMID: 36185202 Free PMC article. Review.
-
Metabolic Disorders in Multiple Myeloma.Int J Mol Sci. 2021 Oct 22;22(21):11430. doi: 10.3390/ijms222111430. Int J Mol Sci. 2021. PMID: 34768861 Free PMC article. Review.
References
-
- Siegel RL; Miller KD; Jemal A, Cancer statistics, 2019. CA Cancer J Clin 2019, 69 (1), 7–34. - PubMed
-
- Jackson GH; Davies FE; Pawlyn C; Cairns DA; Striha A; Collett C; Hockaday A; Jones JR; Kishore B; Garg M; Williams CD; Karunanithi K; Lindsay J; Jenner MW; Cook G; Russell NH; Kaiser MF; Drayson MT; Owen RG; Gregory WM; Morgan GJ; Group U. N. H.-o. C. S., Lenalidomide maintenance versus observation for patients with newly diagnosed multiple myeloma (Myeloma XI): a multicentre, open-label, randomised, phase 3 trial. Lancet Oncol 2019, 20 (1), 57–73. - PMC - PubMed
Publication types
MeSH terms
Substances
Grants and funding
LinkOut - more resources
Full Text Sources
Other Literature Sources
Medical

