. 2021 May;129(5):57008.
doi: 10.1289/EHP8171. Epub 2021 May 17.

Sex-Specific Effects of Prenatal and Early Life Inorganic and Methylated Arsenic Exposure on Atherosclerotic Plaque Development and Composition in Adult ApoE-/- Mice

Affiliations

Sex-Specific Effects of Prenatal and Early Life Inorganic and Methylated Arsenic Exposure on Atherosclerotic Plaque Development and Composition in Adult ApoE-/- Mice

Luis Fernando Negro Silva et al. Environ Health Perspect. 2021 May.

Abstract

Background: Epidemiologic studies indicate that early life arsenic exposures are linked to an increased risk of cardiovascular diseases. Different oxidation and methylation states of arsenic exist in the environment and are formed in vivo via the action of arsenic (+3 oxidation state) methyltransferase (As3MT). Methylated arsenicals are pro-atherogenic postnatally, but pre- and perinatal effects are unclear. This is particularly important because methylated arsenicals are known to cross the placenta.

Objectives: We tested the effects of early life exposure to inorganic and methylated arsenicals on atherosclerotic plaque formation and its composition in apolipoprotein E knock-out (apoE-/-) mice and evaluated whether apoE-/- mice lacking As3MT expression were susceptible to this effect.

Methods: We exposed apoE-/- or apoE-/-/As3MT-/- mice to 200 ppb inorganic or methylated arsenic in the drinking water from conception to weaning and assessed atherosclerotic plaques in the offspring at 18 wk of age. Mixed regression models were used to estimate the mean difference in each outcome relative to controls, adjusting for sex and including a random effects term to account for within-litter clustering.

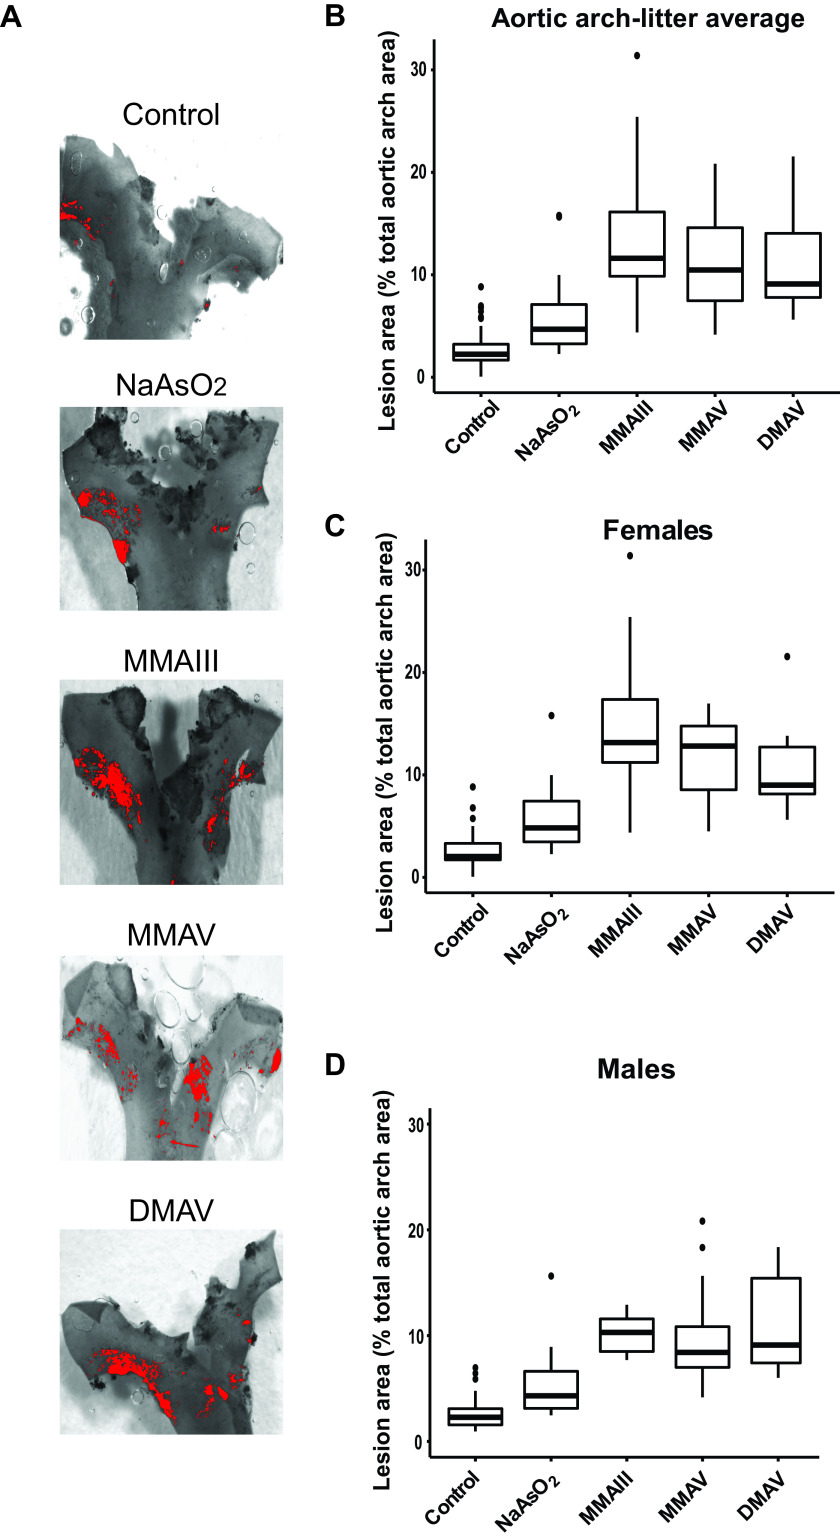
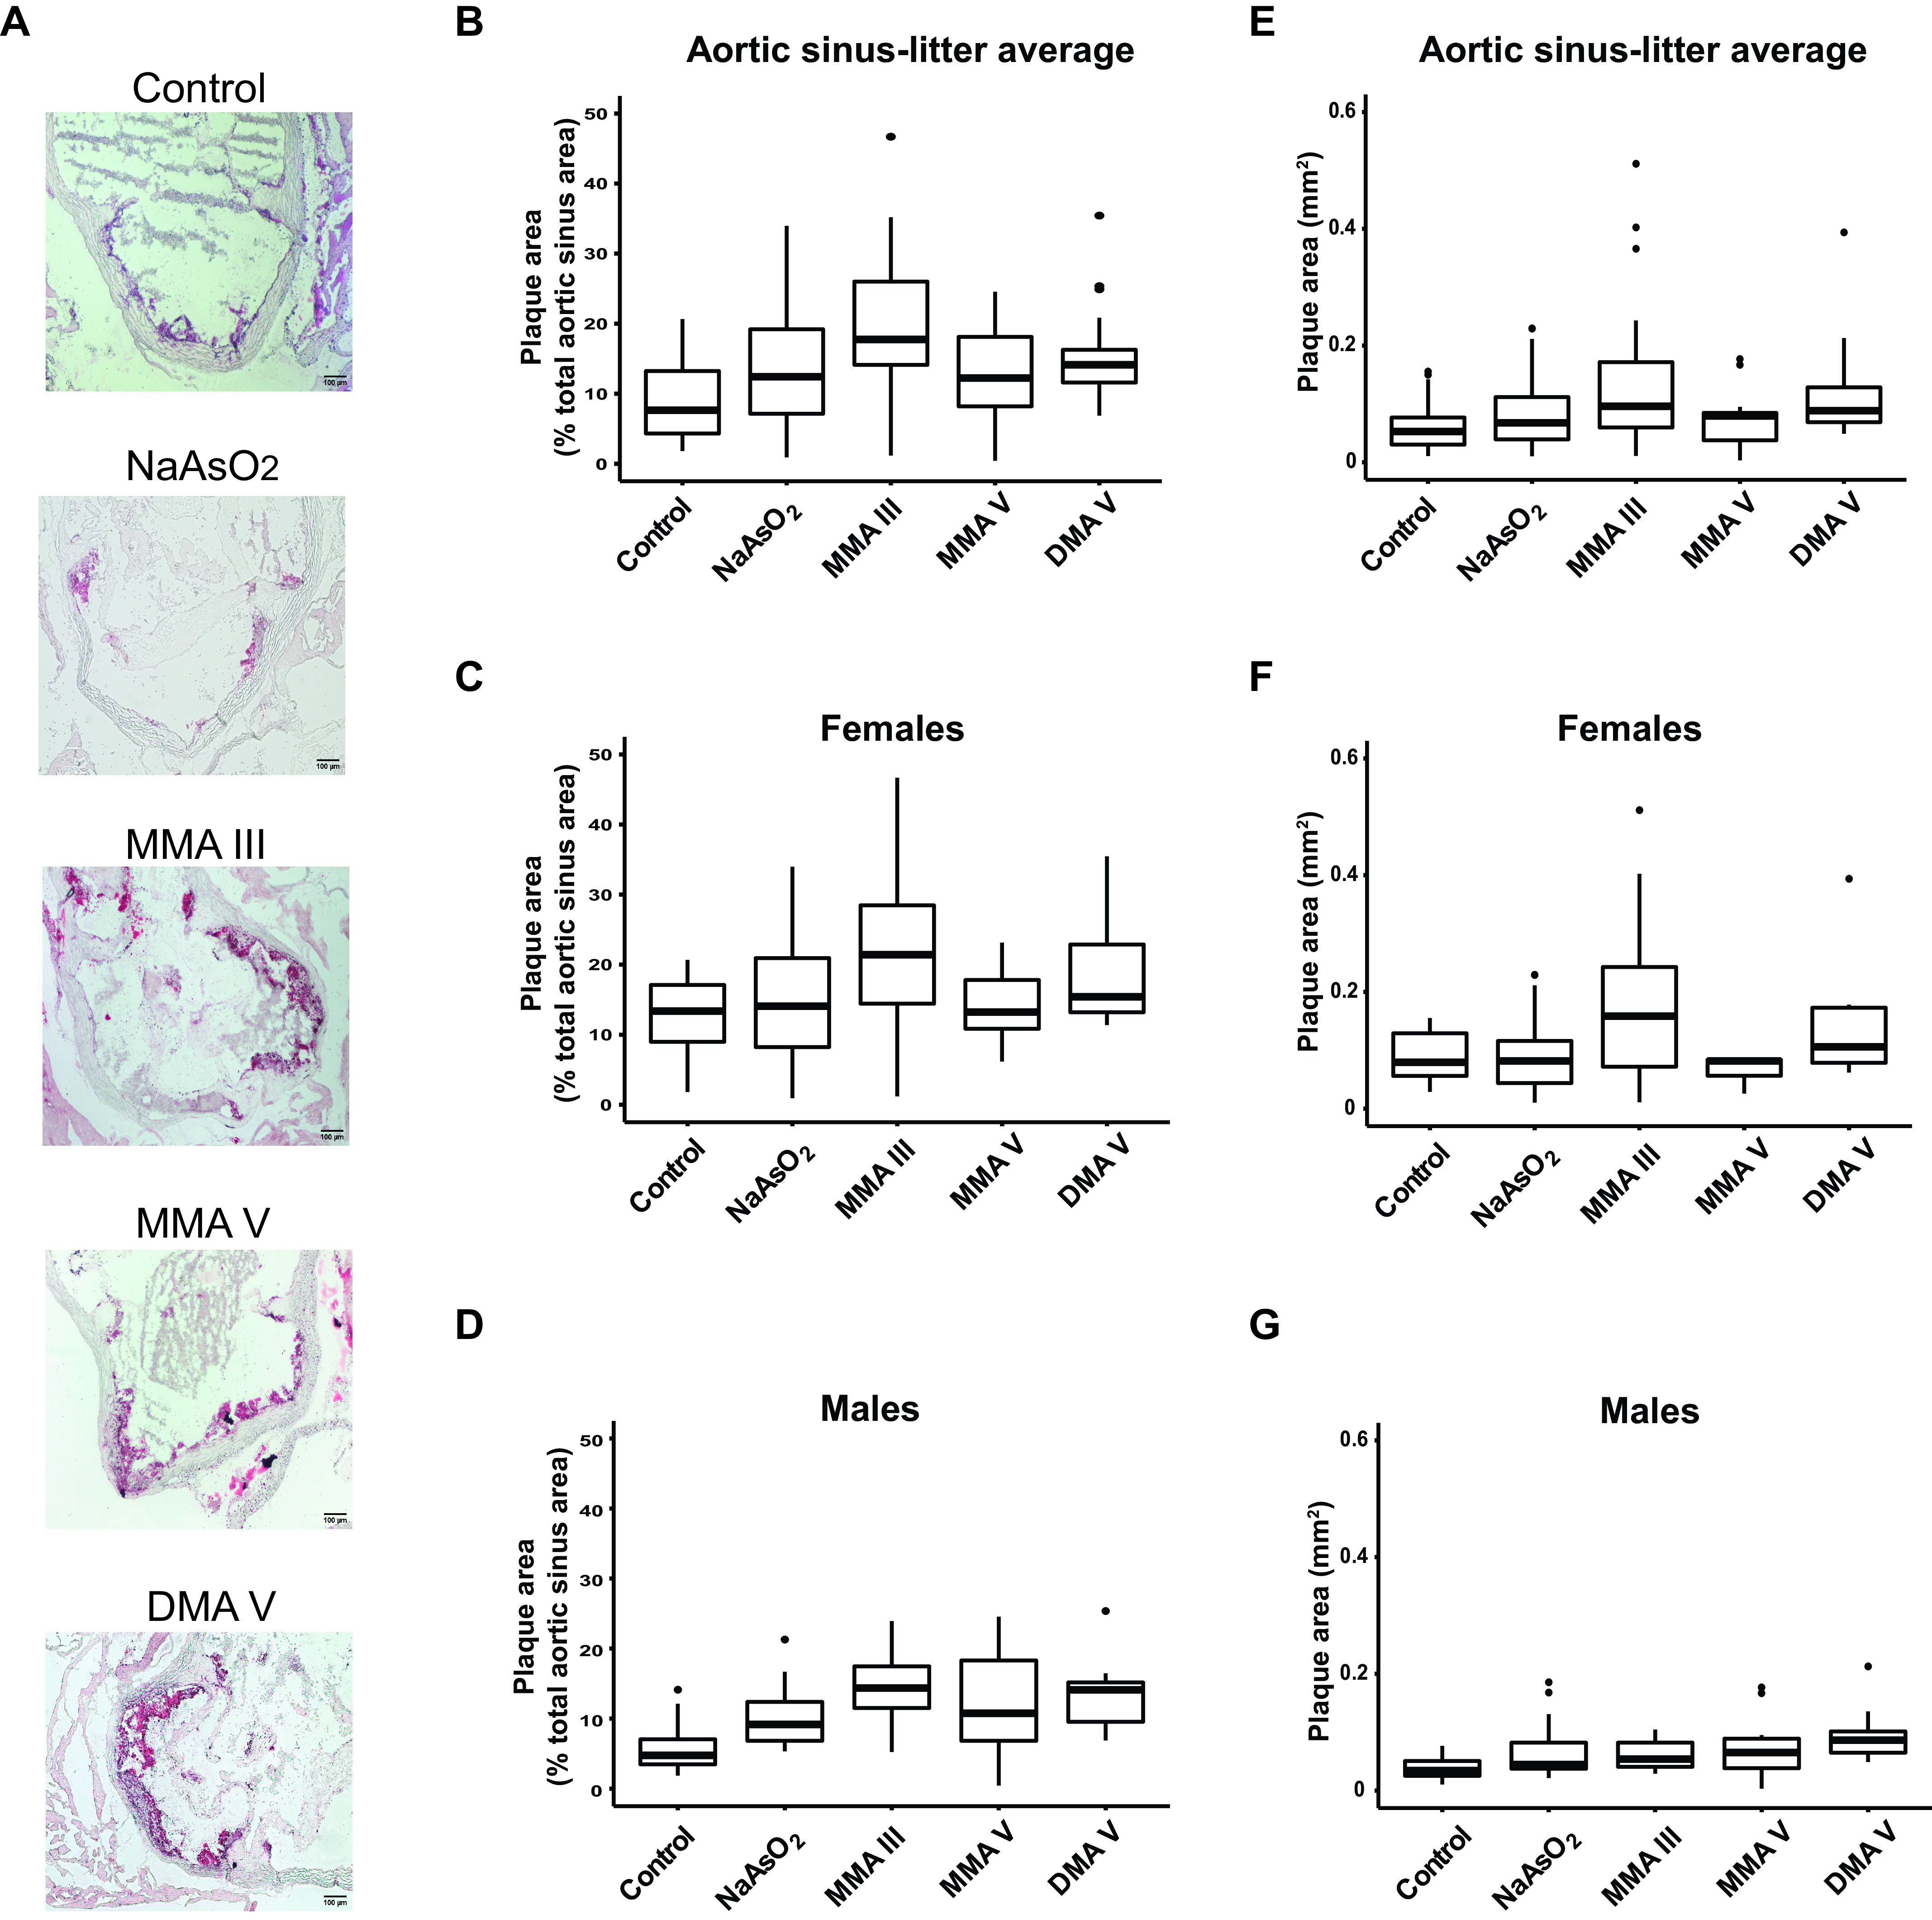
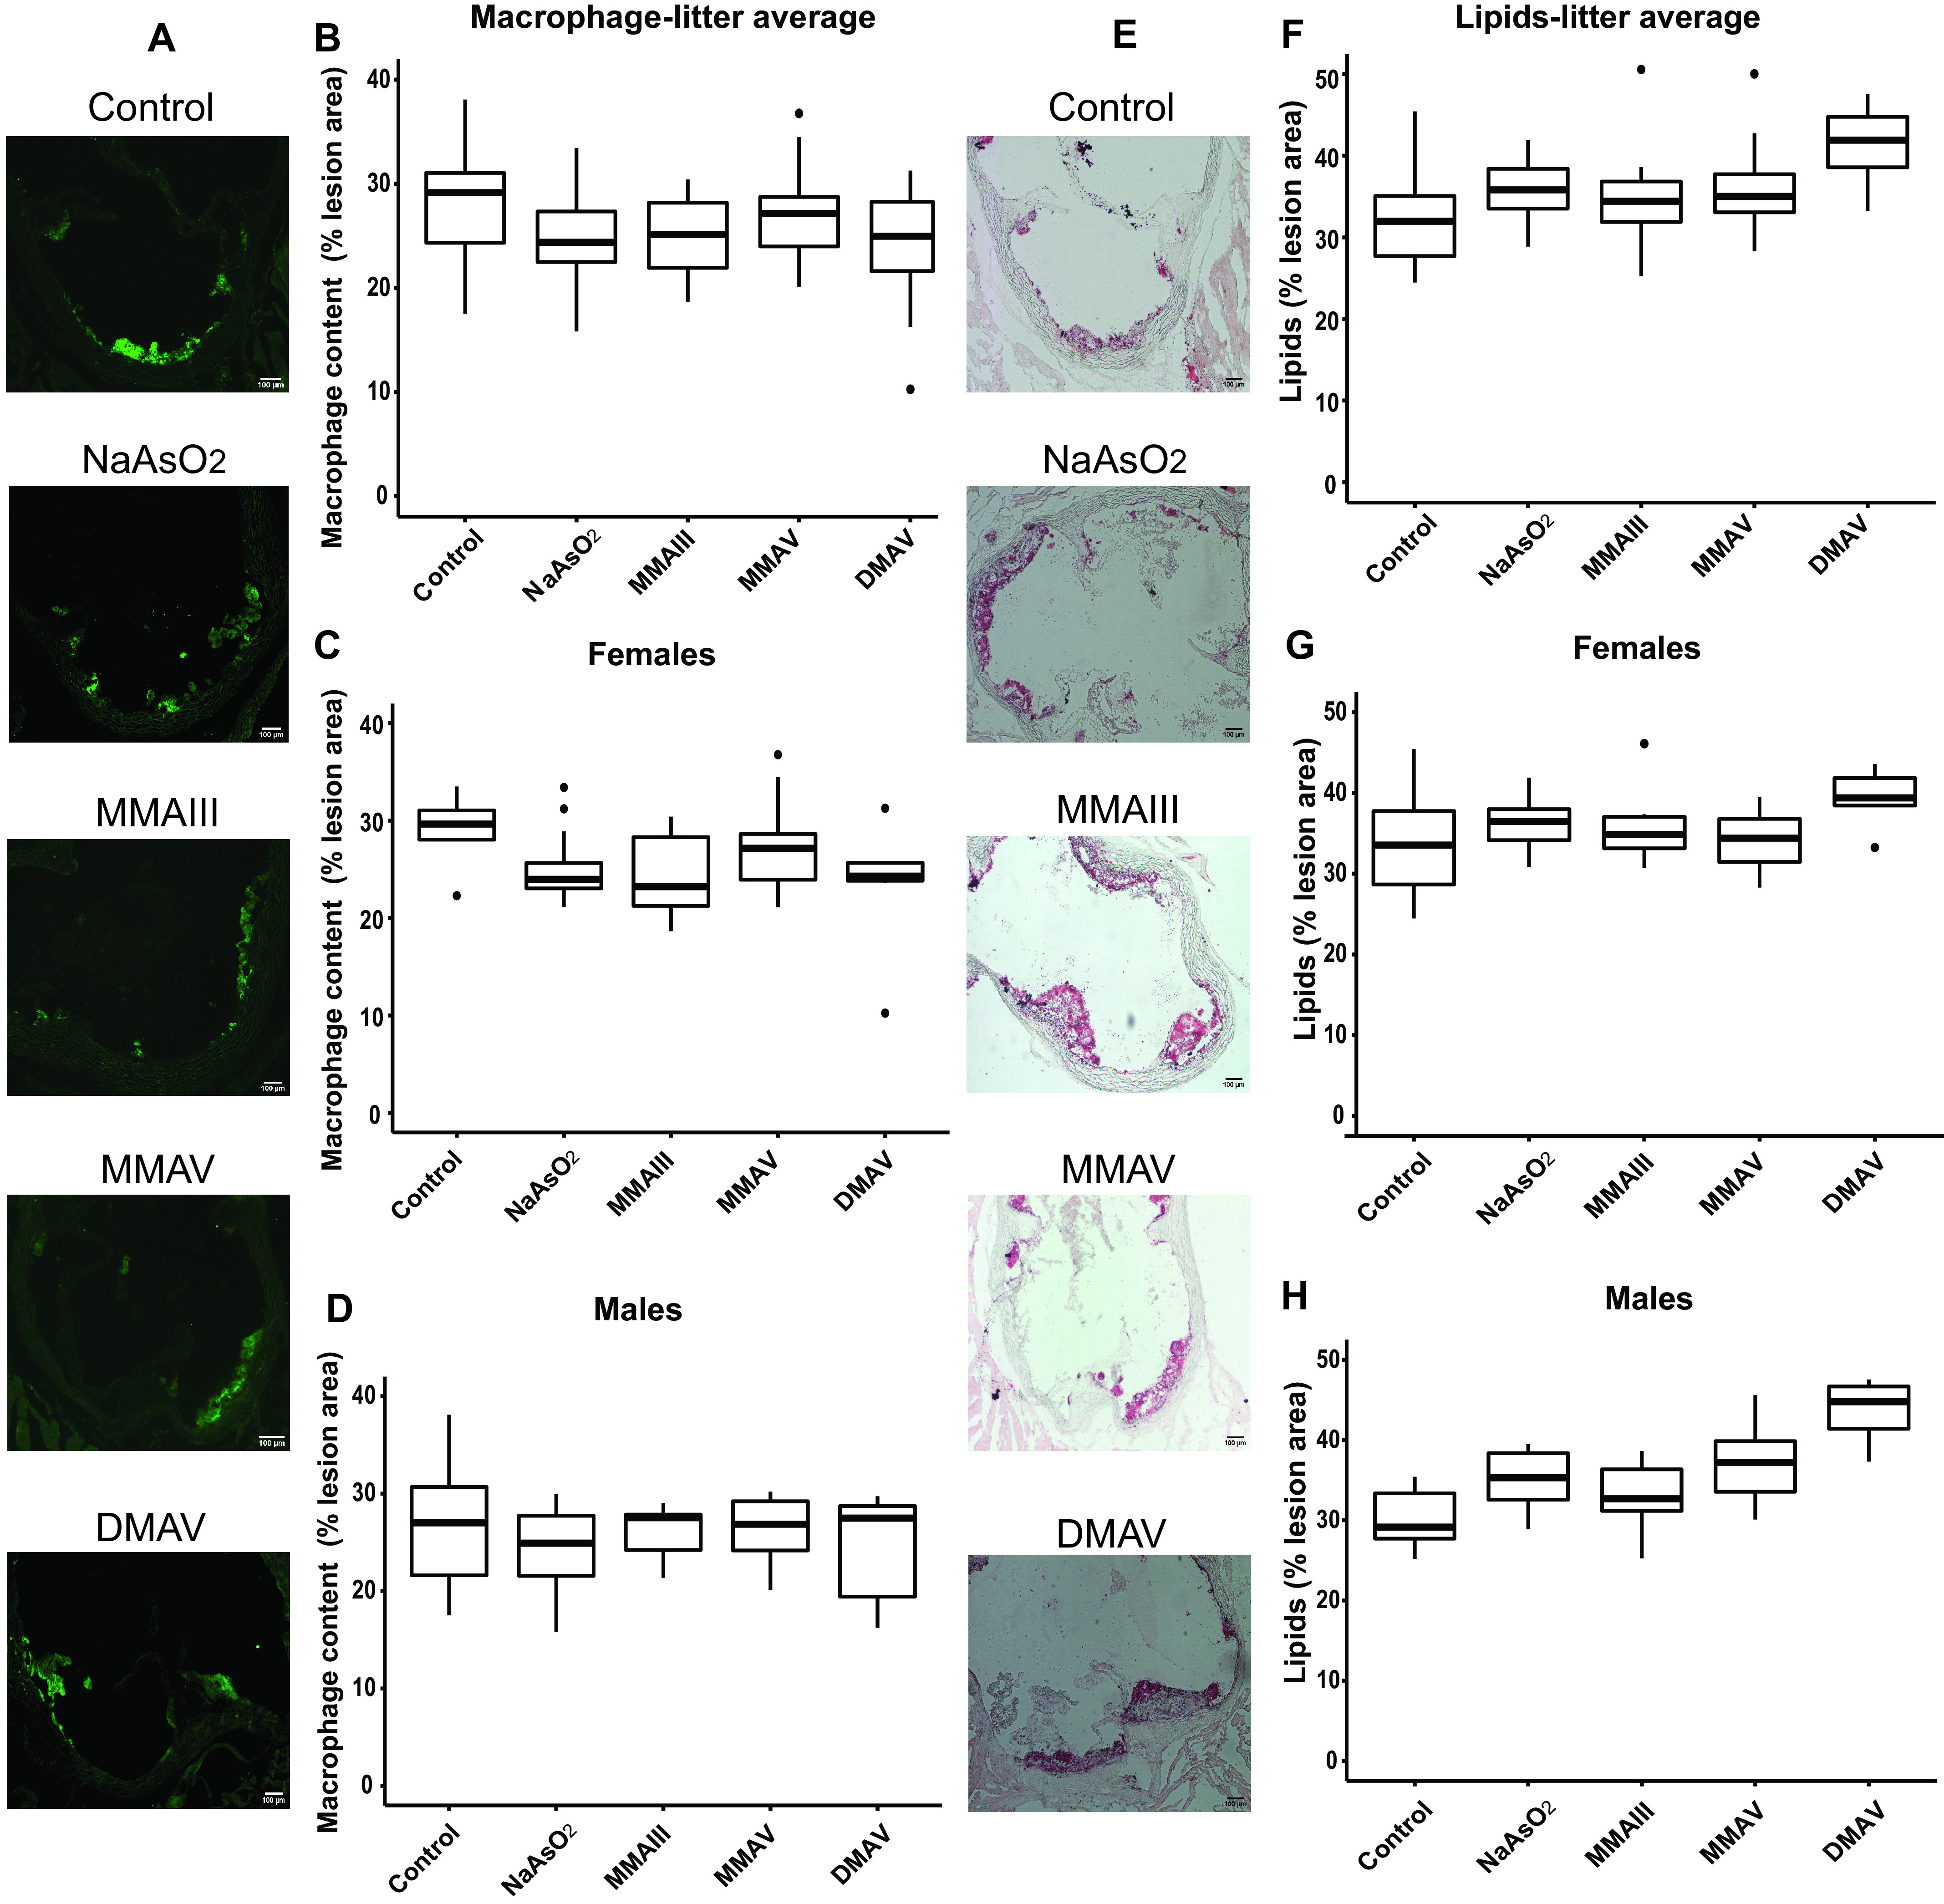
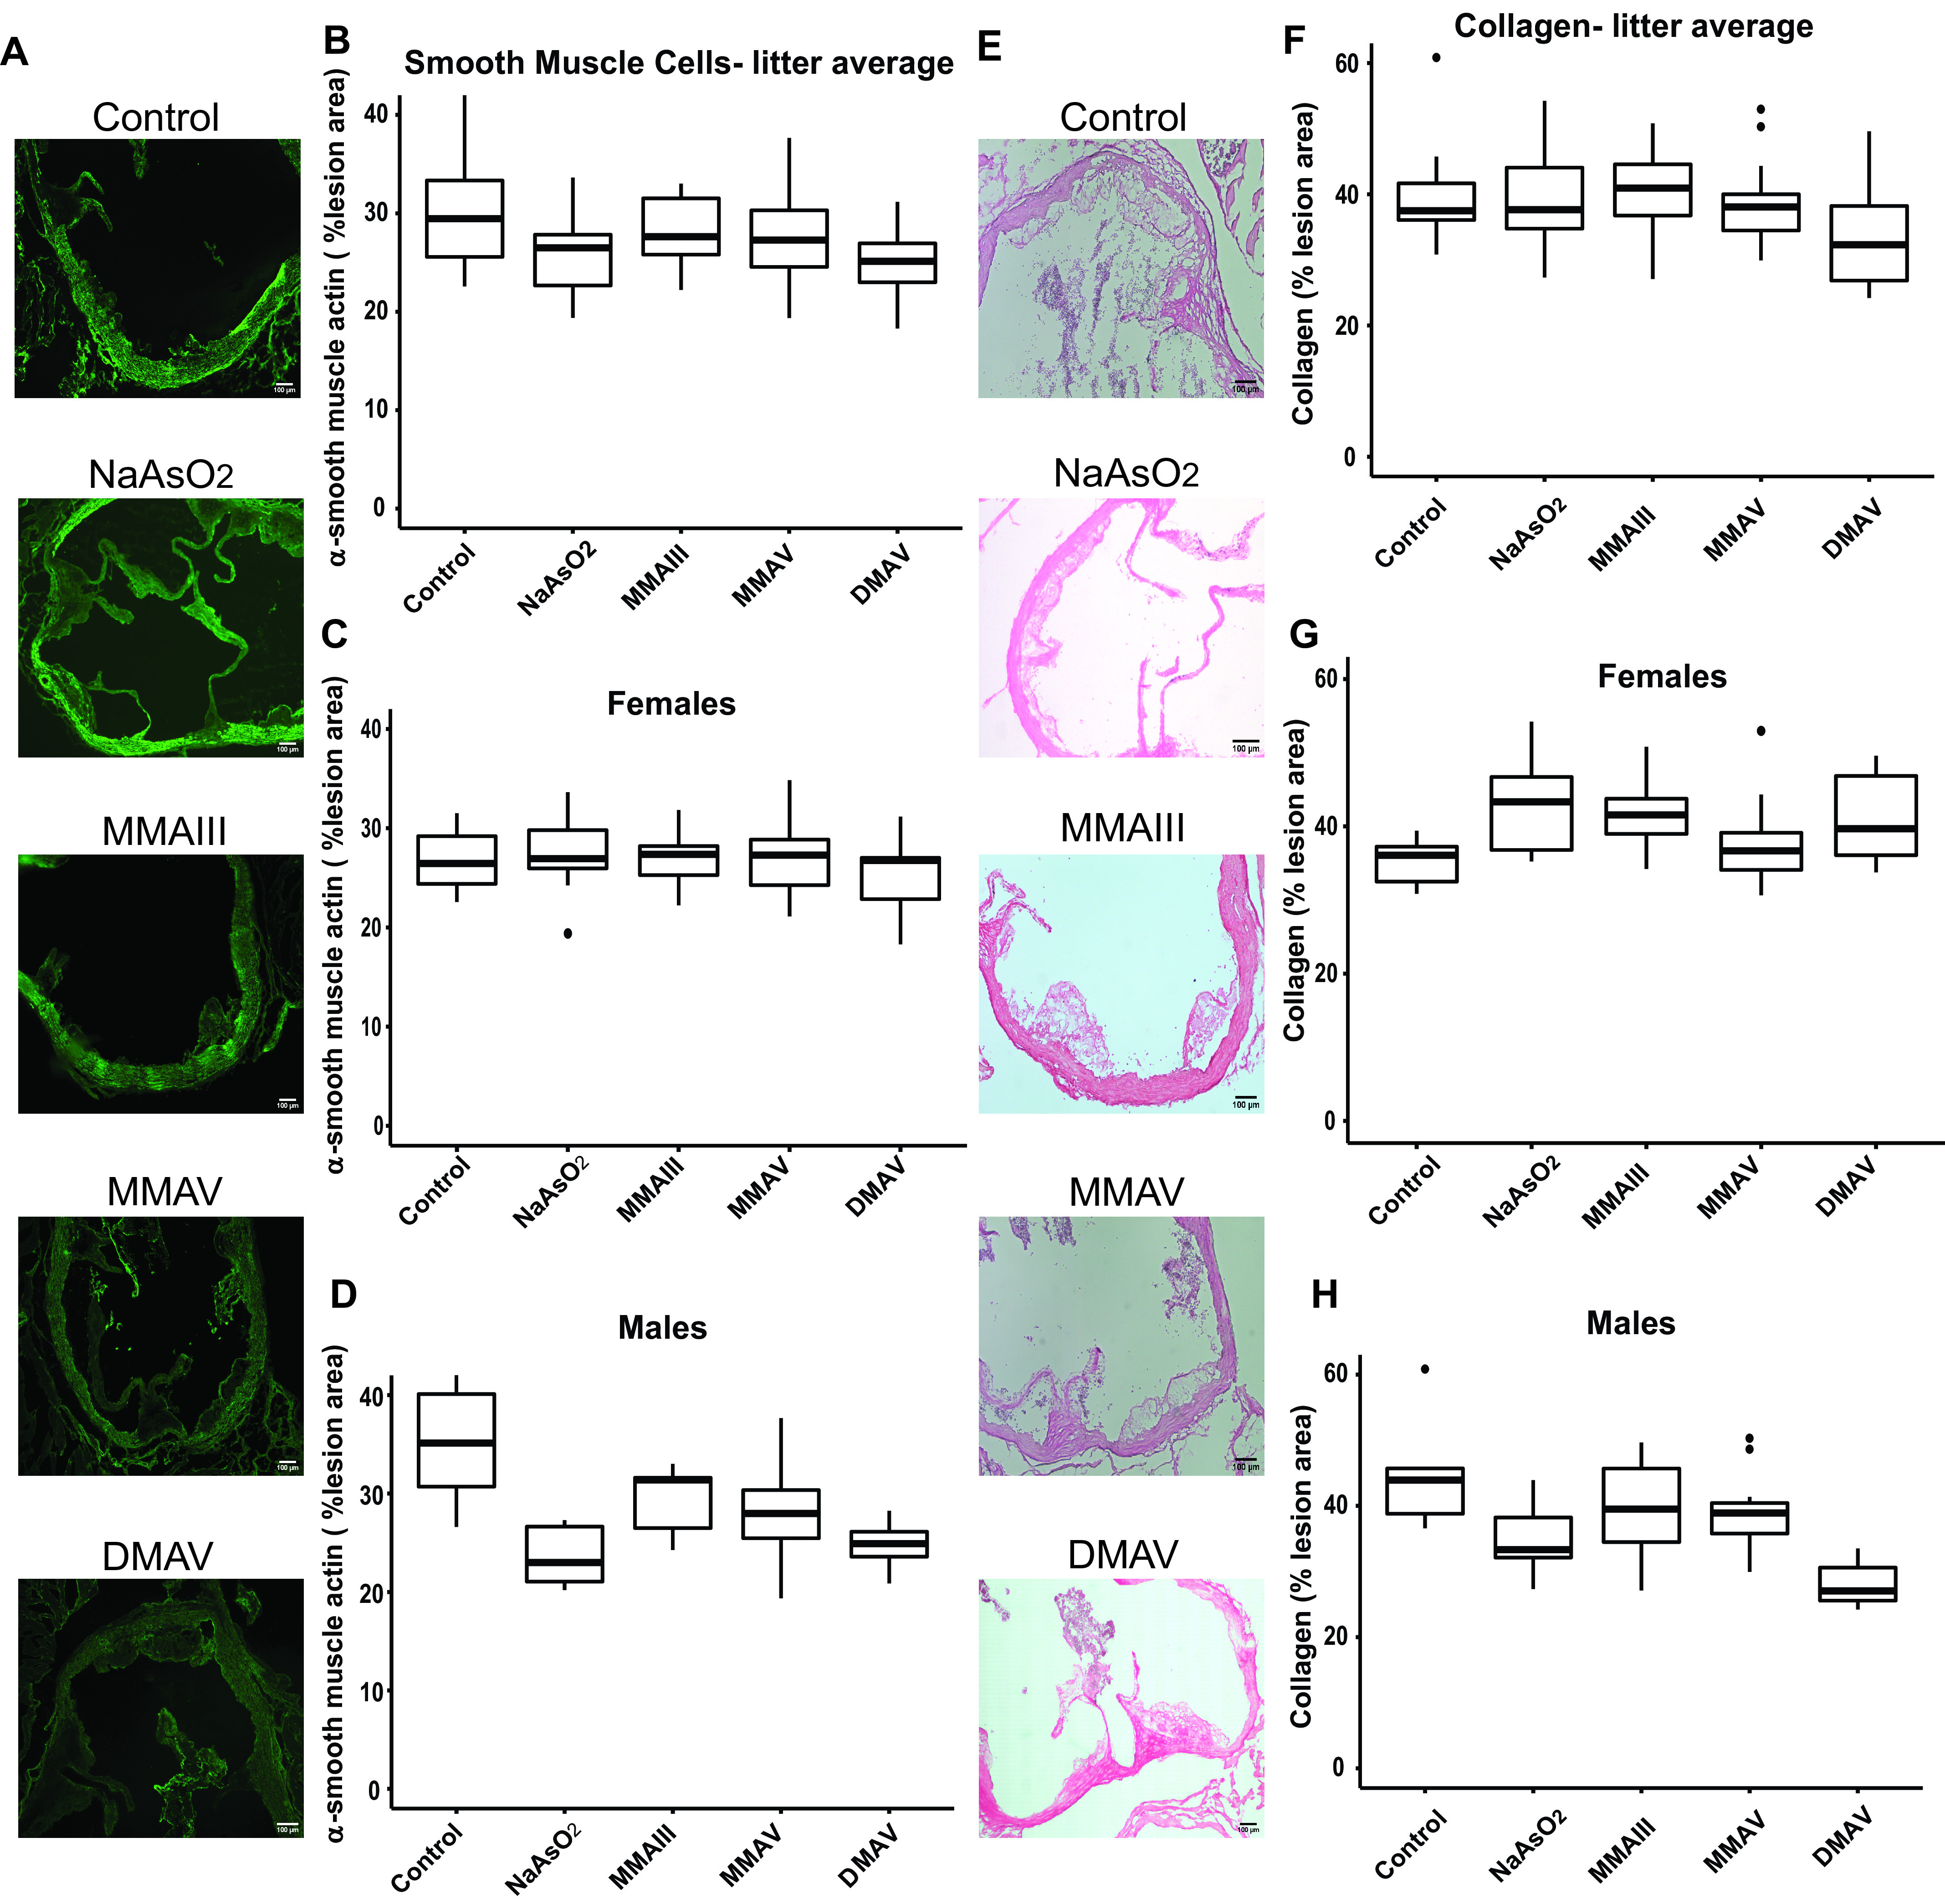
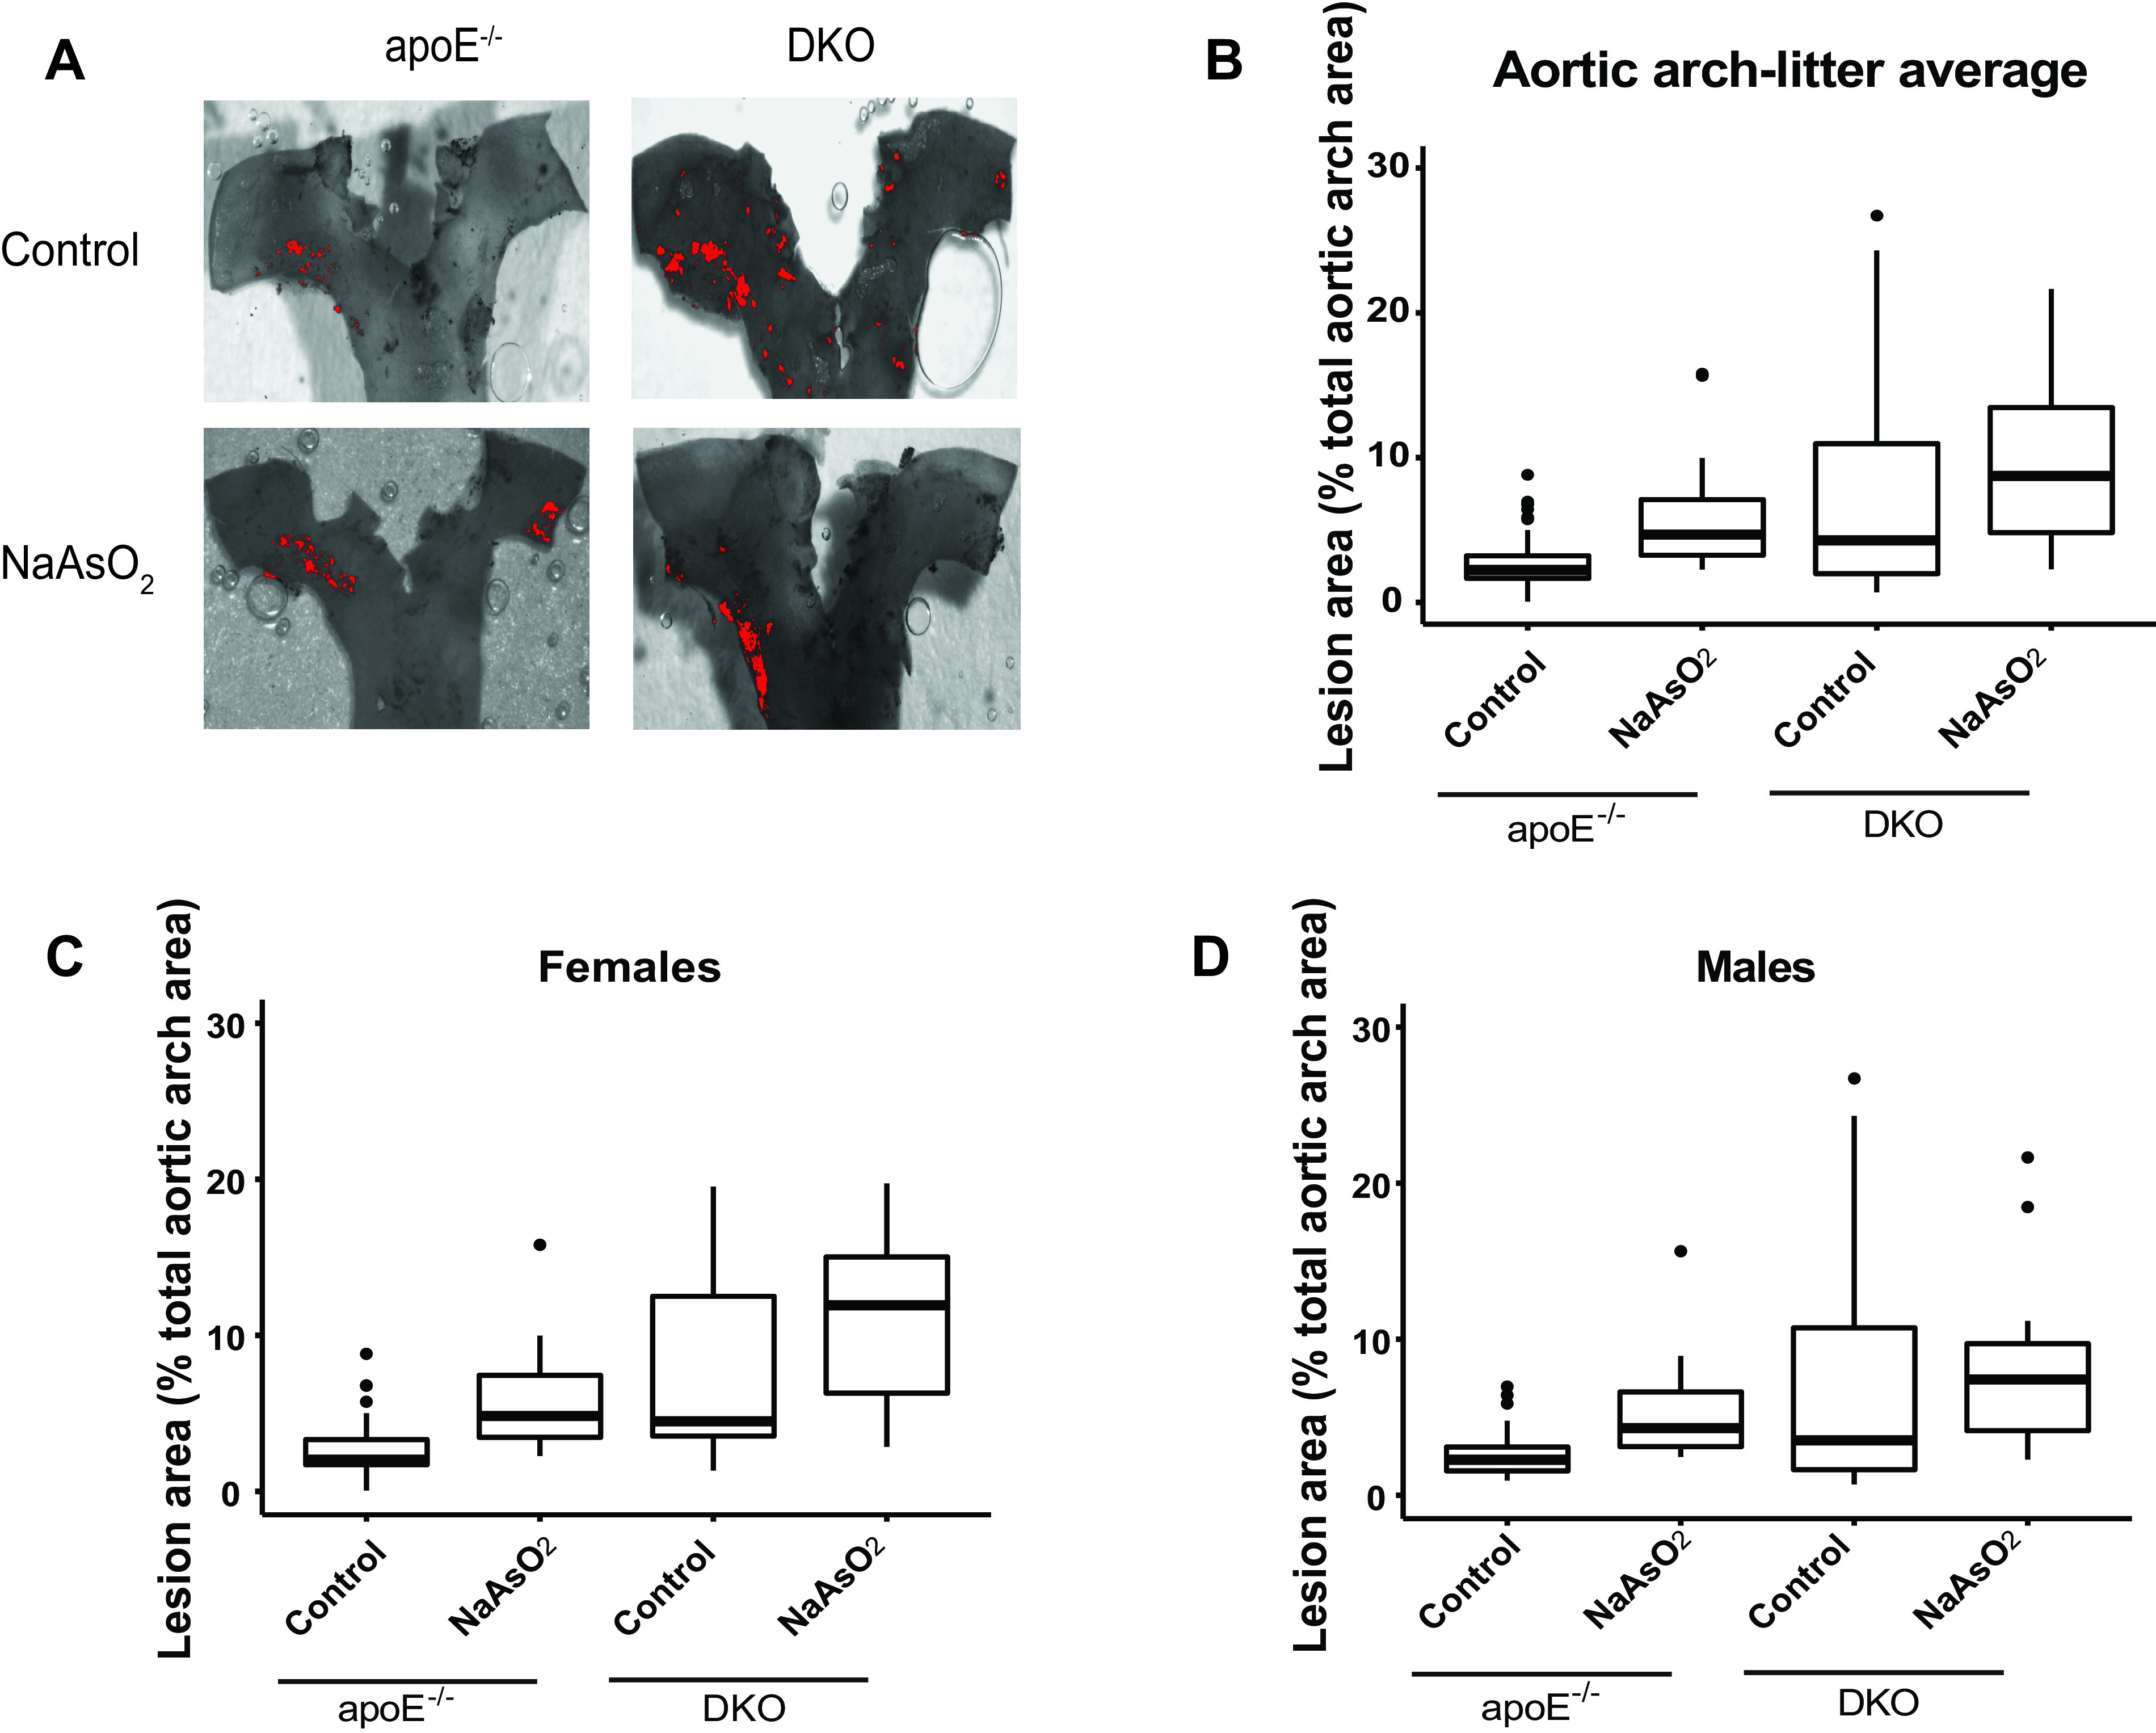
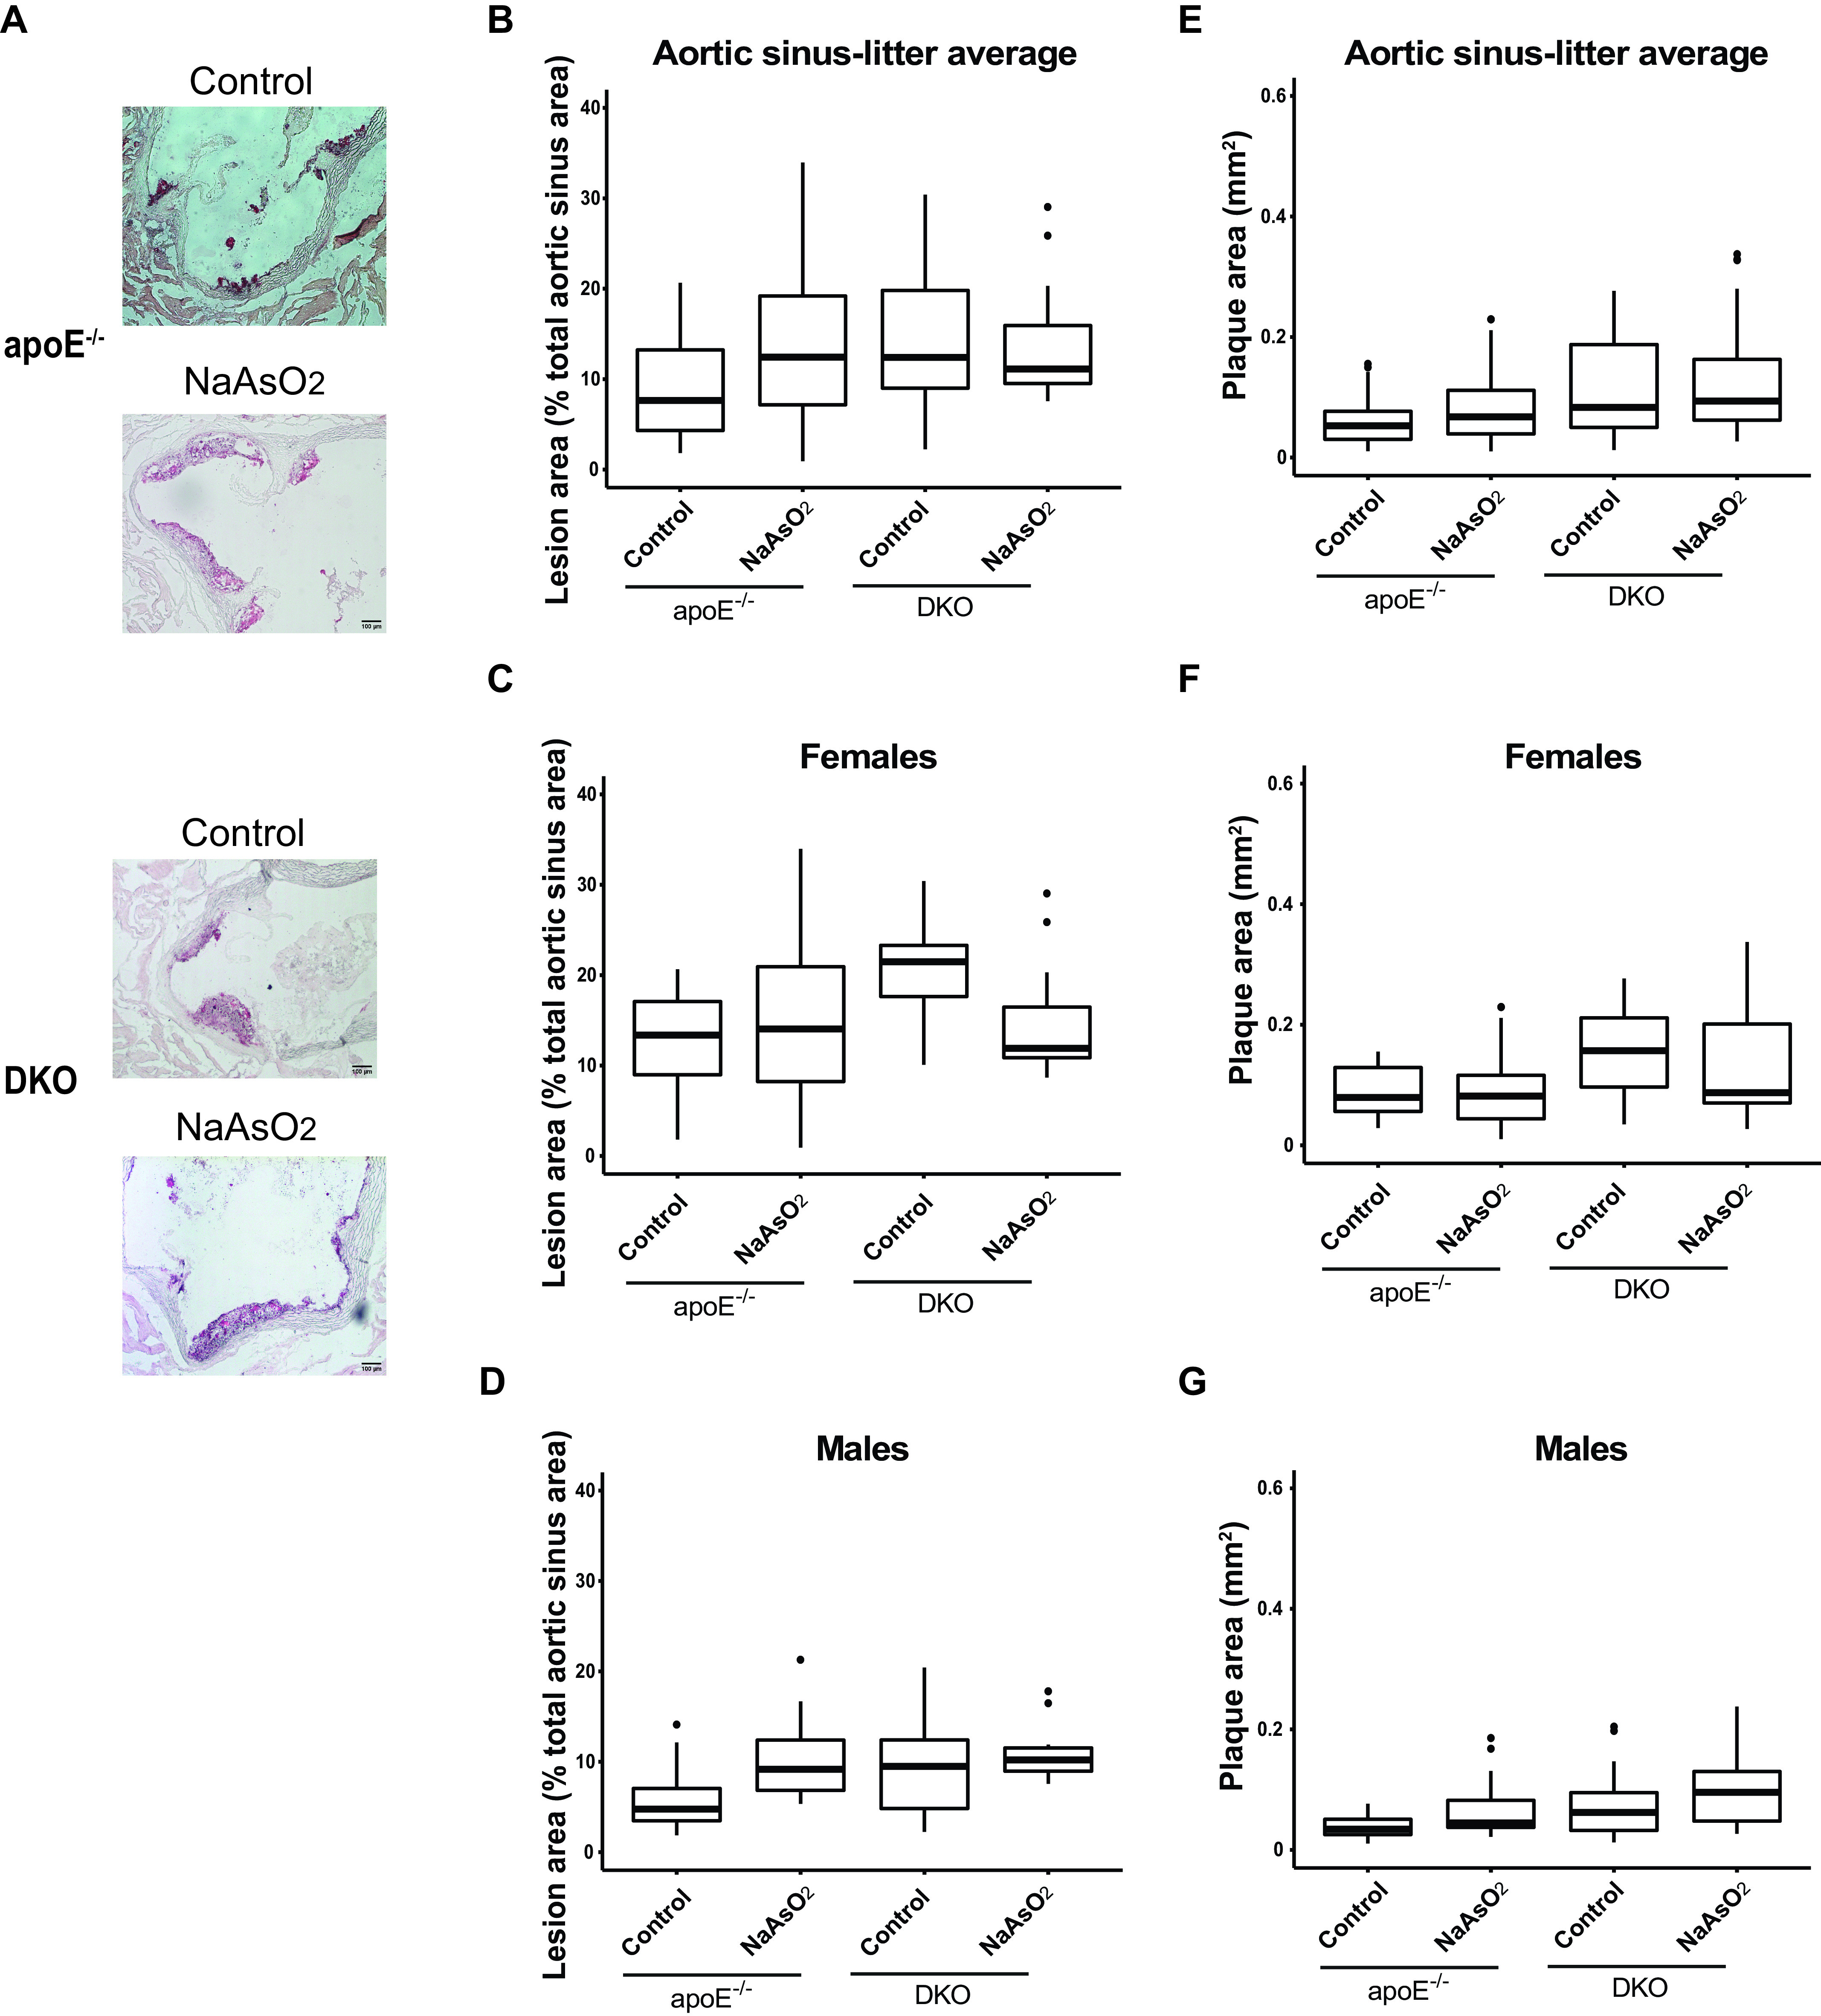
Results: Early life exposure to inorganic arsenic, and more profoundly methylated arsenicals, resulted in significantly larger plaques in the aortic arch and sinus in both sexes. Lipid levels in these plaques were higher without a substantial difference in macrophage numbers. Smooth muscle cell content was not altered, but collagen content was lower. Importantly, there were sex-specific differences in these observations, where males had higher lipids and lower collagen in the plaque, but females did not. In mice lacking As3MT, arsenic did not alter the plaque size, although the size was highly variable. In addition, control apoE-/-/As3MT-/- mice had significantly larger plaque size compared with control apoE-/-.

Conclusion: This study shows that early life exposure to inorganic and methylated arsenicals is pro-atherogenic with sex-specific differences in plaque composition and a potential role for As3MT in mice. https://doi.org/10.1289/EHP8171.


Figures

Figure 1A is a set of five oil red O stained cells titled control, sodium arsenite, monomethylarsonous acid, monomethylarsonic acid, and disodium methyl arsonate hexahydrate, depicting the aortic arches harvested from apolipoprotein E knockout mice exposed to 200 parts per billion arsenicals or maintained on tap water from conception to weaning. Figures 1B to 1D are box plots titled aortic arch-litter average, females, and males, plotting Lesion area (percentage total aortic arch area), ranging from 0 to 30 in increments of 10 (y-axis) across control, sodium arsenite, monomethylarsonous acid, monomethylarsonic acid, and disodium methyl arsonate hexahydrate (x-axis), respectively.
Figure 1.
Differences in plaque formation in the aortic arch in adult ApoE/ mice following early life arsenical exposure. ApoE/ mice were exposed to 200 ppb arsenicals (NaAsO2, MMAIII, MMAV, or DMAV) or maintained on tap water from conception to weaning. After weaning (4 wk), male and female pups were kept on tap water for an additional 14 wk. The percentage of the lesion area of the aortic arch was evaluated via en face oil red O staining. (A) Representative images. The box plots represent the distribution of unadjusted total lesion area as a percentage of total arch area, where midline, box limits, whiskers, and dots denote the median, interquartile range, minimum and maximum values, and outliers, respectively. (B) The combined data set is presented, and sex-specific data sets for (C) females and (D) are presented. The corresponding numeric data are presented in Table S4 and that adjusted by litter are presented in Tables 2 and . Note: DMAV, cacodylic acid; MMAIII, monomethylarsonous acid; MMAV, disodium methyl arsonate hexahydrate; NaAsO2, sodium arsenite.
Figure 2A is a set of five oil red O stained cells titled control, sodium arsenite, monomethylarsonous acid, monomethylarsonic acid, and disodium methyl arsonate hexahydrate, depicting aortic sinuses from apolipoprotein E knockout mice exposed to 200 parts per billion arsenicals or maintained on tap water from conception to weaning and the plaque area in the aortic sinus, with a 100-micrometer scale bar. Figures 2B to 2D are box plots titled aortic sinus-litter average, females, and males plotting Plaque area (percentage of total aortic sinus area), ranging from 0 to 50 in increments of 10 (y-axis) across control, sodium arsenite, monomethylarsonous acid, monomethylarsonic acid, and disodium methyl arsonate hexahydrate (x-axis), respectively. Figures 2E to 2G are box plots titled aortic sinus-litter average, females, and males plotting Plaque area (millimeters squared), ranging from 0 to 0.6 in increments of 0.2 (y-axis) across control, sodium arsenite, monomethylarsonous acid, monomethylarsonic acid, and disodium methyl arsonate hexahydrate (x-axis), respectively.
Figure 2.
Differences in plaque formation in the aortic sinus in adult apoE/ mice following early life arsenical exposure. ApoE/ mice were exposed as described for Figure 1 and the plaque area in the aortic sinus was assessed by oil red O staining. The percentage of the lesion area of the aortic sinus was evaluated via oil red O staining. (A) Representative images. The box plots represent the distribution of unadjusted total lesion area as a percentage of total sinus area, where midline, box limits, whiskers, and dots denote the median, interquartile range, minimum and maximum values, and outliers, respectively. (B) The combined data set is presented, and sex-specific data sets for (C) females and (D) are presented. In addition, the lesion area was measured as millimeters squared, and the unadjusted data distribution for all the litters from (E) each exposed group as well as that separated by (F) female and (G) male offspring is shown. The corresponding numeric data are presented in Table S4 and that adjusted by litter are presented in Tables 2 and . Note: DMAV, cacodylic acid; MMAIII, monomethylarsonous acid; MMAV, disodium methyl arsonate hexahydrate; NaAsO2, sodium arsenite.
Figure 3A is a set of five MOMA-2 stained cells titled control, sodium arsenite, monomethylarsonous acid, monomethylarsonic acid, and disodium methyl arsonate hexahydrate, depicting aortic sinus harvested from apolipoprotein E knockout mice exposed to 200 parts per billion arsenicals or maintained on tap water from conception to weaning and macrophage content in them, with a 100-micrometer scale bar. Figures 3B to 3D are box plots titled macrophage-litter average, females, and males plotting macrophage content (percentage lesion area), ranging from 0 to 40 in increments of 10 (y-axis) across control, sodium arsenite, monomethylarsonous acid, monomethylarsonic acid, and disodium methyl arsonate hexahydrate (x-axis), respectively. Figure 3E is a set of five oil red O stained cells titled control, sodium arsenite, monomethylarsonous acid, monomethylarsonic acid, and disodium methyl arsonate hexahydrate, depicting aortic sinuses from apolipoprotein E knockout mice exposed to 200 parts per billion arsenicals or maintained on tap water from conception to weaning and lipid content in the aortic sinus, with a 100-micrometer scale bar. Figure 3F to 3H are box plots titled lipids-litter average, females, and males plotting lipids (percentage of lesion area), ranging from 0 to 50 in increments of 10 (y-axis) across control, sodium arsenite, monomethylarsonous acid, monomethylarsonic acid, and disodium methyl arsonate hexahydrate (x-axis), respectively.
Figure 3.
Differences in plaque macrophage and lipid content in the aortic sinus in adult apoE/ mice following early life arsenical exposure. ApoE/ mice were exposed as described for Figure 1. (A–D) Macrophage and (E–H) lipid content were evaluated in the aortic sinus relative to the total lesion area using Moma-2 and oil red O staining, respectively. (A) and (E) show representative images. Scale bar: 100μm. (B) Box plots represent the data distribution of the unadjusted percentage of macrophages with respect to the total sinus area for all offspring in the control and arsenical-exposed groups, whereas those in (C) and (D) represent that in the female and male offspring, respectively. (E) Box plots represent the data distribution of the unadjusted percentage of lipid content with respect to the total sinus area for all offspring in the control and arsenical-exposed groups, whereas (F) and (G) represent that in the female and male offspring, respectively. The midline, box limits, whiskers, and dots denote the median, interquartile range, minimum and maximum values, and outliers, respectively. The corresponding numeric data are presented in Table S5 and that adjusted by litter are presented in Tables 4 and . Note: DMAV, cacodylic acid; MMAIII, monomethylarsonous acid; MMAV, disodium methyl arsonate hexahydrate; NaAsO2, sodium arsenite.
disodium methyl arsonate hexahydrate
Figure 4.
Differences in plaque SMC and collagen content in the aortic sinus in adult apoE/ mice following early life arsenical exposure. ApoE/ mice were exposed as described for Figure 1. (A–D) SMC and (E–H) collagen content were evaluated in the aortic sinus relative to the total lesion area using α-smooth muscle actin and picrosirius red staining, respectively. Scale bar: 100μm. (B) Represents the data distribution of the unadjusted percentage of SMCs with respect to the total sinus area for all offspring in the control and arsenical-exposed groups, whereas (C) and (D) represent that in the female and male offspring, respectively. (E) Represents the data distribution of the unadjusted percentage of collagen content with respect to the total sinus area for all offspring in the control and arsenical-exposed groups, whereas (F) and (G) represent that in the female and male offspring, respectively. The midline, box limits, whiskers, and dots denote the median, interquartile range, minimum and maximum values, and outliers, respectively. The corresponding numeric data are presented in Table S5 and that adjusted by litter are presented in Tables 4 and . Note: DMAV, cacodylic acid; MMAIII, monomethylarsonous acid; MMAV, disodium methyl arsonate hexahydrate; NaAsO2, sodium arsenite; SMC, smooth muscle cell.
Figure 5A is a matrix plotting apolipoprotein E knockout and apolipoprotein E and arsenic 3 methyltransferase double knockout (columns) across control and Sodium arsenite (rows). Figures 5B to 5D are box plots titled aortic arch-litter average, females, and males plotting Lesion area (percentage of total aortic arch area), ranging from 0 to 30 in increments of 10 (y-axis) across apolipoprotein E and arsenic 3 methyltransferase each for control and Sodium arsenite (x-axis), respectively.
Figure 5.
Differences in plaque formation in the aortic arch in adult apoE//As3MT/ DKO mice following early life arsenical exposure. ApoE/ or DKO mice were exposed to 200 ppb NaAsO2 or maintained on tap water from conception to weaning. After weaning (4 wk), animals were kept on tap water for an additional 13 wk. The percentage of the lesion area of the aortic arch was evaluated via oil red O staining. (A) Representative images. Scale bar: 100μm. The box plots represent the distribution of unadjusted total lesion area as a percentage of total arch area. (B) The combined data set is presented, and sex-specific data sets for (C) females and (D) are presented. The midline, box limits, whiskers, and dots denote the median, interquartile range, minimum and maximum values, and outliers, respectively. The corresponding numeric data are presented in Table S6 and that adjusted by litter are presented in Tables 6 and . Note: DKO, double-knock out; NaAsO2, sodium arsenite.
Figure 6A is two sets of two oil red O stained cells titled apolipoprotein E knockout and double knockout each for control and sodium arsenite, depicting the percentage of the lesion area of the aortic sinus in adult mice, with a 100-micrometer scale bar. Figure 6B to 6D are box plots titled Aortic sinus-litter average, Females, and Males plotting Lesion area (percentage total aortic sinus area), ranging from 0 to 40 in increments of 10 (y-axis) across apolipoprotein E and arsenic 3 methyltransferase each for control and sodium arsenite (x-axis), respectively. Figure 6E to 6G are box plots titled Aortic sinus-litter average, Females, and Males plotting Plaque area (millimeter squared), ranging from 0 to 0.6 in increments of 0.2 (y-axis) across apolipoprotein E and arsenic 3 methyltransferase each for control and sodium arsenite (x-axis), respectively.
Figure 6.
Differences in plaque formation in the aortic sinus in adult apoE/ As3mt/ DKO mice following early life arsenical exposure. ApoE/ or DKO mice were exposed as described for Figure 1 and the plaque area in the aortic sinus was assessed by oil red O staining. The percentage of the lesion area of the aortic sinus was evaluated via oil red O staining. (A) Representative images. The box plots represent the distribution of unadjusted total lesion area as a percentage of the total sinus area, where midline, box limits, whiskers, and dots denote the median, interquartile range, minimum and maximum values, and outliers respectively, in the data set. (B) The combined data set is presented, and sex-specific data sets for (C) females and (D) are presented. In addition, the lesion area was also measured as millimeters squared, and the unadjusted data distribution for all the litters from (E) each exposed group as well as that separated by (F) female and (G) male offspring is shown. The corresponding numeric data are presented in Table S6 and that adjusted by litter are presented in Tables 6 and . Note: DKO, double-knock out; DMAV, cacodylic acid; MMAIII, monomethylarsonous acid; MMAV, disodium methyl arsonate hexahydrate; NaAsO2, sodium arsenite.

Similar articles

Cited by

References

    1. ATSDR (Agency for Toxic Substances and Disease Registry). 2007. Toxicological Profile for Arsenic. Atlanta, GA: U.S. Department of Health and Human Services, Public Health Service. 2007. https://stacks.cdc.gov/view/cdc/11481 [accessed 16 April 2021].
    1. Bailey K, Fry RC. 2014. Long-term health consequences of prenatal arsenic exposure: links to the genome and the epigenome. Rev Environ Health 29(1–2):9–12, PMID: 24552957, 10.1515/reveh-2014-0006. - DOI - PMC - PubMed
    1. Balakrishnan P, Vaidya D, Franceschini N, Voruganti VS, Gribble MO, Haack K, et al. . 2017. Association of cardiometabolic genes with arsenic metabolism biomarkers in American Indian communities: the Strong Heart Family Study (SHFS). Environ Health Perspect 125(1):15–22, PMID: 27352405, 10.1289/EHP251. - DOI - PMC - PubMed
    1. Bates D, Maechler M, Bolker B, Walker S. 2014a. lme4: linear mixed-effects models using Eigen and S4. Version 1.1-7.
    1. Bieler G, Williams R. 1995. Cluster sampling techniques in quantal response teratology and developmental toxicity studies. Biometrics 51(2):764–776, PMID: 7662858, 10.2307/2532963. - DOI - PubMed

Publication types

Grants and funding

LinkOut - more resources