. 2021 Jun 22;6(12):e145200.
doi: 10.1172/jci.insight.145200.

Molecular clock REV-ERBα regulates cigarette smoke-induced pulmonary inflammation and epithelial-mesenchymal transition

Affiliations

Molecular clock REV-ERBα regulates cigarette smoke-induced pulmonary inflammation and epithelial-mesenchymal transition

Qixin Wang et al. JCI Insight. .

Abstract

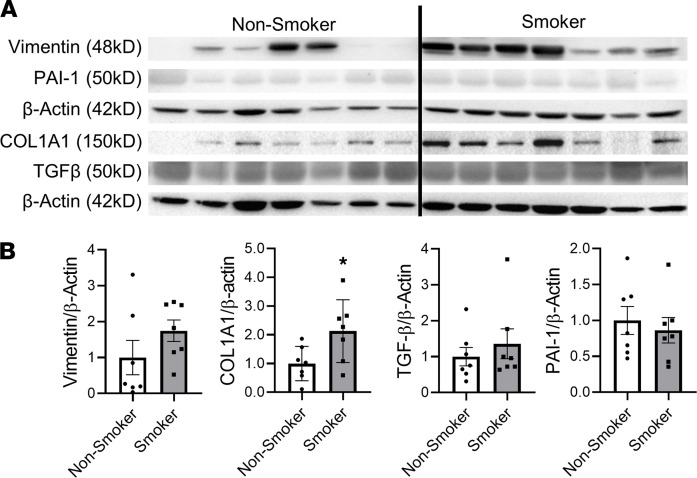
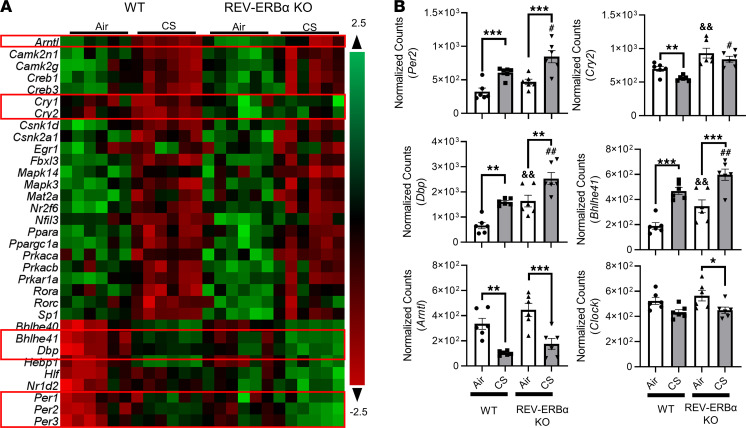
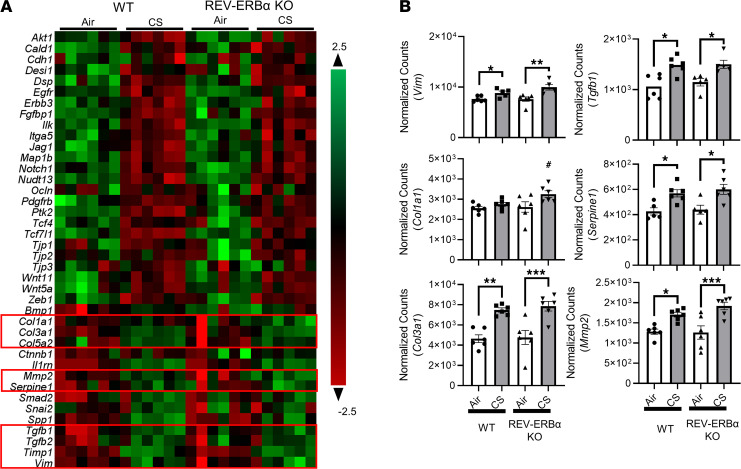
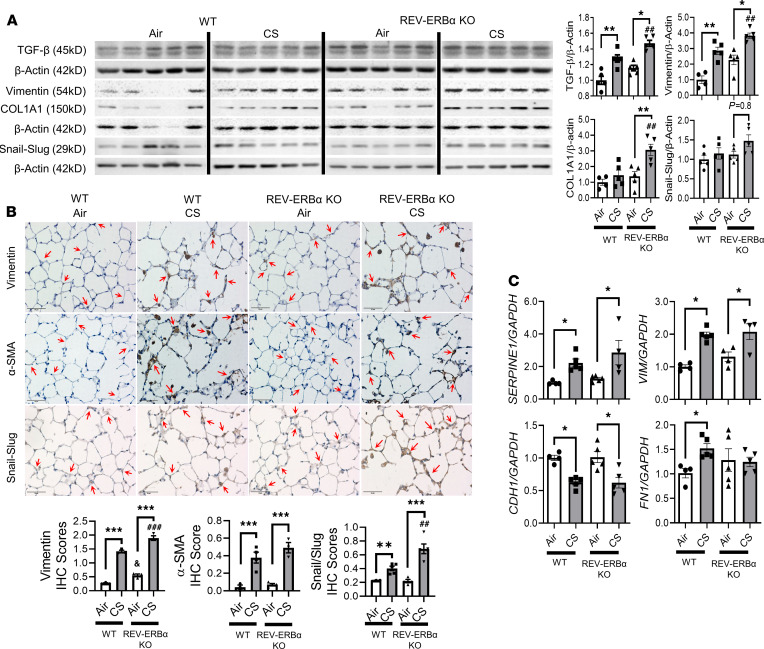
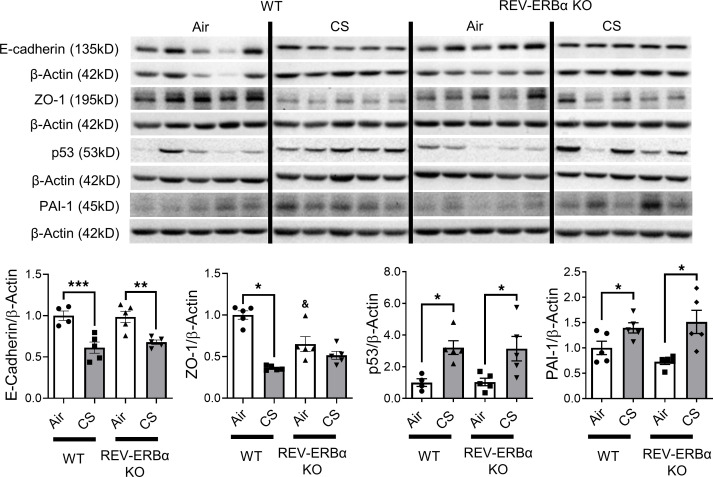
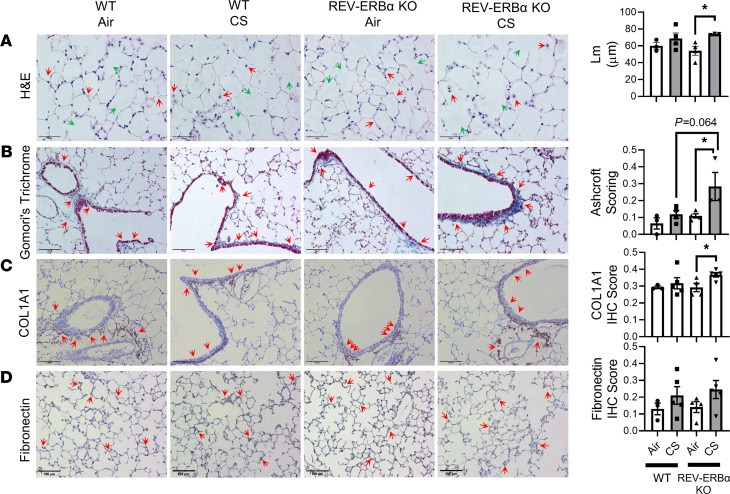
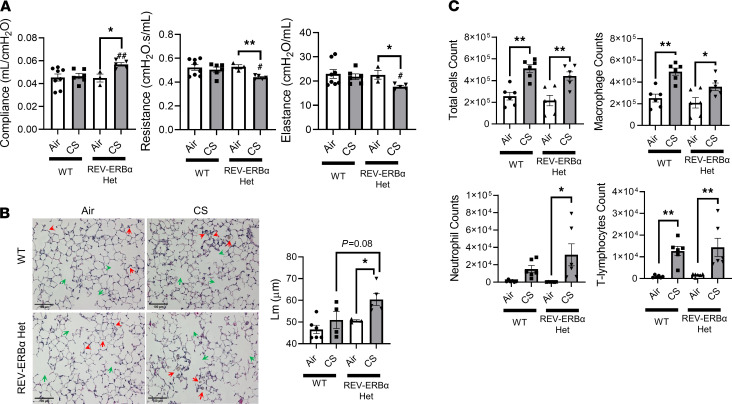
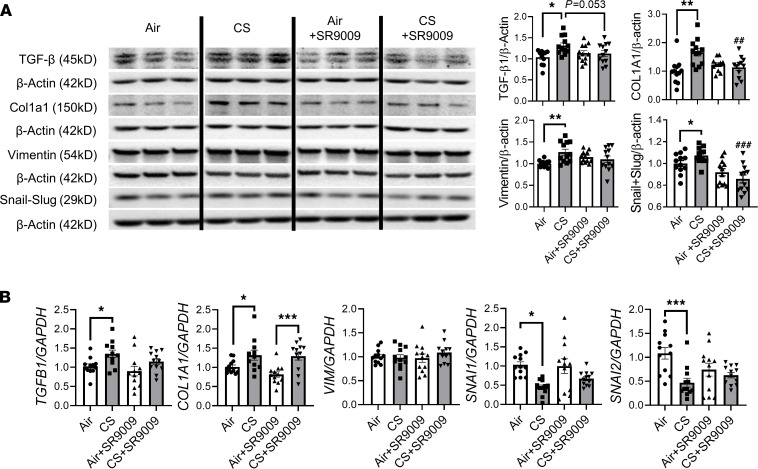
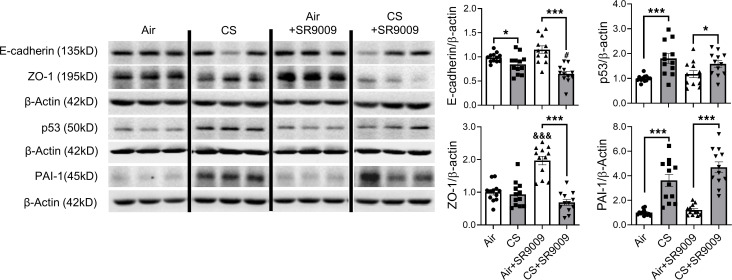
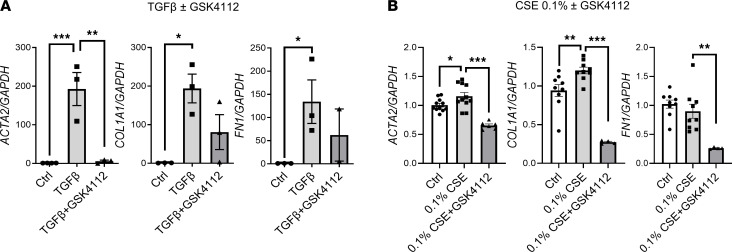
Cigarette smoke (CS) is the main etiological factor in the pathogenesis of emphysema/chronic obstructive pulmonary disease (COPD), which is associated with abnormal epithelial-mesenchymal transition (EMT). Previously, we have shown an association among circadian rhythms, CS-induced lung inflammation, and nuclear heme receptor α (REV-ERBα), acting as an antiinflammatory target in both pulmonary epithelial cells and fibroblasts. We hypothesized that molecular clock REV-ERBα plays an important role in CS-induced circadian dysfunction and EMT alteration. C57BL/6J WT and REV-ERBα heterozygous (Het) and -KO mice were exposed to CS for 30 days (subchronic) and 4 months (chronic), and WT mice were exposed to CS for 10 days with or without REV-ERBα agonist (SR9009) administration. Subchronic/chronic CS exposure caused circadian disruption and dysregulated EMT in the lungs of WT and REV-ERBα-KO mice; both circadian and EMT dysregulation were exaggerated in the REV-ERBα-KO condition. REV-ERBα agonist, SR9009 treatment reduced acute CS-induced inflammatory response and abnormal EMT in the lungs. Moreover, REV-ERBα agonist (GSK4112) inhibited TGF-β/CS-induced fibroblast differentiation in human fetal lung fibroblast 1 (HFL-1). Thus, CS-induced circadian gene alterations and EMT activation are mediated through a Rev-erbα-dependent mechanism, which suggests activation of REV-ERBα as a novel therapeutic approach for smoking-induced chronic inflammatory lung diseases.

Keywords: COPD; Inflammation; Pulmonology.


Conflict of interest statement

Conflict of interest: The authors have declared that no conflict of interest exists.

Figures

Figure 1
Figure 1. Mesenchymal markers increased in smokers compared with nonsmokers.
Lungs from smokers and nonsmokers were homogenized and probed with epithelial-mesenchymal transition (EMT) markers, and protein abundance of different markers were analyzed by Western blotting. Representative blot images of target proteins (vimentin, COL1A1, TGF-β, and PAI-1) were shown in A. Densitometry is used for fold change of specific protein targets (B), and actin was used as endogenous controls for normalization. All the bands of different targets were probed on the same membrane. Vimentin and PAI-1 were probed in the same membrane, and COL1A1 and TGF-β were probed in the same membrane. Data are shown as mean ± SEM (n = 7, *P < 0.05, paired Student’s t test).
Figure 2
Figure 2. Subchronic cigarette smoke exposure affects circadian focused mRNA expression analyzed by NanoString.
Total RNA was isolated from the lungs of mice exposed to air and cigarette smoke (CS) for 30 days. Our customized NanoString panel (circadian gene focused) was used to screen the potential targets via nCounter SPRINT Profiler. Normalization of absolute RNA count and data analysis were done by nSolver software. The overview of all the dysregulated targets is shown as a heatmap (A), and selected gene transcription changes are shown separately (B). Data are shown as mean ± SEM (n = 6; *P < 0.05, **P < 0.01, ***P < 0.001 between groups; #P < 0.05, ##P < 0.01 compared with CS-exposed WT group; &&P < 0.01 compared with WT air controls, 1-way ANOVA with Šidák correction).
Figure 3
Figure 3. Subchronic CS exposure affects EMT-focused mRNA expression analyzed by NanoString.
Total RNA was isolated from the lungs of mice exposed to air and CS for 30 days. Our customized NanoString panel (EMT gene focused) was used to screen the potential targets via nCounter SPRINT Profiler. Normalization of absolute RNA count and data analysis were performed by nSolver software. The overview of all the dysregulated targets was shown as a heatmap (A), and selected gene transcription changes were shown separately (B). Data are shown as mean ± SEM (n = 6; *P < 0.05, **P < 0.01, ***P < 0.001 between groups; #P < 0.05 compared with CS- exposed WT group; 1-way ANOVA with Šidák correction).
Figure 4
Figure 4. Subchronic CS exposure–induced mesenchymal transition in REV-ERBα–dependent manner.
Protein abundance of mesenchymal markers in mouse lung affected by subchronic CS exposure (1 month/30 days) were analyzed by Western blotting. (A) Representative blot images (TGF-β, vimentin, COL1A1, and snail-slug) are shown, and densitometry analyses are done individually. Different groups were run on the same membrane but were noncontiguous. COL1A1 and vimentin were probed in the same membrane, and β-actin was used as an endogenous control (n = 5/group). (B) The localizations of dysregulated vimentin, α-smooth muscle actin (α-SMA), and snail-slug were observed via immunohistochemical staining. Regions of interest were pointed by red-arrow. Relative IHC score based on positive staining intensity was performed in a blind manner (n = 3–4/group); specific protein accumulation in alveoli was denoted by red arrows (original magnification, ×40; scale bar: 50 μm) (C). RNA isolated from lung tissues were used to determine the gene expression (Serpine1, Vim, Cdh1, and Fn1) by qRT-PCR. GAPDH was used as an endogenous control, and gene fold change was calculated by 2-ΔΔCt method (n = 4–5/group). Data are shown as mean ± SEM (*P < 0.05, **P < 0.01, ***P < 0.001 between groups; #P < 0.05 compared with CS-exposed WT group; &P < 0.05 compared with WT air controls; 1-way ANOVA with Šidák correction).
Figure 5
Figure 5. Protein abundance of EMT markers were affected by subchronic CS exposure.
Lungs from mice exposed to CS for 30 days were homogenized, and protein abundances were measured by Western blotting. Representative blot images are shown and relative protein fold change of E-cadherin, ZO-1, p53, and PAI-1 are analyzed based on densitometry with β-actin as the endogenous control. Different groups were run on the same membrane, but were noncontiguous. Data are shown as mean ± SEM (n = 5, *P < 0.05 between groups; **P < 0.01 between groups, ***P < 0.001 between groups; &P < 0.05 compared with WT air controls; 1-way ANOVA with Šidák correction).
Figure 6
Figure 6. Airspace enlargement and abnormal ECM deposition were induced by subchronic CS exposure in REV-ERBα–KO mice.
Subchronic 30 days of CS exposure induced airspace enlargement observed by (A). H&E (original magnification, ×40; scale bar: 50 μm) (green arrows indicated airspace enlargement and red arrows indicated inflammatory responses) and abnormal ECM deposition observed via B. Gomori’s Trichrome (original magnification, ×20) staining (scale bar: 100 μm) (C). IHC staining COL1A1 (original magnification, ×20; scale bar: 100 μm) (D). Fibronectin (original magnification, ×20; scale bar: 100 μm). Relative IHC score based on positive staining intensity was performed in a blind manner and denoted by red arrows. Data are shown as mean ± SEM (n = 3–4/group, *P < 0.05; 1-way ANOVA with Šidák correction).
Figure 7
Figure 7. Altered airspace enlargement, lung mechanics, and inflammation were induced by chronic CS exposure in REV-ERBα Het mice.
Lung mechanics, inflammatory cell influx in bronchoalveolar lavage fluid (BALF), and airspace enlargement induced by chronic CS exposure (4 months) were determined by Flexivent, flow cytometry, and lung morphometry. (A) Lung mechanics (lung compliance resistance and elastance) were measured after chronic CS exposure. (B) Lung histological analysis were conducted using H&E-stained sections, and mean linear intercept (Lm) analysis was performed using Metamorph software (original magnification, ×20; scale bar: 100 μm) from H&E-stained images (green arrows indicated airspace enlargement and red arrows indicated inflammatory responses). (C) Total cell was counted by Bio-Rad cell counter using Trypan blue staining. Differential inflammatory cell counts (macrophage, neutrophil, and T lymphocytes) were determined (cells/mL) by flow cytometry. Data are shown as mean ± SEM (n = 5–10; *P < 0.05, **P < 0.01, between groups; #P < 0.05, ##P < 0.01 compared with CS-exposed WT group; 1-way ANOVA with Šidák correction).
Figure 8
Figure 8. Acute CS exposure–induced inflammatory response was reduced by REV-ERBα agonist.
Proinflammatory cell influx and cytokines in BALF induced by acute CS exposure (10 days) were determined by flow cytometry and Luminex. (A) Total number of inflammatory cells was counted by Bio-Rad cell counter using Trypan blue staining. Differential inflammatory cell counts (macrophage, neutrophil, CD4/CD8 T lymphocytes) were determined (cells/mL) by flow cytometry. (B) Relative cytokines were determined by Luminex. A total of 2 technical repeats were done to calculate the final concentration. Data are shown as mean ± SEM (n = 10; *P < 0.05, **P < 0.01, ***P < 0.001, between groups; ##P < 0.01 compared with CS exposed WT group; 1-way ANOVA with Šidák correction).
Figure 9
Figure 9. Acute CS exposure–induced mesenchymal transitions were inhibited by REV-ERBα agonist.
Lungs from mice exposed to acute CS exposure with or without REV-ERBα agonist (SR9009) administration were homogenized and protein abundance were analyzed by Western blotting. (A) Representative blot (TGF-β, vimentin, COL1A1, and snail-slug) images are shown, and densitometry analyses are done individually. Different groups were run on the same membrane but were noncontiguous, and β-actin was used as an endogenous control. (B) RNA isolated from lung tissues was used to determine the gene expression (Tgfb1, Col1a1, Vim, Snai1, and Snai2) by qRT-PCR. GAPDH was used as an endogenous control, and gene fold change was calculated by 2-ΔΔCt method (n = 11–12/group). Data are shown as mean ± SEM (*P < 0.05, **P < 0.01, ***P < 0.001, between groups; ##P < 0.01, ###P < 0.001 compared with CS-exposed group; 1-way ANOVA with Šidák correction).
Figure 10
Figure 10. Protein abundance of EMT markers were affected by acute CS exposure.
Lungs from mice exposed to CS for 10 days with SR9009 administration were homogenized, and protein abundance were measured by Western blotting. Representative blot images are shown, and relative protein fold changes of E-cadherin, ZO-1, p53, and PAI-1 are analyzed based on densitometry with β-actin as the endogenous control. E-cadherin and ZO-1 were probed in the same membrane. Different groups were run on the same membrane, but were noncontiguous. Data are shown as mean ± SEM (n = 11–12. *P < 0.05, ***P < 0.001 between groups; &&&P < 0.001 compared with WT air controls; 1-way ANOVA with Šidák correction).
Figure 11
Figure 11. TGF-β/CS–activated fibroblast differentiation was inhibited by REV-ERBα agonist.
Human lung fibroblast (HFL-1) cells were treated with (A) TGF-β with or without REV-ERBα agonist (GSK4112) for 3 days or (B) 0.1% CSE with or without GSK4112 for 2 days. RNA isolated from cells were used to determine the gene expressions (ACTA2, COL1A1, and FN1) by qRT-PCR. GAPDH was used as an endogenous control for normalization. Data are shown as mean ± SEM (n = 3 for A, and n = 4–9 for B; *P < 0.05, **P < 0.01, ***P < 0.001, between groups; 1-way ANOVA with Šidák correction for A, and unpaired Student’s t test for B).

References

    1. Blanco I, et al. Geographic distribution of COPD prevalence in the world displayed by Geographic Information System maps. Eur Respir J. 2019;54(1):1900610. doi: 10.1183/13993003.00610-2019. - DOI - PubMed
    1. Zhang L, et al. Epigenetic modifications and therapy in chronic obstructive pulmonary disease (COPD): an update review. COPD. 2020;17(3):333–342. doi: 10.1080/15412555.2020.1780576. - DOI - PubMed
    1. Yao H, et al. SIRT1 redresses the imbalance of tissue inhibitor of matrix metalloproteinase-1 and matrix metalloproteinase-9 in the development of mouse emphysema and human COPD. Am J Physiol Lung Cell Mol Physiol. 2013;305(9):L615–L624. doi: 10.1152/ajplung.00249.2012. - DOI - PMC - PubMed
    1. van der Vaart H, et al. Acute effects of cigarette smoke on inflammation and oxidative stress: a review. Thorax. 2004;59(8):713–721. doi: 10.1136/thx.2003.012468. - DOI - PMC - PubMed
    1. Sundar IK, et al. Influenza A virus-dependent remodeling of pulmonary clock function in a mouse model of COPD. Sci Rep. 2015;5(1):9927. doi: 10.1038/srep09927. - DOI - PMC - PubMed

Publication types

MeSH terms

Substances

LinkOut - more resources