

CENP-C functions in centromere assembly, the maintenance of CENP-A asymmetry and epigenetic age in Drosophila germline stem cells
- PMID: 34014920
- PMCID: PMC8136707
- DOI: 10.1371/journal.pgen.1009247
CENP-C functions in centromere assembly, the maintenance of CENP-A asymmetry and epigenetic age in Drosophila germline stem cells
Abstract
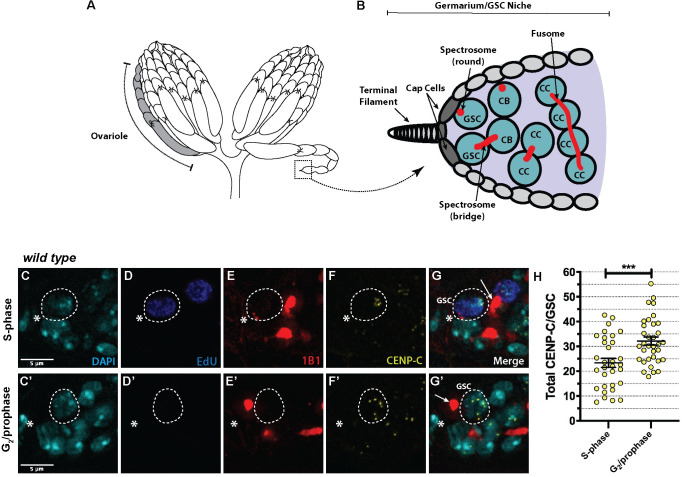
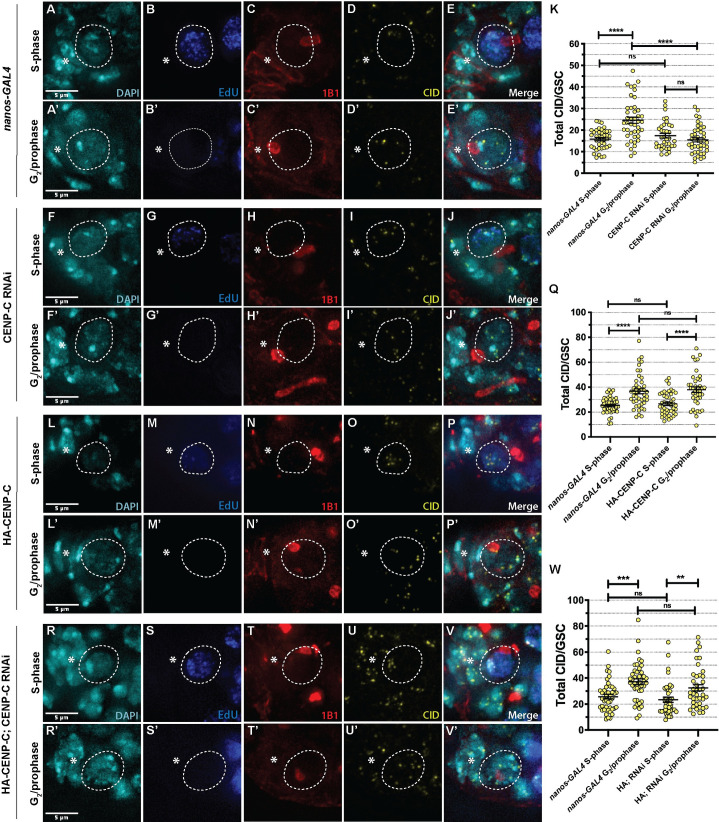
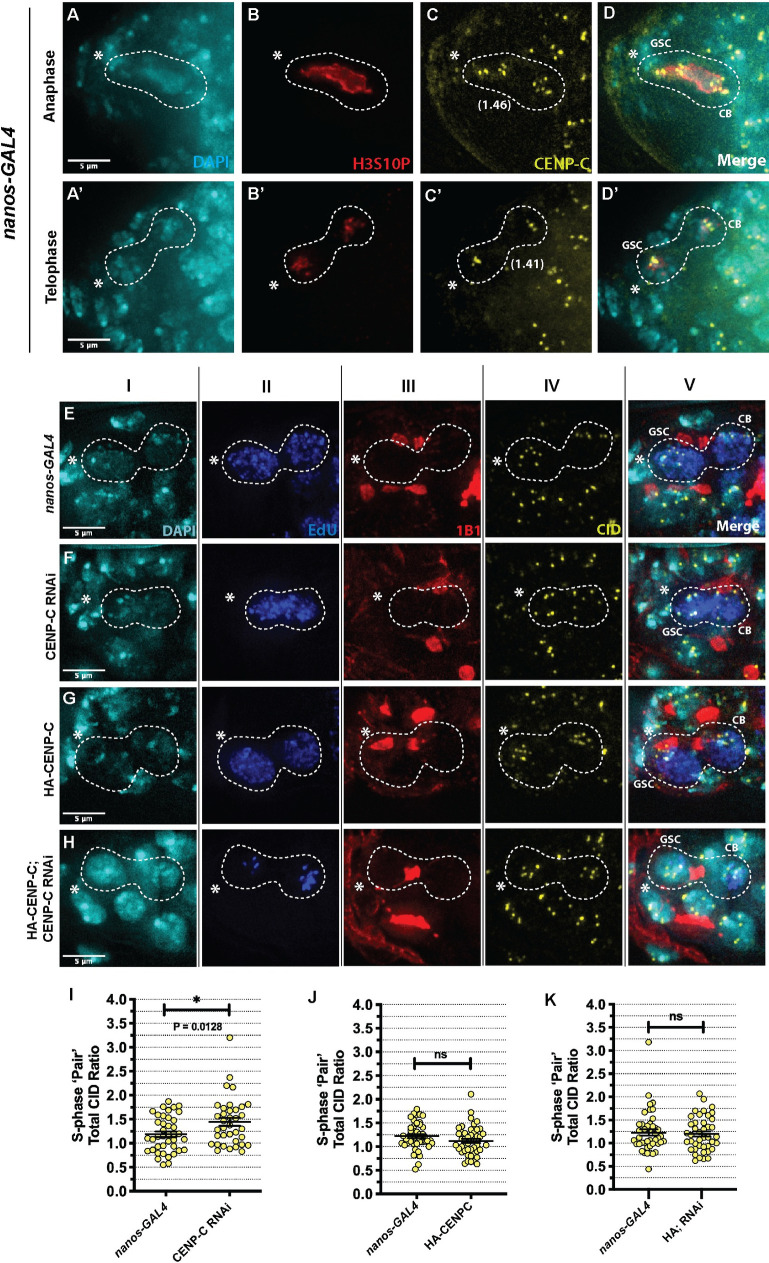
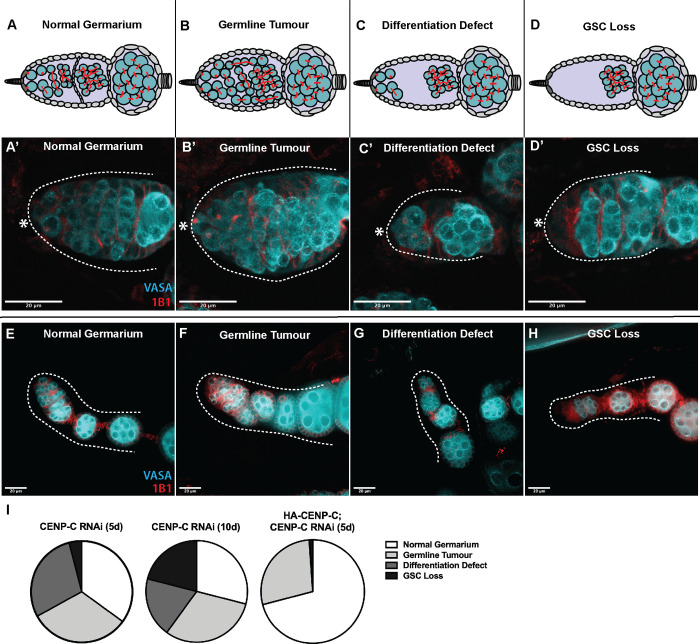
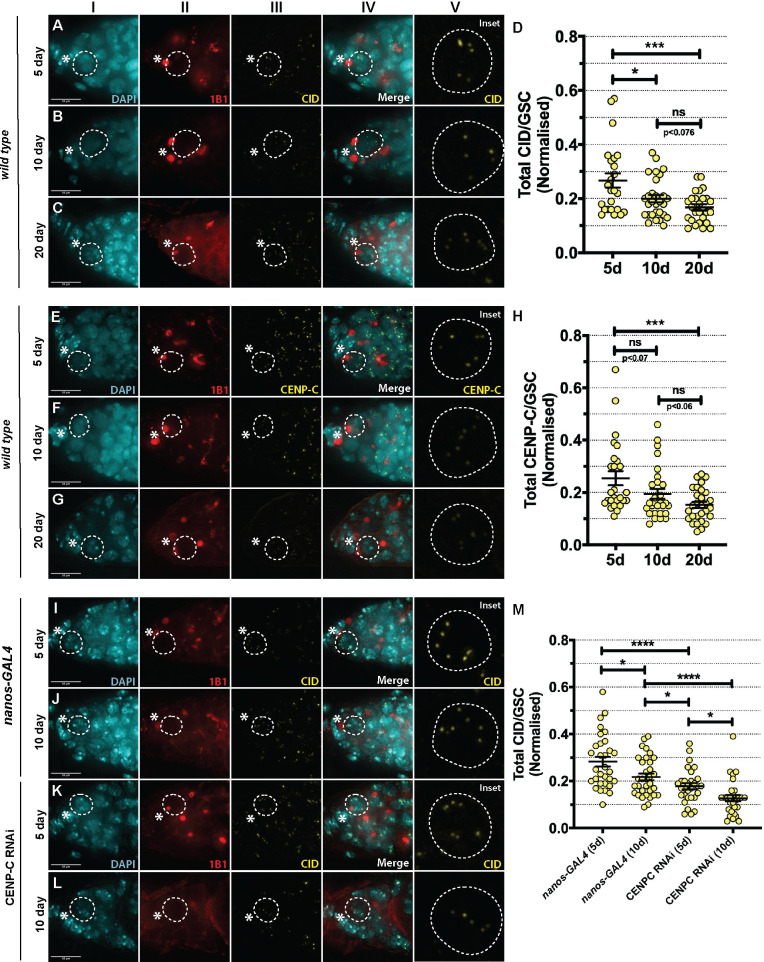
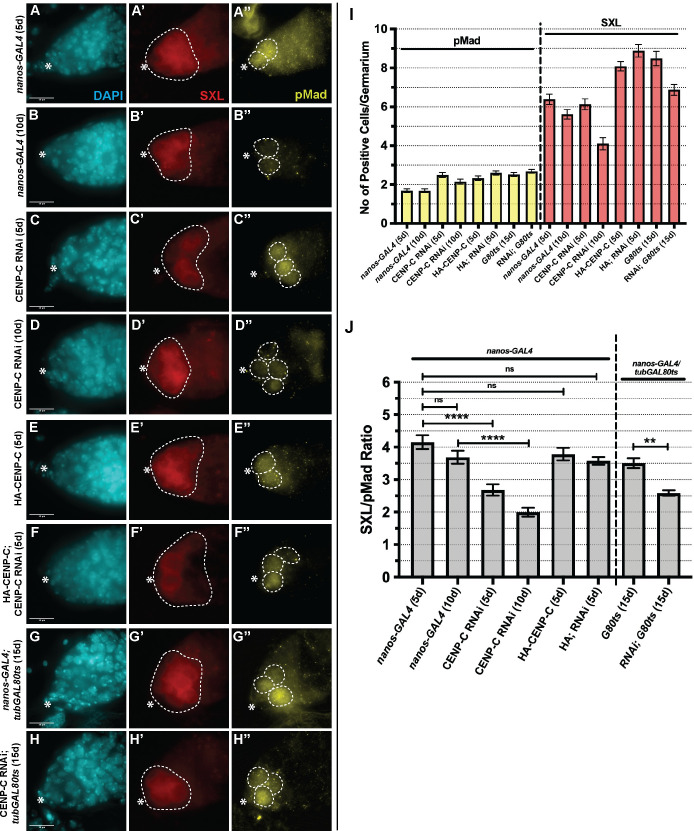
Germline stem cells divide asymmetrically to produce one new daughter stem cell and one daughter cell that will subsequently undergo meiosis and differentiate to generate the mature gamete. The silent sister hypothesis proposes that in asymmetric divisions, the selective inheritance of sister chromatids carrying specific epigenetic marks between stem and daughter cells impacts cell fate. To facilitate this selective inheritance, the hypothesis specifically proposes that the centromeric region of each sister chromatid is distinct. In Drosophila germ line stem cells (GSCs), it has recently been shown that the centromeric histone CENP-A (called CID in flies)-the epigenetic determinant of centromere identity-is asymmetrically distributed between sister chromatids. In these cells, CID deposition occurs in G2 phase such that sister chromatids destined to end up in the stem cell harbour more CENP-A, assemble more kinetochore proteins and capture more spindle microtubules. These results suggest a potential mechanism of 'mitotic drive' that might bias chromosome segregation. Here we report that the inner kinetochore protein CENP-C, is required for the assembly of CID in G2 phase in GSCs. Moreover, CENP-C is required to maintain a normal asymmetric distribution of CID between stem and daughter cells. In addition, we find that CID is lost from centromeres in aged GSCs and that a reduction in CENP-C accelerates this loss. Finally, we show that CENP-C depletion in GSCs disrupts the balance of stem and daughter cells in the ovary, shifting GSCs toward a self-renewal tendency. Ultimately, we provide evidence that centromere assembly and maintenance via CENP-C is required to sustain asymmetric divisions in female Drosophila GSCs.
Conflict of interest statement
The authors have declared that no competing interests exist.
Figures
Similar articles
-
Centromere function in asymmetric cell division in Drosophila female and male germline stem cells.Open Biol. 2021 Nov;11(11):210107. doi: 10.1098/rsob.210107. Epub 2021 Nov 3. Open Biol. 2021. PMID: 34727723 Free PMC article. Review.
-
Centromere proteins are asymmetrically distributed between newly divided germline stem and daughter cells and maintain a balanced niche in Drosophila males.Mol Biol Cell. 2023 May 1;34(5):ar42. doi: 10.1091/mbc.E22-10-0466. Epub 2023 Mar 15. Mol Biol Cell. 2023. PMID: 36920070 Free PMC article.
-
Centromere assembly and non-random sister chromatid segregation in stem cells.Essays Biochem. 2020 Sep 4;64(2):223-232. doi: 10.1042/EBC20190066. Essays Biochem. 2020. PMID: 32406510 Review.
-
Asymmetric Centromeres Differentially Coordinate with Mitotic Machinery to Ensure Biased Sister Chromatid Segregation in Germline Stem Cells.Cell Stem Cell. 2019 Nov 7;25(5):666-681.e5. doi: 10.1016/j.stem.2019.08.014. Epub 2019 Sep 26. Cell Stem Cell. 2019. PMID: 31564548 Free PMC article.
-
Asymmetric assembly of centromeres epigenetically regulates stem cell fate.J Cell Biol. 2020 Apr 6;219(4):e201910084. doi: 10.1083/jcb.201910084. J Cell Biol. 2020. PMID: 32328637 Free PMC article.
Cited by
-
A dynamic population of prophase CENP-C is required for meiotic chromosome segregation.PLoS Genet. 2023 Nov 29;19(11):e1011066. doi: 10.1371/journal.pgen.1011066. eCollection 2023 Nov. PLoS Genet. 2023. PMID: 38019881 Free PMC article.
-
Mitotic drive in asymmetric epigenetic inheritance.Biochem Soc Trans. 2022 Apr 29;50(2):675-688. doi: 10.1042/BST20200267. Biochem Soc Trans. 2022. PMID: 35437581 Free PMC article.
-
CENP-A: A Histone H3 Variant with Key Roles in Centromere Architecture in Healthy and Diseased States.Results Probl Cell Differ. 2022;70:221-261. doi: 10.1007/978-3-031-06573-6_7. Results Probl Cell Differ. 2022. PMID: 36348109
-
Centromere function in asymmetric cell division in Drosophila female and male germline stem cells.Open Biol. 2021 Nov;11(11):210107. doi: 10.1098/rsob.210107. Epub 2021 Nov 3. Open Biol. 2021. PMID: 34727723 Free PMC article. Review.
-
Incorporation of CENP-A/CID into centromeres during early Drosophila embryogenesis does not require RNA polymerase II-mediated transcription.Chromosoma. 2022 Jun;131(1-2):1-17. doi: 10.1007/s00412-022-00767-2. Epub 2022 Jan 11. Chromosoma. 2022. PMID: 35015118 Free PMC article.
References
Publication types
MeSH terms
Substances
Grants and funding
LinkOut - more resources
Full Text Sources
Other Literature Sources
Medical
Molecular Biology Databases
