

COVID-19 and excess mortality in the United States: A county-level analysis
- PMID: 34014945
- PMCID: PMC8136644
- DOI: 10.1371/journal.pmed.1003571
COVID-19 and excess mortality in the United States: A county-level analysis
Abstract
Background: Coronavirus Disease 2019 (COVID-19) excess deaths refer to increases in mortality over what would normally have been expected in the absence of the COVID-19 pandemic. Several prior studies have calculated excess deaths in the United States but were limited to the national or state level, precluding an examination of area-level variation in excess mortality and excess deaths not assigned to COVID-19. In this study, we take advantage of county-level variation in COVID-19 mortality to estimate excess deaths associated with the pandemic and examine how the extent of excess mortality not assigned to COVID-19 varies across subsets of counties defined by sociodemographic and health characteristics.
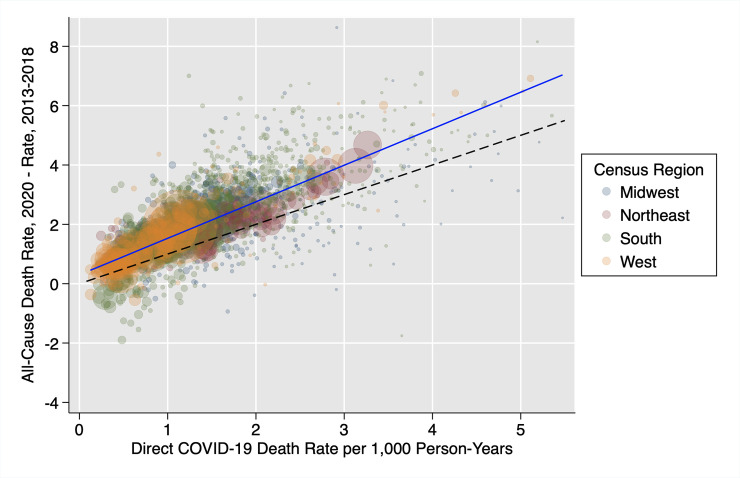
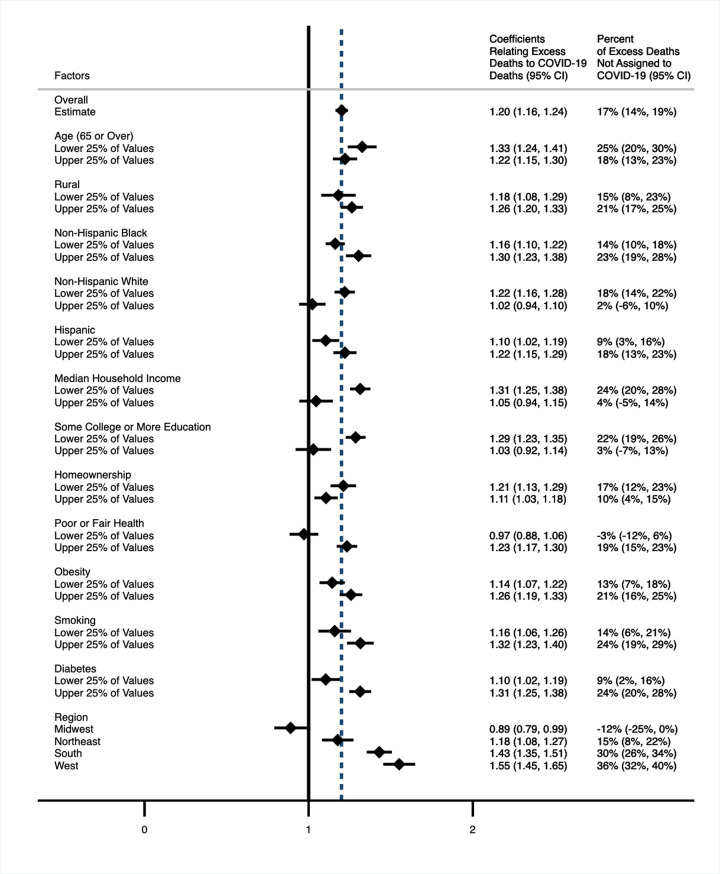
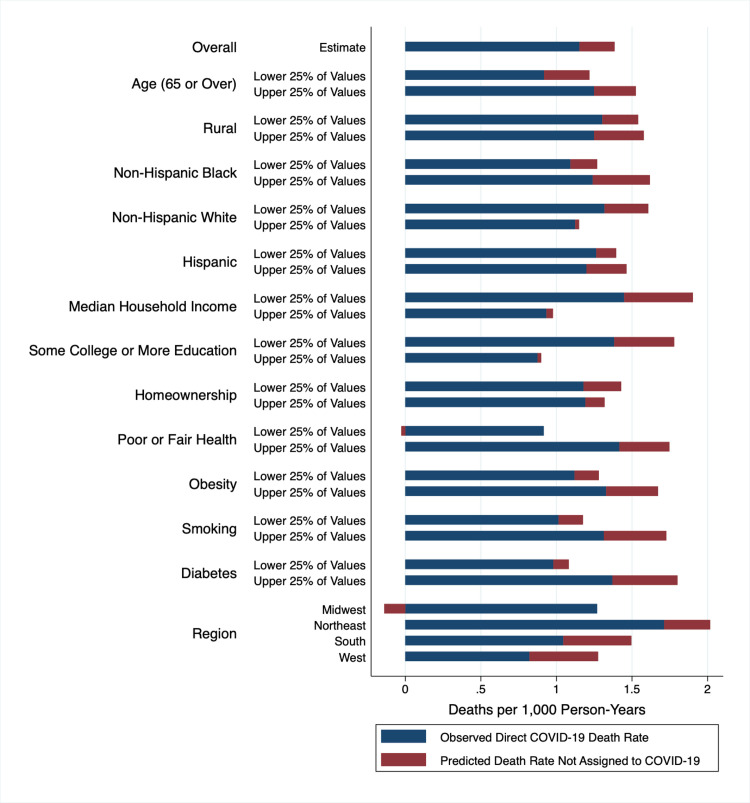
Methods and findings: In this ecological, cross-sectional study, we made use of provisional National Center for Health Statistics (NCHS) data on direct COVID-19 and all-cause mortality occurring in US counties from January 1 to December 31, 2020 and reported before March 12, 2021. We used data with a 10-week time lag between the final day that deaths occurred and the last day that deaths could be reported to improve the completeness of data. Our sample included 2,096 counties with 20 or more COVID-19 deaths. The total number of residents living in these counties was 319.1 million. On average, the counties were 18.7% Hispanic, 12.7% non-Hispanic Black, and 59.6% non-Hispanic White. A total of 15.9% of the population was older than 65 years. We first modeled the relationship between 2020 all-cause mortality and COVID-19 mortality across all counties and then produced fully stratified models to explore differences in this relationship among strata of sociodemographic and health factors. Overall, we found that for every 100 deaths assigned to COVID-19, 120 all-cause deaths occurred (95% CI, 116 to 124), implying that 17% (95% CI, 14% to 19%) of excess deaths were ascribed to causes of death other than COVID-19 itself. Our stratified models revealed that the percentage of excess deaths not assigned to COVID-19 was substantially higher among counties with lower median household incomes and less formal education, counties with poorer health and more diabetes, and counties in the South and West. Counties with more non-Hispanic Black residents, who were already at high risk of COVID-19 death based on direct counts, also reported higher percentages of excess deaths not assigned to COVID-19. Study limitations include the use of provisional data that may be incomplete and the lack of disaggregated data on county-level mortality by age, sex, race/ethnicity, and sociodemographic and health characteristics.
Conclusions: In this study, we found that direct COVID-19 death counts in the US in 2020 substantially underestimated total excess mortality attributable to COVID-19. Racial and socioeconomic inequities in COVID-19 mortality also increased when excess deaths not assigned to COVID-19 were considered. Our results highlight the importance of considering health equity in the policy response to the pandemic.
Conflict of interest statement
I have read the journal’s policy and the authors of this manuscript have the following competing interests: ACS reported receiving grants from Ethicon Inc. and Swiss Re outside the submitted work. No other disclosures were reported.
Figures
Update of
-
Assessing the Impact of the Covid-19 Pandemic on US Mortality: A County-Level Analysis.medRxiv [Preprint]. 2021 Mar 22:2020.08.31.20184036. doi: 10.1101/2020.08.31.20184036. medRxiv. 2021. Update in: PLoS Med. 2021 May 20;18(5):e1003571. doi: 10.1371/journal.pmed.1003571. PMID: 32908999 Free PMC article. Updated. Preprint.
References
-
- Banerjee A, Pasea L, Harris S, Gonzalez-Izquierdo A, Torralbo A, Shallcross L, et al. Estimating excess 1-year mortality associated with the COVID-19 pandemic according to underlying conditions and age: a population-based cohort study. Lancet. 2020;395:1715–25. 10.1016/S0140-6736(20)30854-0 - DOI - PMC - PubMed
Publication types
MeSH terms
Grants and funding
LinkOut - more resources
Full Text Sources
Other Literature Sources
Medical
