. 2021 May 20;16(5):e0251242.
doi: 10.1371/journal.pone.0251242. eCollection 2021.

An examination of school reopening strategies during the SARS-CoV-2 pandemic

Affiliations

An examination of school reopening strategies during the SARS-CoV-2 pandemic

Alfonso Landeros et al. PLoS One. .

Abstract

The SARS-CoV-2 pandemic led to closure of nearly all K-12 schools in the United States of America in March 2020. Although reopening K-12 schools for in-person schooling is desirable for many reasons, officials understand that risk reduction strategies and detection of cases are imperative in creating a safe return to school. Furthermore, consequences of reclosing recently opened schools are substantial and impact teachers, parents, and ultimately educational experiences in children. To address competing interests in meeting educational needs with public safety, we compare the impact of physical separation through school cohorts on SARS-CoV-2 infections against policies acting at the level of individual contacts within classrooms. Using an age-stratified Susceptible-Exposed-Infected-Removed model, we explore influences of reduced class density, transmission mitigation, and viral detection on cumulative prevalence. We consider several scenarios over a 6-month period including (1) multiple rotating cohorts in which students cycle through in-person instruction on a weekly basis, (2) parallel cohorts with in-person and remote learning tracks, (3) the impact of a hypothetical testing program with ideal and imperfect detection, and (4) varying levels of aggregate transmission reduction. Our mathematical model predicts that reducing the number of contacts through cohorts produces a larger effect than diminishing transmission rates per contact. Specifically, the latter approach requires dramatic reduction in transmission rates in order to achieve a comparable effect in minimizing infections over time. Further, our model indicates that surveillance programs using less sensitive tests may be adequate in monitoring infections within a school community by both keeping infections low and allowing for a longer period of instruction. Lastly, we underscore the importance of factoring infection prevalence in deciding when a local outbreak of infection is serious enough to require reverting to remote learning.


Conflict of interest statement

The authors have declared that no competing interests exist.

Figures

Fig 1
Fig 1. Overview of SEIR compartmental model.
The main compartments are denoted by S(t), E(t), I(t), and R(t) for susceptible, exposed, infected, and removed, respectively. Compartments are stratified by age class (1—children, 2—adults) and membership to cohort k. The coefficients αkℓ ∈ [0, 1] account for the strength of interaction between cohorts k and .
Fig 2
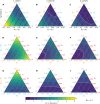
Fig 2. Predicted R0 under various transmission-cohort scenarios.
The color gradient changes from purple to blue to reflect R0 shifting from < 1 to > 1 in each ternary plot, with the white line denoting the boundary. Yellow is used to represent R0 > 6. (A-C) Assuming child-adult and adult-child transmission rates are identical (black axis), movement along the blue axis indicates that child-child transmission has a weak effect on R0 at a fixed scale for β0. (D-F) Fixing child-child transmission to be weak (β11 = 0.1) relative to other interactions, both child-adult and adult-adult transmission play dominant roles in increasing R0. (G-I) Fixing adult-adult transmission to be weak (β22 = 0.1), only child-adult transmission plays a dominant role in increasing R0.
Fig 3
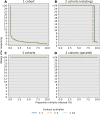
Fig 3. Number of weeks to reach a 5% stopping threshold in a community.
Each scenario assumes a 100% sensitive test. The stopping time tthreshold (y-axis) is simulated under varying prevalence conditions at reopening (x-axis). The contact multiplier for child-child transmission is also varied from (A) c = 1 to (B) c = 2 and (C) c = 10 and has little influence on stopping times. Multiple cohorts are effective at prolonging school operations while staying below a 5% prevalence threshold over a 14-day window. Note that only detected cases in children contribute to the decision rule.
Fig 4
Fig 4. Comparison of infections and susceptibles under different test sensitivities in both children and adults.
Simulations are based on parameter values f11 = 0.1, f12 = 0.25, f21 = 0.15, and f22 = 0.5 with bulk transmission rate β0 = 1.2. Reopening takes place at a 2% prevalence level (2000 infections per 100,000). The decision criterion over a 14-day sliding window is highlighted in a dotted line. Blue, orange, and green lines correspond to scenarios without intervention, with a 100% sensitive test, and a 50% sensitive test, respectively. (A) The 14-day prevalence criteria hits the 5% threshold after just over 2 weeks in the two testing scenarios. (B) Prevalence in adults peaks after about 4 weeks independent of test sensitivity in children. (C) Testing is effective in keeping most children safe from infection regardless of test sensitivity. (D) Testing in children has little impact on keeping adults free from infection under these conditions.
Fig 5
Fig 5. Comparison of cumulative under the parallel cohort approach.
(A-C) The 14-day prevalence criteria increases over the first 4 weeks, but point prevalence consistently trends downward due to cohort structure. Over 90% of children are kept safe from infection under the conditions of this simulation. (D-F) The combination of testing in children and cohort separation prevents a high level of infection in adults.
Fig 6
Fig 6. Cumulative prevalence trajectories under risk reduction strategies for children while at school.
For child-child transmission, we set β11 = 0.1 × (1 − r) outside of school and β11 = (1 #x2212; r) × c × 0.1 during school, where r is a reduction factor due to effective risk reduction strategies and c = 10 accounts for increased contact between children. (A–B) Mitigation that reduces transmission between children can lead to a substantial reduction in infections for both children and adults, provided the mitigation effects are large. (C–D) The impact of risk reduction strategies persists when children are separated into 2 rotating cohorts but does not demand as strict an adherence to be effective. An 80% reduction in pediatric transmission has a weaker effect compared to separating children into 2 rotating cohorts as the latter strategy result in fewer than 5% pediatric infection over 26 weeks (6 months).

Update of

References

    1. Auger KA, Shah SS, Richardson T, et al.. Association between statewide school closure and COVID-19 incidence and mortality in the US. JAMA. 2020. July;7. 10.1001/jama.2020.14348 - DOI - PMC - PubMed
    1. Kuhfeld M, Tarasawa B. The COVID-19 slide: What summer learning loss can tell us about the potential impact of school closures on student academic achievement. NWEA. 2020.
    1. Kuhfeld M, Soland J, Tarasawa B, Johnson A, Ruzek E, Liu J. Projecting the Potential Impact of COVID-19 School Closures on Academic Achievement. Educational Researcher. 2020. November 1;49(8):549–65. 10.3102/0013189X20965918 - DOI
    1. Sheikh A, Sheikh A, Sheikh Z, Dhami S. Reopening schools after the COVID-19 lockdown. Journal of Global Health. 2020. June;10(1):010376. 10.7189/jogh.10.010376 - DOI - PMC - PubMed
    1. Office of Governor Gavin Newsom. Governor Gavin Newsom Lays Out Pandemic Plan for Learning and Safe Schools. California Governor. Published July 17, 2020. Accessed July 21, 2020. https://www.gov.ca.gov/2020/07/17/governor-gavin-newsom-lays-out-pandemi...

Publication types