. 2021 May 20;17(5):e1009572.
doi: 10.1371/journal.ppat.1009572. eCollection 2021 May.

Immunity onset alters plant chromatin and utilizes EDA16 to regulate oxidative homeostasis

Affiliations

Immunity onset alters plant chromatin and utilizes EDA16 to regulate oxidative homeostasis

Alonso J Pardal et al. PLoS Pathog. .

Abstract

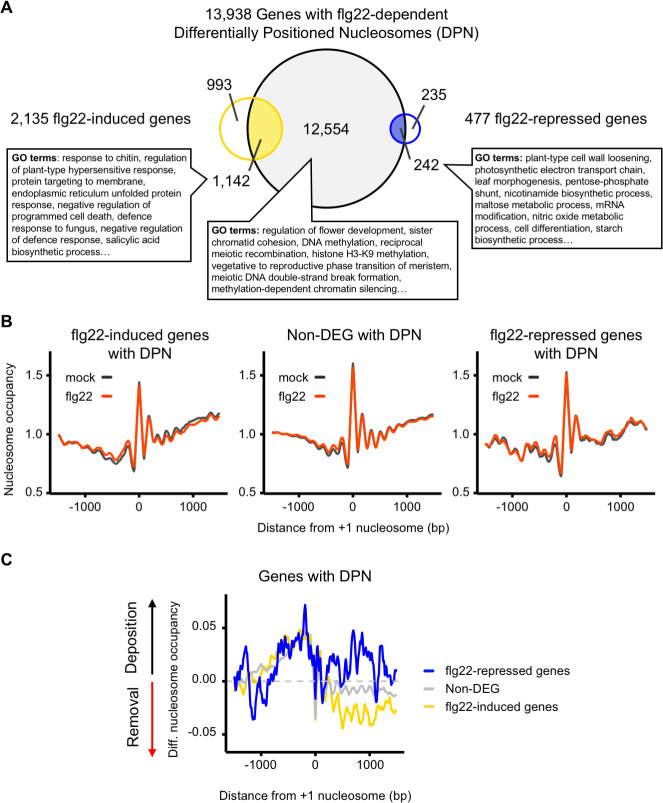
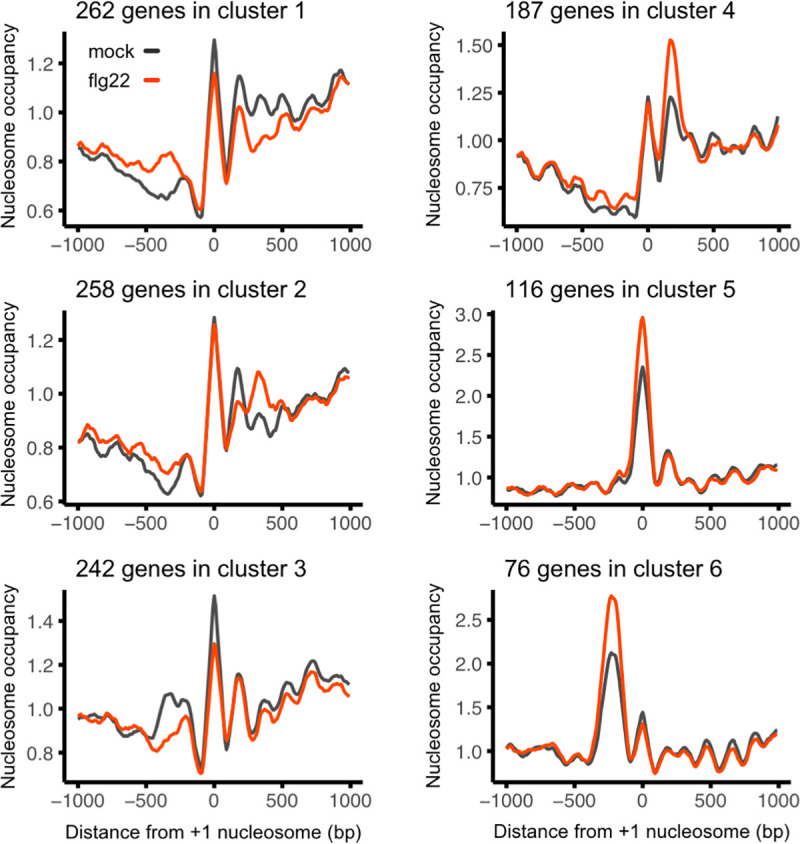
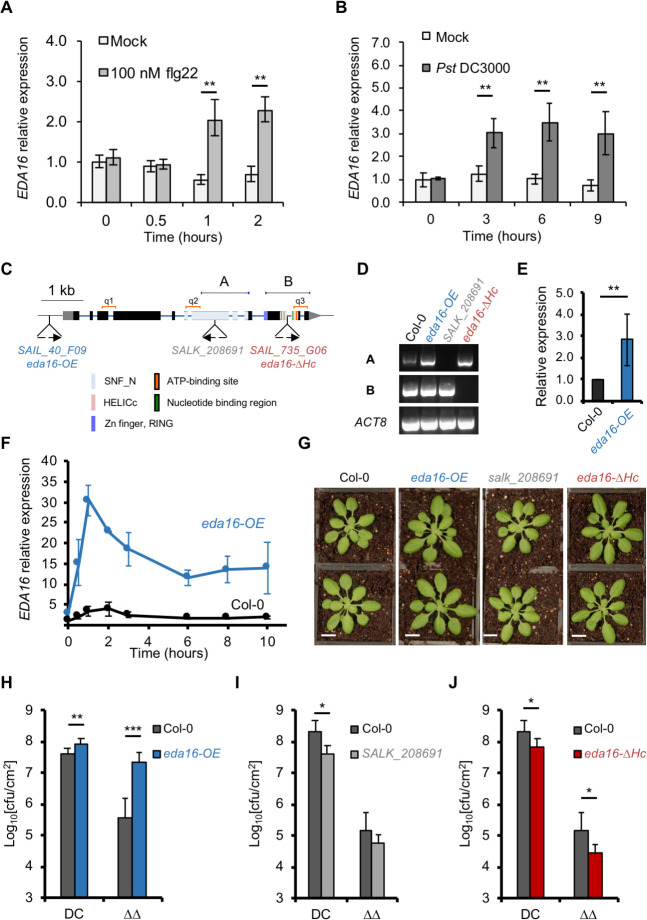
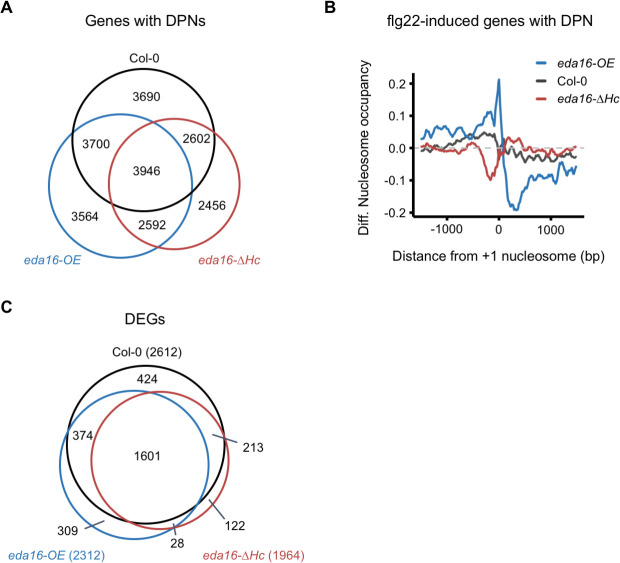
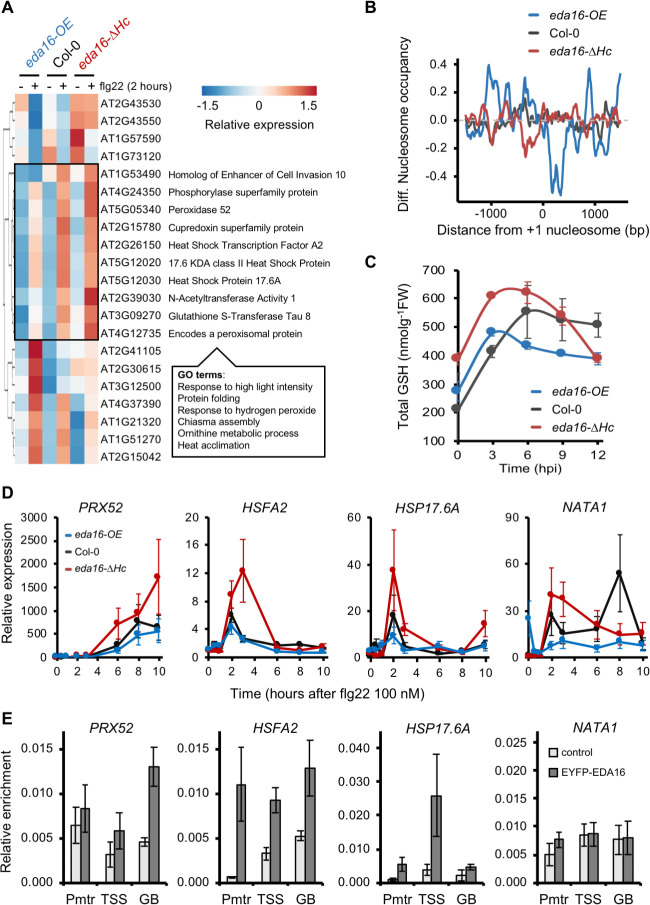
Perception of microbes by plants leads to dynamic reprogramming of the transcriptome, which is essential for plant health. The appropriate amplitude of this transcriptional response can be regulated at multiple levels, including chromatin. However, the mechanisms underlying the interplay between chromatin remodeling and transcription dynamics upon activation of plant immunity remain poorly understood. Here, we present evidence that activation of plant immunity by bacteria leads to nucleosome repositioning, which correlates with altered transcription. Nucleosome remodeling follows distinct patterns of nucleosome repositioning at different loci. Using a reverse genetic screen, we identify multiple chromatin remodeling ATPases with previously undescribed roles in immunity, including EMBRYO SAC DEVELOPMENT ARREST 16, EDA16. Functional characterization of the immune-inducible chromatin remodeling ATPase EDA16 revealed a mechanism to negatively regulate immunity activation and limit changes in redox homeostasis. Our transcriptomic data combined with MNase-seq data for EDA16 functional knock-out and over-expressor mutants show that EDA16 selectively regulates a defined subset of genes involved in redox signaling through nucleosome repositioning. Thus, collectively, chromatin remodeling ATPases fine-tune immune responses and provide a previously uncharacterized mechanism of immune regulation.


Conflict of interest statement

The authors have declared that no competing interests exist.

Figures

Fig 1
Fig 1. Activation of MTI results in nucleosome repositioning that correlates with gene expression.
(A) flg22 elicitation results in Differentially Positioned Nucleosomes (DPN). 2-week-old Col-0 seedlings were treated for 2 hours with 100 nM flg22 before harvesting for RNA-seq and MNase-seq analysis. Venn diagram illustrating the overlap between genes (protein-coding genes plus 1000 nucleotides upstream their Transcription Start Sites, TSS) with at least one DPN (grey), flg22-induced genes (yellow), and flg22-respressed genes (blue). Most significant GO terms found for the intersection groups with the TopGO package using as a control set all Arabidopsis protein coding genes (Fisher Exact Test, p-value < 0.01). (B) Changes in nucleosome occupancy in the promoters and the gene bodies following flg22 elicitation. Average nucleosome occupancy detected with MNase-seq analysis, mock (black) and flg22 (red) for flg22-induced genes with DPNs (left panel), Non-Differentially Expressed Genes (Non-DEGs) with DPNs (middle panel) and flg22-repressed genes (right panel). Graphs are centred on the +1 nucleosome from the gene TSS. (C) Differential nucleosome occupancy following flg22 elicitation. Average of the nucleosome occupancy differences between flg22- and mock treatment of flg22-induced (yellow), Non-DEGs (grey), and flg22-repressed genes (blue) for genes with DPN. The graph is centred on the +1 nucleosome from the gene TSS.
Fig 2
Fig 2. flg22-induced changes in nucleosome remodeling follow distinct patterns of nucleosome repositioning.
K-means clustering of differential nucleosome occupancy. 1,142 flg22-induced genes with Differentially Positioned Nucleosomes (DPNs) were clustered in 6 groups with marked differences in average nucleosome occupancy between flg22 elicitation (red) and mock treatment (black). The graph is centred on the +1 nucleosome from the gene TSS.
Fig 3
Fig 3. EDA16 is a negative regulator of plant immunity.
(A) EDA16 expression is induced by flg22 elicitation. Accumulation of EDA16 transcript was assessed by qPCR in 2-week-old Col-0 seedlings elicited with 100 nM flg22 or water (mock). Values are average of three biological repeats ± SE presented as fold induction compared with mock-treated sample at time 0. (B) Bacterial infection induces EDA16 expression. 5-week-old Col-0 plants were infiltrated with Pst DC3000 or 10 mM MgCl2 (mock). EDA16 expression was assessed by qPCR. Values are average of three biological repeats ± SE presented as fold induction compared with mock-treated sample at time 0. Labelled values are statistically different as established by two-sided T-test p-values: ** < 0.01. (C) Schematic representation of the T-DNA insertions in EDA16 gene. Boxes and solid lines denote exons and introns, respectively. T-DNA insertions and mutant names are indicated below the gene structure. The different functional domains of EDA16 are color-coded. Primers used for RT-PCR presented in panel D and corresponding PCR products are indicated above the gene structure (a, b). qPCR primers used in panels E and F are indicated above the gene structure (q1, q2, q3). (D) Mutant characterization by cDNA integrity. RT-PCR analysis of EDA16 gene expression in homozygous eda16 mutants and Col-0 plants. The amplified fragments (a and b) are indicated in C. ACT8 was used as a control. (E) SAIL_40_F09 mutant is an of EDA16 over-expresser. Accumulation of EDA16 transcript was assessed by qPCR in 2-week-old Col-0 and SAIL_40_F09 (eda16-OE) by averaging the results of 3 primer pairs (q1, q2 and q3), presented in panel C. Values are average of three biological repeats ± standard deviation presented as fold induction compared with Col-0 at time 0. (F) The SAIL_40_F09 mutant is an inducible over-expresser of EDA16. Accumulation of EDA16 transcript was assessed by qPCR in 2-week-old Col-0 and SAIL_40_F09 (eda16-OE) mutant plants as in panel E, after elicitation with 100 nM flg22 at the indicated times. Values are average of three biological repeats ± standard deviation presented as fold induction compared with Col-0 at time 0. (G) Representative pictures of 5-week-old eda16 mutants and Col-0 plants (bar = 1 cm). (H, I and J) The eda16 knock-out and over-expresser mutants have opposite immunity phenotypes. 5-week-old Col-0 (black), eda16-OE (blue), salk_208691 (grey) and eda16-ΔHc (red) plants were spray-inoculated with Pst DC3000 (DC) and Pst DC3000 ΔavrPtoΔavrPtoB (ΔΔ) as indicated. Bacterial numbers were determined 3 days post-infection. Error bars represent standard deviation (n = 6). The experiment was repeated 3 times with identical results. Labelled values are statistically different as established by two-sided T-test p-values: * < 0.05, ** < 0.01, *** < 0.001. Cfu stands for colony-forming units.
Fig 4
Fig 4. EDA16 alters nucleosome positioning and expression of flg22-regulated genes.
(A) The EDA16 mutation alters flg22-induced nucleosome positioning. Venn diagram illustrating the overlap between genes (protein-coding genes plus 1000 nucleotides upstream their Transcription Start Sites, TSS) with at least one Differentially Positioned Nucleosome (DPN) in Col-0 (black), eda16-OE (blue) and eda16-ΔHc (red) 2 hours after elicitation with 100 nM flg22. (B) flg22-induced genes have distinct nucleosome occupancies in the eda16-OE and eda16-ΔHc mutants. Average of the nucleosome occupancy differences between flg22-treated and mock-treated Col-0 (black), eda16-OE (blue), and eda16-ΔHc (red) for flg22-induced genes. The graph is centred on the +1 nucleosome from the gene TSS. (C) The effect of EDA16 mutation on the flg22 response at the transcriptomic level. Venn diagram illustrating the overlap between flg22-regulated, Differentially Expressed Genes (DEGs) in Col-0 (black), eda16-OE (blue) and eda16-ΔHc (red) 2h after elicitation with 100 nM flg22.
Fig 5
Fig 5. EDA16 regulates plant redox homeostasis during immune responses.
(A) EDA16 affects the expression of a subset of flg22-regulated genes. Heatmap of Differentially Expressed Genes between Col-0, eda16-OE and eda16-ΔHc plants 2h after elicitation with 100 nM flg22. The box on the heatmap indicates genes with a distinct pattern of misregulation in the eda16-OE and eda16-ΔHc mutant plants and accompanied with their (TAIR10) gene description. Most significant GO terms found for the intersection group. (B) Differential nucleosome occupancy of the 21 EDA16-flg22 DEGs. Differences between the average nucleosome occupancy of EDA16-regulated flg22-induced genes in Col-0 (grey), eda16-OE (blue), and eda16-ΔHc (red) 2 hours after elicitation with 100 nM flg22 and mock. The graph is centered on the +1 nucleosome from the gene TSS. (C) The EDA16 mutation alters glutathione concentration. Total glutathione (GSH) levels as concentration per fresh weight were measured in 3-week-old Col-0 (black), eda16-OE (blue) and eda16-ΔHc (red) plants at the indicated times following infection with Pst DC3000. Error bars represent standard deviation, n = 3. (D) EDA16 negatively regulate the expression of target genes. Gene expression of PRX52, HSFA, HSP17.6A and NATA1 assessed by qPCR in 2-week-old Col-0 (black) eda16-OE (blue) and eda16-ΔHc (red) seedlings elicited with 100 nM flg22. Values are average of three biological repeats ± SE presented as fold induction compared with Col-0 mock-treated sample at time 0. (E) EDA16 directly binds on target genes. ChIP-qPCR was performed on leaves from Col-0 and Col-0 35S::EDA16-YFP 5-week-old plants (n = 20) to assess EDA16 binding to PRX52, HSFA, HSP17.6A and NATA1. Three primer pairs were used for each gene corresponding to promoter region (Pmtr), TSS and gene body (GB). Values are average of three biological repeats ± SEM presented as relative enrichment compare to input.

References

    1. Agler MT, Ruhe J, Kroll S, Morhenn C, Kim ST, Weigel D, et al.. Microbial Hub Taxa Link Host and Abiotic Factors to Plant Microbiome Variation. PLoS Biol. 2016;14: e1002352. 10.1371/journal.pbio.1002352 - DOI - PMC - PubMed
    1. Jones JDG, Dangl JL. The plant immune system. Nature. 2006;444: 323–329. 10.1038/nature05286 - DOI - PubMed
    1. Zipfel C, Robatzek S, Navarro L, Oakeley EJ, Jones JDG, Felix G, et al.. Bacterial disease resistance in Arabidopsis through flagellin perception. Nature. 2004;428: 764–767. 10.1038/nature02485 - DOI - PubMed
    1. Lewis LA, Polanski K, de Torres-Zabala M, Jayaraman S, Bowden L, Moore J, et al.. Transcriptional Dynamics Driving MAMP-Triggered Immunity and Pathogen Effector-Mediated Immunosuppression in Arabidopsis Leaves Following Infection with Pseudomonas syringae pv tomato DC3000. Plant Cell. 2015;27: 3038–3064. 10.1105/tpc.15.00471 - DOI - PMC - PubMed
    1. Dangl JL, Horvath DM, Staskawicz BJ. Pivoting the plant immune system from dissection to deployment. Science. 2013;341: 746–751. 10.1126/science.1236011 - DOI - PMC - PubMed

Publication types

MeSH terms