. 2021 Aug 31;33(8):2883-2898.
doi: 10.1093/plcell/koab141.

ERAD-related E2 and E3 enzymes modulate the drought response by regulating the stability of PIP2 aquaporins

Affiliations

ERAD-related E2 and E3 enzymes modulate the drought response by regulating the stability of PIP2 aquaporins

Qian Chen et al. Plant Cell. .

Abstract

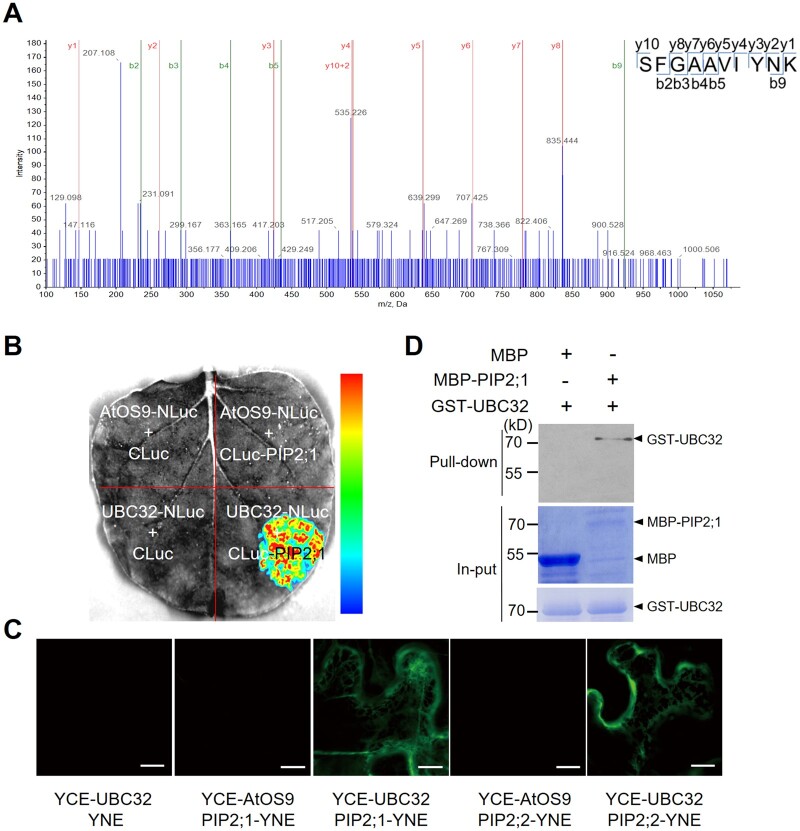
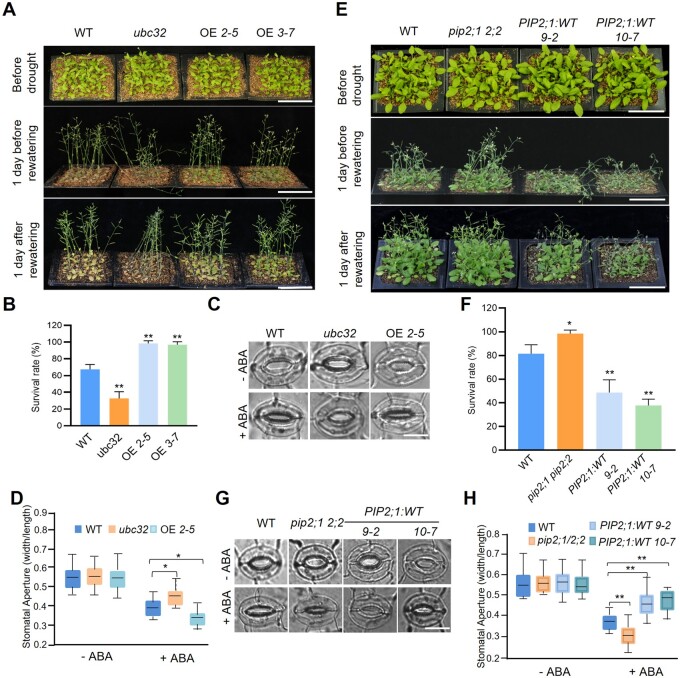
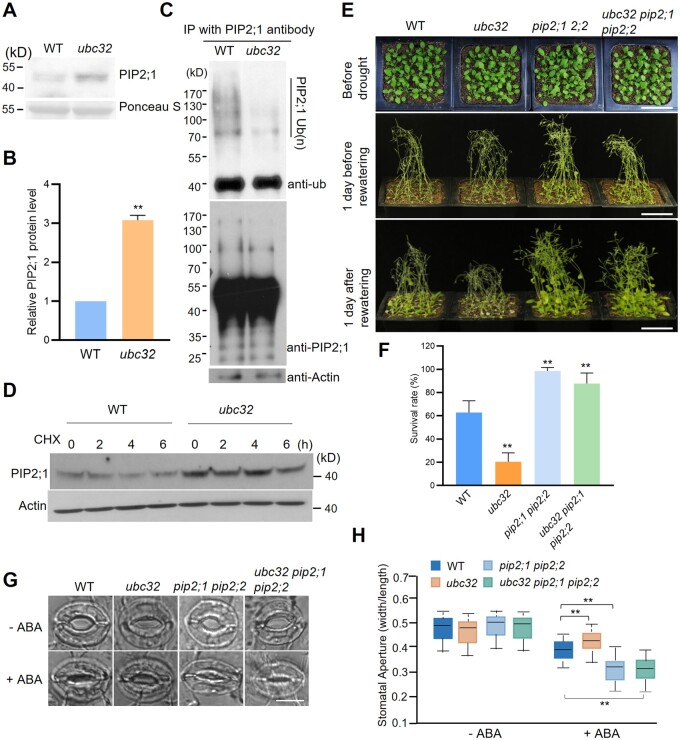
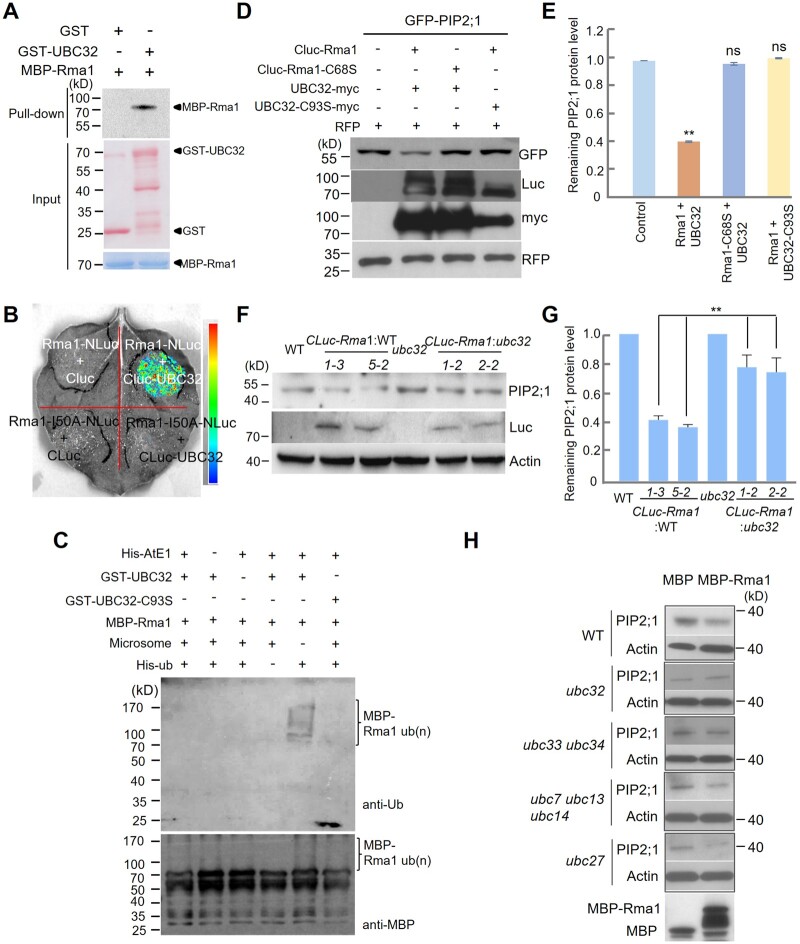
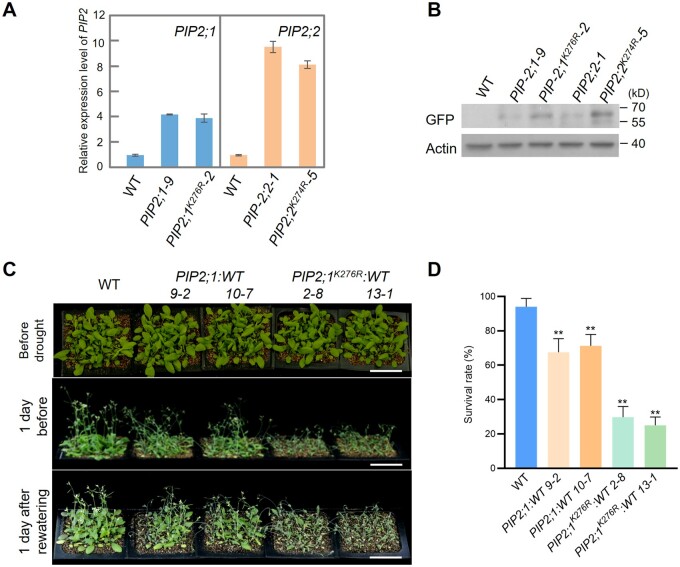
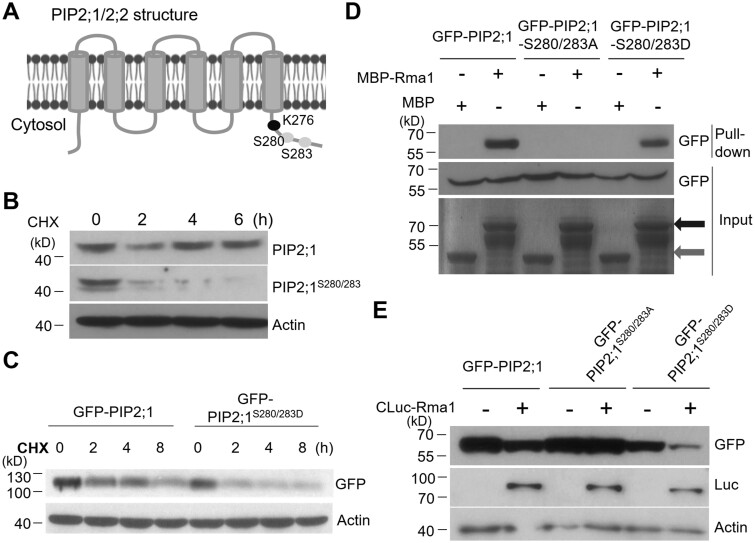
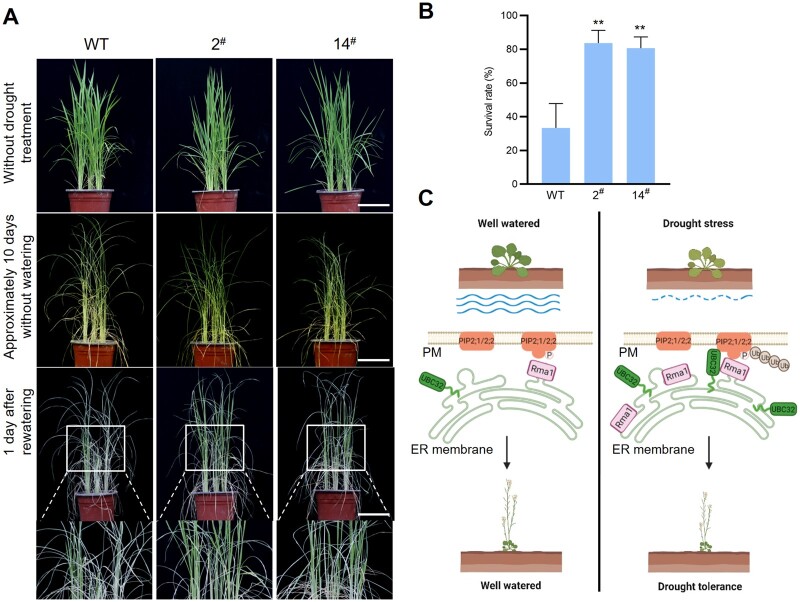
Endoplasmic reticulum-associated degradation (ERAD) is known to regulate plant responses to diverse stresses, yet its underlying molecular mechanisms and links to various stress signaling pathways are poorly understood. Here, we show that the ERAD component ubiquitin-conjugating enzyme UBC32 positively regulates drought tolerance in Arabidopsis thaliana by targeting the aquaporins PIP2;1 and PIP2;2 for degradation. Furthermore, we demonstrate that the RING-type ligase Rma1 acts together with UBC32 and that the E2 activity of UBC32 is essential for the ubiquitination of Rma1. This complex ubiquitinates a phosphorylated form of PIP2;1 at Lys276 to promote its degradation, thereby enhancing plant drought tolerance. Extending these molecular insights into crops, we show that overexpression of Arabidopsis UBC32 also improves drought tolerance in rice (Oryza sativa). Thus, beyond uncovering the molecular basis of an ERAD-regulated stress response, our study suggests multiple potential strategies for engineering crops with improved drought tolerance.


Figures

Figure 1
Figure 1
UBC32 directly interacts with PIP2;1 and PIP2;2. A, PIP2;1 and PIP2;2 were found to interact with UBC32 by mass spectrometry. Total proteins were extracted from UBC32–GFP overexpression plants and immunoprecipitated for mass spectrometry. The SFGAAVIYNK peptide of PIP2;1 and PIP2;2 was identified in the UBC32–GFP immunoprecipitated complex, as illustrated on the right. B, PIP2;1 binds to UBC32 in planta based on LCI experiments. An interaction was detected between UBC32-NLuc and PIP2;1-CLuc, but not in negative controls including AtOS9-NLuc and PIP2;1-CLuc. The pseudocolor bar on the right shows the range of luminescence intensity. C, PIP2;1 interacts with UBC32, as revealed by BiFC assay. The full-length coding sequence of UBC32 was cloned into pSPYCE (M) and the full-length coding sequences of PIP2s were inserted into pSPYNE (R) 173. AtOS9 was used as a negative control in this BiFC assay, bar = 10 μm. D, PIP2;1 interacts with UBC32 in a pull-down assay. E. coli-expressed MBP, MBP-PIP2;1, and GST-UBC32 were used in the pull-down assay. Equal amounts of MBP and MBP-PIP2;1 bound to amylose resin were incubated with 2 μg GST-UBC32. Pull-down products were detected using anti-GST antibody. The arrowheads on the right indicate the positions of full-length GST/MBP-tagged proteins.
Figure 2
Figure 2
UBC32 functions as a positive regulator while PIP2;1/PIP2;2 are negative regulators of ABA-related drought stress tolerance. A, Drought tolerance test of WT, ubc32 mutant, and 35S:UBC32 transgenic plants. Two-week-old seedlings were subjected to drought stress for ∼20 days and rewatered when significant differences in wilting were observed. Representative photographs obtained from three independent experiments are shown, bar = 5 cm. B, Statistical analysis of the seedling survival rate in (A). Values represent the mean ± sd (five biological replicates; n = 80). Statistical significance was analyzed by one-way ANOVA (**P <0.01). Detailed experiment replicates and statistical analysis are described in the “Method” section. C, Comparison of ABA-induced stomatal closure in WT, ubc32 mutant and 35S:UBC32 transgenic plants. Leaves from 4-week-old plants incubated in stomatal opening buffer were exposed to the light for 3 h. ABA (0 or 10 μM) was added to the samples and stomatal closure was observed after 3 h of treatment. Representative photographs are shown, bar = 10 µm. D, Quantitative analysis of stomatal aperture. The data were obtained from approximately bout 60 stomata. The box plots show the median (central line), the lower and upper quartiles (box) and the minimum and maximum values (whiskers). Significant differences between WT and ubc32 mutant or 35S:UBC32 transgenic plants were determined by one-way ANOVA (*P <0.05). E, Drought tolerance test of the pip2;1 pip2;2 mutant and two independent 35S:PIP2;1 transgenic plants lines. Two-week-old seedlings were subjected to drought stress for ∼20 days and rewatered when significant differences in wilting were observed. Representative photographs obtained from three independent experiments are shown, bar = 5 cm. F, Statistical analysis of the seedling survival rate in (E). Values represent the mean ± sd (five biological replicates; n = 80). Statistical significance was analyzed by one-way ANOVA (*P <0.05, **P <0.01). Detailed experiment replicates and statistical analysis are described in the “Method” section. G, Comparison of ABA-induced stomatal closure in the WT, pip2;1 pip2;2, and two independent 35S:PIP2;1 transgenic plants lines. ABA treatment was performed as in (C). More than 40 stomata were measured, and representative photographs are shown, bar = 10 μm. H, Quantitative analysis of stomatal aperture. The data were obtained from approximately 40 stomata. The box plots show the median (central line), the lower and upper quartiles (box) and the minimum and maximum values (whiskers). Significant differences between WT and pip2;1 pip2;2 or 35S:PIP2;1 transgenic plants were determined by one-way ANOVA (**P <0.01).
Figure 3
Figure 3
PIP2;1 and PIP2;2 are negatively regulated by UBC32 at the biochemical and genetic levels. A, The protein level of PIP2;1 in WT and ubc32 mutant. PIP2;1 protein level in 2-week-old WT and ubc32 seedlings was detected using anti-PIP2;1 antibody. Ponceau S represents the loading control. B, Quantification of PIP2;1 protein levels in WT and ubc32 in (A). Values represent the mean ± sd. Significantly different PIP2;1 protein levels in WT and ubc32 were determined by Student’s t test, **P < 0.01. C, In vivo ubiquitination level of PIP2;1 in WT and ubc32. Crude protein extracted from WT and ubc32 seedlings was immunoprecipitated by anti-PIP2;1 antibody and detected using anti-ubiquitin antibody and anti-PIP2;1 antibody. D, The in vivo degradation rate of PIP2;1 in WT and ubc32. WT and ubc32 seedlings were treated with 50-µΜ cycloheximide for the indicated time points. The PIP2;1 protein was checked using anti-PIP2;1 antibody. Actin represents the loading control. E, Drought tolerance test of WT, ubc32, pip2;1 pip2;2, and ubc32 pip2;1 pip2;2. The phenotype was analyzed in the same way as in Figure 2A. Representative photographs obtained from three independent experiments are shown, bar = 5 cm. F, Statistical analysis of the seedling survival rate in (E). Values represent the mean ± sd (five biological replicates; n = 80). Statistical significance was analyzed by one-way ANOVA (**P <0.01). Detailed experiment replicates and statistical analysis are described in the “Method” section. G, Comparison of ABA-induced stomatal closure in the WT, ubc32, pip2;1 pip2;2, and ubc32 pip2;1 pip2;2. Leaves from 4-week-old plants incubated in stomatal opening buffer were exposed to the light for 3 h. ABA (0 or 10 µM) was added to the samples and stomatal closure was observed after 3 h of treatment. More than 60 stomata were measured, and representative photographs are shown, bar = 10 µm. H, Statistics of the stomatal aperture in (G). The data were obtained from approximately 60 stomata. The box plots show the median (central line), the lower and upper quartiles (box) and the minimum and maximum values (whiskers). Significant differences between WT and ubc32, pip2;1 pip2;2 or ubc32 pip2;1 pip2;2 were determined by one-way ANOVA (**P <0.01).
Figure 4
Figure 4
UBC32 and Rma1 function as an E2–E3 pair to ubiquitinate and degrade PIP2;1/PIP2;2. A, Rma1 interacts with UBC32 based on a pull-down assay. GST, GST-UBC32, and MBP-Rma1 expressed in E. coli were used in this pull-down assay. Equal amounts of GST and GST-UBC32 bound to anti-GST resins were incubated with 2-μg MBP-Rma1. Pull-down products were detected using anti-MBP antibody. The arrowheads on the right indicate the positions of full-length GST/MBP-tagged proteins. B, Rma1 binds to UBC32 in planta based on an LCI experiment. CLuc-UBC32 interacts with Rma1-NLuc, but not the mutated RING domain form (Rma1-I50A-NLuc). The pseudocolor bar on the right shows the range of luminescence intensity. C, In vitro autoubiquitination assay of Rma1. MBP-Rma1, His-AtE1, Ub, and 200 ng microsome were combined with GST-32 or GST-UBC32-C93S, respectively. The reaction was carried at 30°C for 90 min, and immunoblot analysis was performed using anti-MBP and anti-ub antibodies. D, The E3 ligase activity of Rma1 and E2 activity of UBC32 are necessary for the degradation of PIP2;1. Single amino acid mutations Rma1-C68S and UBC32-C93S, which lost E3 ligase activity or E2 activity, respectively, were used in this assay. Agrobacterium containing the GFP-PIP2;1 plasmid was co-injected into N. benthamiana with Agrobacterium containing the corresponding plasmids as indicated. Total protein was extracted from N. benthamiana leaves at 3 days post infiltration and analyzed by immunoblot analysis. RFP was used as the co-expressed control in this assay. E, Quantification of GFP-PIP2;1 protein levels in (D). Values represent the mean ± sd (n = 3, n means biological replicate). Statistical significance was determined by one-way ANOVA (**P <0.01; ns, no significant difference). F, The regulation of PIP2;1 by UBC32 is Rma1-dependent. PIP2;1 protein level was detected in WT, CLuc-Rma1:WT transgenic plants, ubc32 and CLuc-Rma1:ubc32 transgenic plants using anti-PIP2;1 antibody. G, Quantification of PIP2;1 protein levels in (F). Values represent the mean ± sd. Statistical significance was determined by one-way ANOVA (**P <0.01). H, PIP2;1 stability is not affected by other E2s in the ERAD system. Crude extracts of WT and different E2 mutants were incubated with MBP and MBP-Rma1 at 22°C and PIP2;1 protein was checked using anti-PIP2;1 antibody.
Figure 5
Figure 5
Lys276 and Lys274 are the ubiquitination sites of PIP2;1 and PIP2;2, respectively. A, The RNA level of PIP2;1/2;2 determined by qPCR in WT, GFP-PIP2;1 transgenic plants (PIP2;1-9 and PIP2;1K276R-2) or GFP-PIP2;2 transgenic plants (PIP2;2-1 and PIP2;2K274R-5). ACTIN2 was used as an internal control. B, GFP-PIP2;1/2;2 protein level was determined in WT, GFP-PIP2;1 transgenic plants (PIP2;1-9 and PIP2;1K276R-2) or GFP-PIP2;2 transgenic plants (PIP2;2-1 and PIP2;2K274R-5) using anti-GFP antibody. Actin was used as an internal control. C, Drought tolerance test of PIP2;1 and PIP2;1K276R transgenic plants. Two independent lines were used for each gene. The phenotype was analyzed as in Figure 2a, bar = 5 cm. D, Statistical analysis of the seedling survival rate in (C). Values represent the mean ± sd (five biological replicates; n = 80). Statistical significance was analyzed by one-way ANOVA (**P <0.01). Detailed experiment replicates and statistical analysis are described in the “Method” section.
Figure 6
Figure 6
Phosphorylated PIP2;1 shows a faster degradation rate than the nonphosphorylated form. A, Schematic diagram of modification sites in the C-terminus of PIP2;1. Lys276, Ser280, and Ser283 are indicated. B, Phosphorylated PIP2;1 shows a faster turnover rate than the non-phosphorylated form. WT seedlings were treated with 50-µΜ cycloheximide (CHX) for 0, 2, 4, 6 h and total proteins were examined using anti-PIP2;1 antibody and anti-pS280/283 antibody, respectively. C, GFP-PIP2;1S280/283D degrades much more rapidly than GFP-PIP2;1. Total proteins were extracted from N. benthamiana expressing GFP-PIP2;1 and GFP-PIP2;1S280/283D and incubated at 22°C for different time points. GFP-PIP2;1 and GFP-PIP2;1S280/283D protein levels were measured using anti-GFP antibody. D, Rma1 interacts with PIP2;1 and PIP2;1S280/283D but not PIP2;1S280/283A. MBP and MBP-Rma1 were expressed and purified from E. coli, while GFP-PIP2;1, GFP-PIP2;1S280/283D, and PIP2;1S280/283A were expressed in N. benthamiana. MBP and MBP-Rma1 were bound to amylose resins, and the resins were incubated with equal amounts of PIP2;1 or PIP2;1 variant proteins. The dark gray arrow indicates input of MBP-Rma1, and the light gray arrow indicates input of MBP. MBP was used as a negative control. E, CLuc-Rma1 accelerates the turnover of GFP-PIP2;1 and GFP-PIP2;1S280/283D but not GFP-PIP2;1S280/283A. Different PIP2;1 variants were co-expressed with Rma1 in N. benthamiana and PIP2;1 protein levels were detected using anti-GFP antibody.
Figure 7
Figure 7
Arabidopsis UBC32 enhances drought tolerance in rice. A, Drought tolerance test of WT (Nipponbare) and Ub:UBC32 transgenic plants (2# and 14#). B, Statistical analysis of the seedling survival rate in (A). Values represent the mean ± sd (four biological replicates; n = 48). Statistical significance was analyzed by one-way ANOVA (**P <0.01). C, A proposed working model for the role of UBC32 and Rma1 in the plant response to drought stress. Under drought stress, the expression of UBC32 and Rma1 is induced. UBC32 cooperates with Rma1 to recognize phosphorylated PIP2;1 and PIP2;2 and target them for ubiquitin-dependent degradation to enhance drought tolerance in plants. PM, plasma membrane.

References

    1. Aharon R, Shahak Y, Wininger S, Bendov R, Kapulnik Y, Galili G (2003) Overexpression of a plasma membrane aquaporin in transgenic tobacco improves plant vigor under favorable growth conditions but not under drought or salt stress. Plant Cell 15: 439–447 - PMC - PubMed
    1. Ahn MY, Oh TR, Seo DH, Kim JH, Cho NH, Kim WT (2018) Arabidopsis group XIV ubiquitin-conjugating enzymes AtUBC32, AtUBC33, and AtUBC34 play negative roles in drought stress response. J Plant Physiol 230: 73–79 - PubMed
    1. Alexandersson E, Fraysse L, Sjovall-Larsen S, Gustavsson S, Fellert M, Karlsson M, Johanson U, Kjellbom P (2005) Whole gene family expression and drought stress regulation of aquaporins. Plant Mol Biol 59: 469–484 - PubMed
    1. Aung K, Lin SI, Wu CC, Huang YT, Su CL, Chiou TJ (2006) pho2, a phosphate overaccumulator, is caused by a nonsense mutation in a microRNA399 target gene. Plant Physiol 141: 1000–1011 - PMC - PubMed
    1. Cao Y, Dai Y, Cui S, Ma L (2008) Histone H2B monoubiquitination in the chromatin of FLOWERING LOCUS C regulates flowering time in Arabidopsis. Plant Cell 20: 2586–2602 - PMC - PubMed

Publication types

MeSH terms

LinkOut - more resources