. 2021 Jul 13;54(7):1527-1542.e8.
doi: 10.1016/j.immuni.2021.04.022. Epub 2021 May 19.

Treg cell-derived osteopontin promotes microglia-mediated white matter repair after ischemic stroke

Affiliations

Treg cell-derived osteopontin promotes microglia-mediated white matter repair after ischemic stroke

Ligen Shi et al. Immunity. .

Abstract

The precise mechanisms underlying the beneficial effects of regulatory T (Treg) cells on long-term tissue repair remain elusive. Here, using single-cell RNA sequencing and flow cytometry, we found that Treg cells infiltrated the brain 1 to 5 weeks after experimental stroke in mice. Selective depletion of Treg cells diminished oligodendrogenesis, white matter repair, and functional recovery after stroke. Transcriptomic analyses revealed potent immunomodulatory effects of brain-infiltrating Treg cells on other immune cells, including monocyte-lineage cells. Microglia depletion, but not T cell lymphopenia, mitigated the beneficial effects of transferred Treg cells on white matter regeneration. Mechanistically, Treg cell-derived osteopontin acted through integrin receptors on microglia to enhance microglial reparative activity, consequently promoting oligodendrogenesis and white matter repair. Increasing Treg cell numbers by delivering IL-2:IL-2 antibody complexes after stroke improved white matter integrity and rescued neurological functions over the long term. These findings reveal Treg cells as a neurorestorative target for stroke recovery.

Keywords: microglia; oligodendrocytes; osteopontin; regulatory T cells; stroke recovery; white matter.


Conflict of interest statement

Declaration of interests The authors declare no competing interests.

Figures

Figure 1.
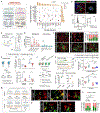
Figure 1.. Treg cells accumulate in the ischemic brain and play pivotal roles in neurological recovery.
(A) Experimental design for scRNAseq. n=2 biological replicates for each group. (B) t-SNE plot showing clusters and cluster annotations of brain cells obtained 14d after tMCAO. The numbers of cells are in parentheses. (C) Heatmap showing the top 20 markers for each cluster. (D) Stacked bar graph showing percentages of cells in each cluster among total numbers of cells 5d and 14d after tMCAO. (E) Subclustering of αβ T cell population 14d after tMCAO. The inset highlights the αβ T cells in color in the primary clustering in (B). (F) Flow cytometry analysis of CD3+CD4+CD25+Foxp3+ Treg cells in the ischemic brain (/106 total brain cells) 3d (n=10), 5d (n=7), 7d (n=7), 14d (n=9), and 35d (n=10) after stroke and in sham brains (n=5). Box plot, 2.5-97.5 percentile. **p<0.01, ***p<0.001, Kruskal-Wallis test and Dunn’s. (G) vi-SNE plot showing flow cytometry analysis of Treg cells in the ischemic brain 14d after tMCAO. Upper: Treg cells in blue and other CD4+ cells in grey. Lower: expression of CD25, Foxp3 and Helios in CD4+ cells. (H) Experimental design for Treg cell depletion. (I) Marked reduction of Treg cells in the ischemic brain 21d after tMCAO in DTR mice with DT. n=3. **p<0.01, student’s t test. (J-K) Treg cell depletion deteriorates long-term sensorimotor deficits after tMCAO as assessed by Rotarod (J) and adhesive removal (K) tests. n=7 for sham groups and n=6 for stroke groups. *p<0.05, **p<0.01, ***p<0.001, two-way repeated measures ANOVA & Bonferroni. Data are mean ± SD unless otherwise specified. (See also Figure S1, S2 and Table S1, S2)
Figure 2.
Figure 2.. Treg cells are essential for long-term white matter integrity after stroke.
(A) Immunostaining of GFP (green) and MBP (red) in Foxp3DTR (GFP+) mice 35d after stroke. (B) Experimental design for Treg cell depletion and WT Treg cell adoptive transfer. (C) The LFB staining 21d after tMCAO. n=5. **p<0.01, ***p<0.001, one-way ANOVA & Bonferroni. (D) Representative DTI axial views of FA map and one plane of directionally encoded color (DEC) map of the same brains collected 21d after tMCAO. Yellow arrow heads: EC. Blue arrow heads: internal capsule. (E-F) Quantification of FA (E) and RD (F) values as the ratio of ipsilateral (lesioned) values to the contralesional values. n=5. *p<0.05, **p<0.01, ***p<0.001, one-way ANOVA & Bonferroni. (G) Representative TEM images in the EC 21d after tMCAO. Red asterisks: demyelinating axons. Purple arrows: remyelinated axons. Scale bar: 2 μm. (H) The g-ratio of myelinated axons with respect to axon diameter was compared between DTR+PBS mice and DTR+DT mice. The numbers of axons from 3 mice are indicated. ***p<0.001, Student’s t test or Mann Whitney test. (I) Scatter plots of g-ratio as a function of axon diameters. (J) Electrophysiological analyses of brain slices prepared 21d after tMCAO or sham operation. Representative curves of CAP are shown. (K-L) Amplitudes of evoked CAPs in N1 (K) and N2 fibers (L). (M) The velocity of N1 fibers. n= 6 (K-M). *p<0.05, ***p<0.001 vs. sham, #p<0.05 DTR+DT vs. DTR+PBS. Two-way repeated ANOVA (K and L) or one-way ANOVA (M) & Bonferroni. Data are mean ± SD. (See also Figure S3)
Figure 3.
Figure 3.. Treg cells promote oligodendrogenesis contingent upon microglia.
(A) Representative images of BrdU (green) and APC (red) immunostaining in Foxp3DTR (DTR) mice with or without DT injection and WT Treg cell transfer. The dotted red lines trace the boundaries of the EC. (B) Quantification of the numbers of APC+BrdU+ cells, APC+ cells and BrdU+ cells in the peri-infarct areas. n=6. *p<0.05, **p<0.01, ***p<0.001, one-way ANOVA & Bonferroni or Kruskal-Wallis test & Dunn’s. (C) CD4+CD25+Foxp3(GFP)+ Treg cells were isolated from the blood and ischemic brain 14d after tMCAO and from blood of sham mice for RNAseq. (D) Scatter plot showing comparison of log2FPKM for extracellular and cell-released factors in brain Treg cells vs. sham blood Treg cells. Red dots highlight some DEGs that are known to promote oligodendrogenesis and are upregulated in brain Treg cells by more than 4-fold. The orange dashed line indicates a fold change of 1. (E) Protein expression of OPN and IL-10 by brain-infiltrating Treg cells and blood Treg cells 14 days after stroke or after sham operation. n=6. **p<0.01, ***p<0.001, one-way ANOVA & Bonferroni. (F) IPA analysis of DEGs identified key biological processes in brain infiltrating Treg cells compare to sham blood Treg cells, which was graphically displayed in bubble plots according to Z scores and significance [−log10(adjusted P value)]. (G) Bar graphs indicating immunomodulatory effects of Treg cells in the ischemic brain. (H-I) Rag1−/− mice (H, n=7-8) or microglia and macrophage depleted mice (I, n=6-7. by dietary intake of PLX5622 7d before tMCAO) received Treg cells (2 × 10⁶) or PBS 6h after tMCAO. The number of APC+BrdU+ cells in ischemic areas were quantified. *p<0.05, ***p<0.001, student’s t test (H) or one-way ANOVA & Bonferroni (I). Data are mean ± SD. (See also Figure S4 and Table S3)
Figure 4.
Figure 4.. Treg cells promote tissue reparative microglial responses to ischemic brain injury.
(A) Experimental design for microglia morphology analysis. (B) 3D constructed images of Iba1+ microglia and macrophages in peri-infarct area. Cell surface area (left), cell volume (middle) and Iba1+ cell number (right) were quantified. N=217 cells from 4 mice for morphology analysis. ***p<0.001. Mann Whitney test or Student’s t test. (C) Design for brain slice-Treg cell-microglia coculture experiment for RNAseq in microglia. (D) Positively enriched gene sets identified by GSEA analysis. The normalized enrichment scores (NES), nominal (NOM) p value and FDR of each gene set are shown. (E) Volcano plot of Treg cell-stimulated microglia and unstimulated microglia showing 570 downregulated (green) and 603 upregulated (red) DEGs (∣log2FC∣>1, FDR<0.05). (F) Heatmap showing concurrent upregulation of brain repair-related genes and anti-inflammatory genes in Treg cell-stimulated microglia vs. control microglia. (G) The expression of oligodendrogenesis-related genes was increased in Treg cell-stimulated microglia vs. control microglia. *adjusted p<0.05. (H) Flow cytometry analysis of TGM2 (n=5), VEGFa (n=6), OPN (n=6), and ARG1 (n=6) expression in Treg cell-stimulated microglia vs. control microglia. Median fluorescence intensity (MFI) was quantified. *p<0.05, **p<0.01, ***p<0.001, Student’s t test or Welch’s t test. (I) Primary microglia in inserts were cultured with or without activated Treg cells in lower chamber for 2d, and then cocultured with OPCs for an additional 3d. MBP+ (green) and NG2+ cells (red) were quantified as percentages of total cells. Three to 4 independent experiments. *p<0.05, ***p<0.001 vs. control OPCs. ## p<0.01 vs. OPCs treated with unstimulated microglia. One-way ANOVA & Bonferroni. Data are mean ± SD. (See also Table S4)
Figure 5.
Figure 5.. Treg cell-microglia crosstalk via OPN is essential for Treg cell-afforded long-term protection of WM after stroke.
(A) STRING analysis predicts ligand-receptor pairs that mediate interactions between activated Treg cells and microglia. (B) OPN (red) in Foxp3-GFP+ (green) Treg cells in the ischemic brain 35d after tMCAO. (C) OPN expression by CD3+CD4+CD25+Foxp3+ Treg cells and CD3+CD4+CD25− T effector cells in the ischemic brains 14d after tMCAO. n=4. **p<0.01, Welch's t test. (D) Primary rat microglia were treated with 1 nM OPN (n=9), IL-1α (n=5) or IL-1β (n=6) or PBS (n=8) for 24h. Conditioned media (CM) were collected and applied to rat OPCs for 3d. To evaluate a direct effect, 1 nM OPN (n=4), IL-1α (n=4), IL-1β (n=3) or PBS vehicle control (n=10) were applied to OPCs for 3d. T3+CNTF (n=5) were used as a positive control. (E) Expression of mbp was assessed by RT-PCR. *p<0.05, one-way ANOVA & Dunnett’s. (F) Quantification of MBP+ cells (green) and NG2+ cells (red) as percentages of total cells. Five independent experiments. ***p<0.001 vs. control (a). ### p<0.001 vs. control Mi (microglia) CM (c). One-way ANOVA & Bonferroni. (G) Experimental design for WT or Spp1−/− Treg cell transfer to Treg cell depleted DTR mice. (H) Quantification of APC+BrdU+ cells 14d after tMCAO. n=6-7. *p<0.05, **p<0.01, Student’s t test. (I) Quantification of myelin coverage by LFB staining. n=5. *p<0.05, **p<0.01, Student’s t test. (J) Microglia-specific Itgb1 deficient mice (Cx3cr1CreER+/−Itgb1f/f) or control mice (Cx3cr1creER+/−) received WT Treg cells or PBS after tMCAO. (K) Flow cytometry confirmed deficiency of Itgb1 in brain microglia and blood macrophages 7d after 4-OH tamoxifen (TAM). n=3. *p<0.05, **p<0.01, Student’s t test (macrophage) and Mann Whitney test (microglia, box plot, 2.5-97.5 percentile). (L) Quantification of APC+BrdU+ cells. n=6. *p<0.05, ***p<0.001, ns: not significant, one-way ANOVA & Bonferroni. (M) Upper: Primary mouse microglia in inserts were cocultured with or without activated WT or Spp1−/− Treg cells in the lower chamber for 2d, and then cocultured with WT OPCs for 3d. Lower: Microglia in inserts were cocultured with activated WT Treg cells in the lower chamber in the presence of anti-Itgb1 Ab (20μg/ml) or isotype control Ab (20μg/ml) for 2d, and then cocultured with WT OPCs for 3d. (N-O) Immunostaining of MBP (green) and NG2 (red). (P) MBP+ cells and NG2+ cells were quantified as percentages of total cells. Five independent experiments. *p<0.05, ***p<0.001, one-way ANOVA & Bonferroni. Data are mean ± SD unless otherwise specified. (See also Figure S5)
Figure 6.
Figure 6.. Boosting Treg cells by post-treatment with IL-2:IL-2Ab complexes rescues long-term outcomes after tMCAO.
(A-B) Sensorimotor functions were accessed by the adhesive removal test (A) and the rotarod test (B). n=8-13. *p<0.05, **p<0.01, ***p<0.001 vs. sham, ###p<0.001 IgG vs. IL-2:IL-2Ab, two-way repeated measures ANOVA & Bonferroni. (C) Cognitive functions were evaluated in the Morris water maze. Representative images show the swim paths. n=8-12. *p<0.05, **p<0.01, ##p<0.01, two-way repeated measures ANOVA or one-way ANOVA & Bonferroni. (D) Representative DTI axial views of FA and DEC maps acquired 35d after stroke. Left two panels show the areas of quantification. (E-F) Quantification of FA (E) and RD (F) in the EC and IC at three levels. n=8. *p<0.05, **p<0.01, ***p<0.001, student’s t test, Welch's t test or Mann Whitney test. (G) The ratios of MBP to SMI32 staining intensity in ipsilesional EC, striatum and cortex 35d after tMCAO. Data are normalized to the staining intensity of the contralateral hemisphere. n=8. *p<0.05, student’s t test. (H) Representative TEM images. Red squares indicate the enlarged regions. Blue arrows: myelin sheath defects. Red asterisks: demyelinating axons. Red arrow heads: remyelinated axons. Scalebar: 2 μm (upper) and 1 μm (lower). (I) Quantification of the g-ratios of myelinated axons with respect to axon diameters. The numbers of axons from 4 mice are indicated. ***p<0.001, student’s t test or Mann Whitney test. (J) Scatter plot displaying the individual g-ratio values and axonal size distribution. Data are mean ± SD. (See also Figure S6)

Comment in

References

    1. Amir el AD, Davis KL, Tadmor MD, Simonds EF, Levine JH, Bendall SC, Shenfeld DK, Krishnaswamy S, Nolan GP, and Pe'er D (2013). viSNE enables visualization of high dimensional single-cell data and reveals phenotypic heterogeneity of leukemia. Nat Biotechnol 31, 545–552. - PMC - PubMed
    1. An C, Shi Y, Li P, Hu X, Gan Y, Stetler RA, Leak RK, Gao Y, Sun BL, Zheng P, and Chen J (2014). Molecular dialogs between the ischemic brain and the peripheral immune system: dualistic roles in injury and repair. Prog Neurobiol 115, 6–24. - PMC - PubMed
    1. Anders S, Pyl PT, and Huber W (2015). HTSeq--a Python framework to work with high-throughput sequencing data. Bioinformatics 31, 166–169. - PMC - PubMed
    1. Beers DR, Henkel JS, Zhao W, Wang J, Huang A, Wen S, Liao B, and Appel SH (2011). Endogenous regulatory T lymphocytes ameliorate amyotrophic lateral sclerosis in mice and correlate with disease progression in patients with amyotrophic lateral sclerosis. Brain 134, 1293–1314. - PMC - PubMed
    1. Benakis C, Brea D, Caballero S, Faraco G, Moore J, Murphy M, Sita G, Racchumi G, Ling L, Pamer EG, et al. (2016). Commensal microbiota affects ischemic stroke outcome by regulating intestinal gammadelta T cells. Nat Med 22, 516–523. - PMC - PubMed

Publication types