. 2021 May 21;21(1):581.
doi: 10.1186/s12885-021-08328-z.

The tumor immune microenvironment and immune-related signature predict the chemotherapy response in patients with osteosarcoma

Affiliations

The tumor immune microenvironment and immune-related signature predict the chemotherapy response in patients with osteosarcoma

Lijiang He et al. BMC Cancer. .

Abstract

Background: Genome-wide expression profiles have been shown to predict the response to chemotherapy. The purpose of this study was to develop a novel predictive signature for chemotherapy in patients with osteosarcoma.

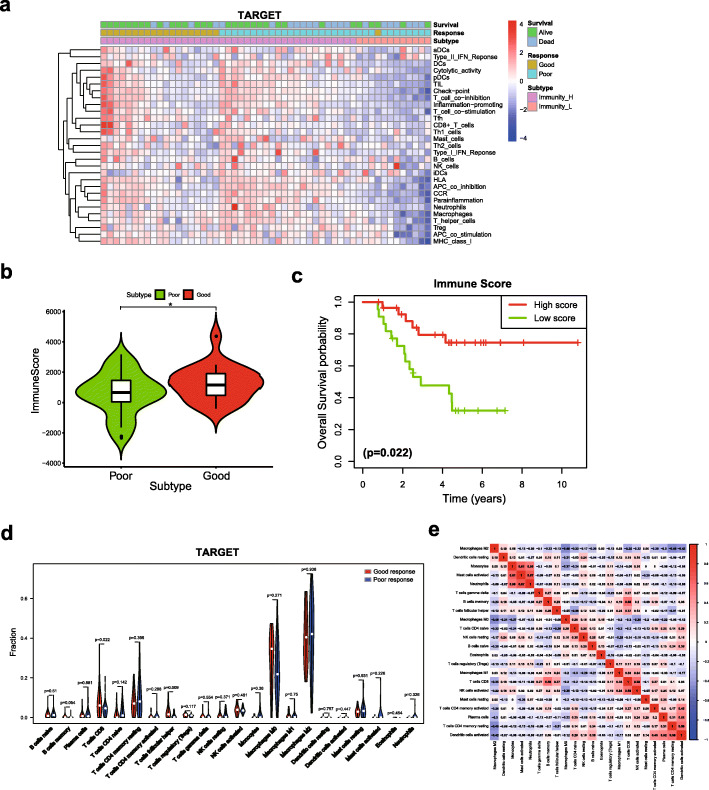
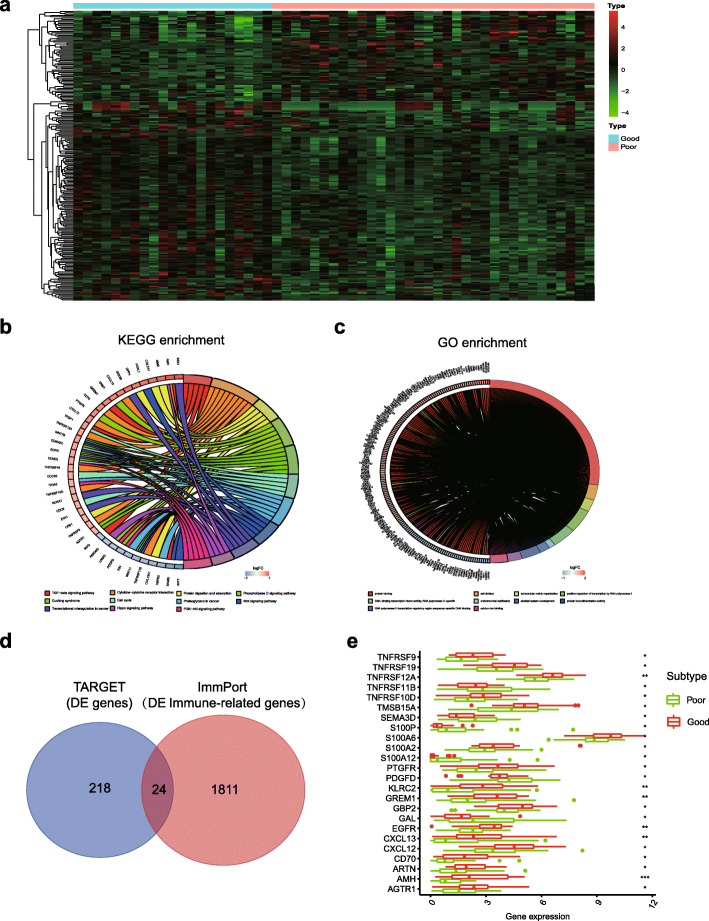
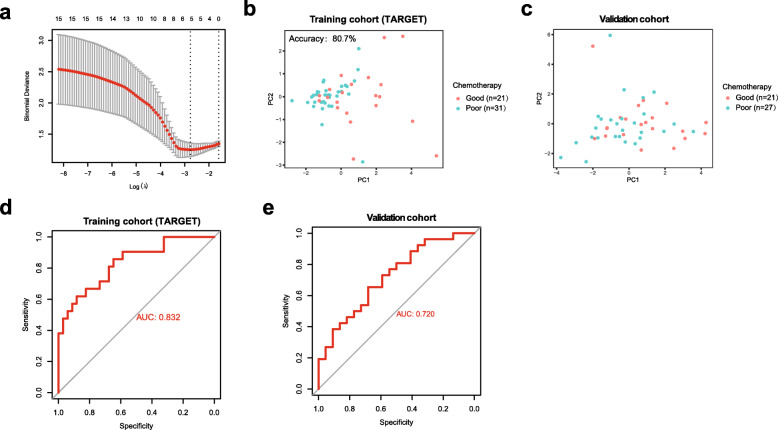
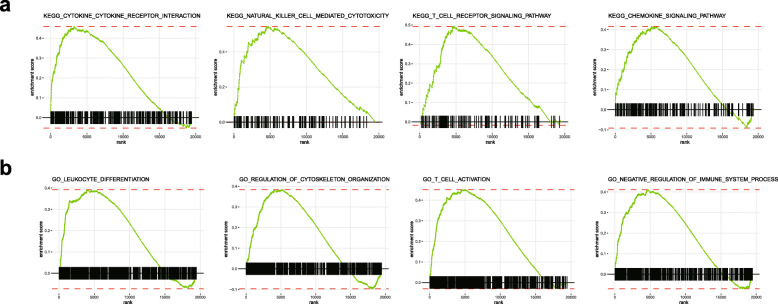
Methods: We analysed the relevance of immune cell infiltration and gene expression profiles of the tumor samples of good responders with those of poor responders from the TARGET and GEO databases. Immune cell infiltration was evaluated using a single-sample gene set enrichment analysis (ssGSEA) and the CIBERSORT algorithm between good and poor chemotherapy responders. Differentially expressed genes were identified based on the chemotherapy response. LASSO regression and binary logistic regression analyses were applied to select the differentially expressed immune-related genes (IRGs) and developed a predictive signature in the training cohort. A receiver operating characteristic (ROC) curve analysis was employed to assess and validate the predictive accuracy of the predictive signature in the validation cohort.

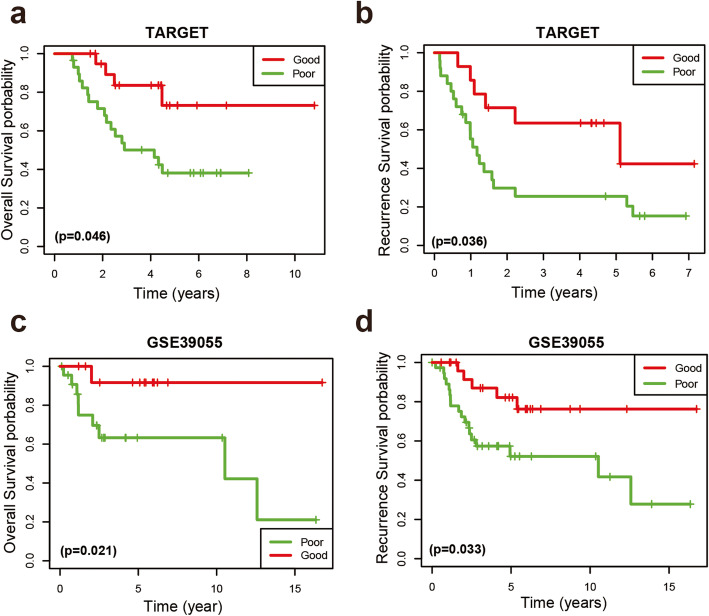
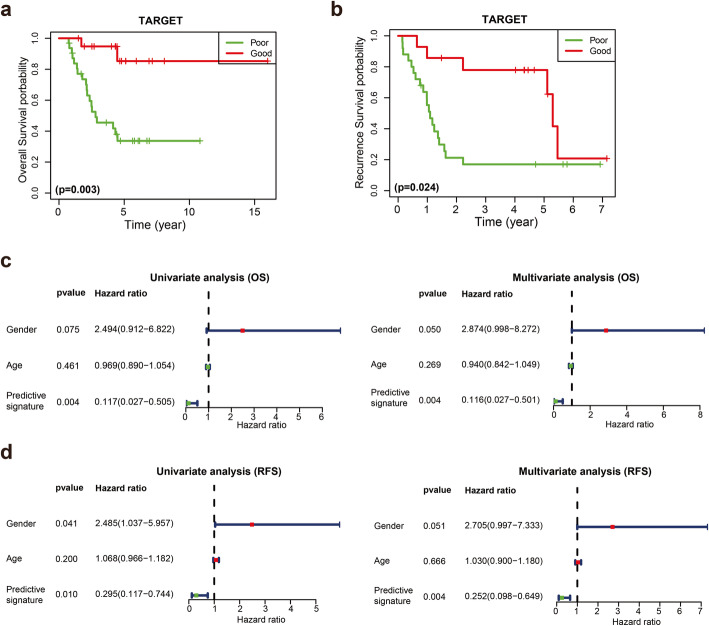
Results: The analysis of immune infiltration showed a positive relationship between high-level immune infiltration and good responders, and T follicular helper cells and CD8 T cells were significantly more abundant in good responders with osteosarcoma. Two hundred eighteen differentially expressed genes were detected between good and poor responders, and a five IRGs panel comprising TNFRSF9, CD70, EGFR, PDGFD and S100A6 was determined to show predictive power for the chemotherapy response. A chemotherapy-associated predictive signature was developed based on these five IRGs. The accuracy of the predictive signature was 0.832 for the training cohort and 0.720 for the validation cohort according to ROC analysis.

Conclusions: The novel predictive signature constructed with five IRGs can be effectively utilized to predict chemotherapy responsiveness and help improve the efficacy of chemotherapy in patients with osteosarcoma.

Keywords: Chemotherapy; Immune-related gene; Osteosarcoma; Predictive signature; Tumor immune microenvironment.


Conflict of interest statement

The authors declare that they have no competing interests.

Figures

Fig. 1
Fig. 1
Kaplan–Meier curves for OS and RFS in patients with osteosarcoma. a, b Kaplan–Meier survival curves depicting OS and RFS in patients with good response and poor response in the TARGET cohort. c, d Kaplan–Meier survival curves depicting OS and RFS in patients with good response and poor response in the GSE39055 cohort
Fig. 2
Fig. 2
The relationship between immune cell infiltration and the chemotherapy response. a Unsupervised clustering analysis of patients with osteosarcoma who achieved good and poor responses from the TARGET cohort using ssGSEA. b Comparison of the immune scores between good responders and poor responders in the TARGET cohort. c Kaplan-Meier curves for OS showing that the high immune cell infiltration subtype had a favourable outcome compared with the low immune cell infiltration subtype. d Violin plot of good responders and poor responders in the TARGET cohort. e Correlation matrix of 22 immune cell type proportions in the TARGET cohort. * p < 0.05
Fig. 3
Fig. 3
Differentially expressed genes and functional enrichment analyses. a Heatmap of 218 differentially expressed genes between good responders and poor responders. b The top 10 significant pathways identified in the KEGG enrichment analysis of 218 differentially expressed genes between good responders and poor responders. c The top 10 terms identified in the GO enrichment analysis of 218 differentially expressed genes. d Venn diagram of the 218 differentially expressed genes and 1811 IRGs from the ImmPort database. e Violin plot showing that most of the differentially expressed IRGs were upregulated in good responders. * p < 0.05, ** p < 0.01, and *** p < 0.001
Fig. 4
Fig. 4
Construction and validation of the immune-related predictive signature. a The LASSO method was used to select optimal IRGs for the predictive signature. b, c PCA of the predictive signature in the training cohort and validation cohort. d, e ROC curve analysis of the predictive signature in the training cohort and validation cohort
Fig. 5
Fig. 5
Kaplan-Meier curves for the OS and RFS of good responders and poor responders discriminated by the predictive signature. a, b Kaplan-Meier curves for OS and RFS between good responders and poor responders discriminating by predictive signature in the training cohort. c, d Forrest plots of the univariate and multivariate analyses showed that the predictive signature for the chemotherapy response predicted OS and RFS in the TARGET cohort independent of clinical factors
Fig. 6
Fig. 6
Functional assessment of the immune-related predictive signature using GSEA. a The KEGG analysis showed that cytokine-cytokine receptor interaction, natural killer cell-mediated cytotoxicity, T cell receptor signalling pathway and chemokine signalling pathway were increased in the good responder group. b The GO analysis showed that leukocyte differentiation, regulation of cytoskeletal organization, T cell activation and negative regulation of immune system processes were increased in the good responder group

Similar articles

Cited by

References

    1. Pullan JE, Budh DP. StatPearls. Treasure Island: StatPearls Publishing Copyright © 2020, StatPearls Publishing LLC; 2020. Primary Bone Cancer.
    1. Jafari F, Javdansirat S, Sanaie S, Naseri A, Shamekh A, Rostamzadeh D, Dolati S. Osteosarcoma: a comprehensive review of management and treatment strategies. Ann Diagn Pathol. 2020;49:151654. doi: 10.1016/j.anndiagpath.2020.151654. - DOI - PubMed
    1. Czarnecka AM, Synoradzki K, Firlej W, Bartnik E, Sobczuk P, Fiedorowicz M, et al. Molecular Biology of Osteosarcoma. Cancers. 2020;12(8):1-27. - PMC - PubMed
    1. Eaton BR, Schwarz R, Vatner R, Yeh B, Claude L, Indelicato DJ, et al. Osteosarcoma. Pediatr Blood Cancer. 2020:e28352:S1-7. - PubMed
    1. Zhu W, Zhu L, Bao Y, Zhong X, Chen Y, Wu Q. Clinical evaluation of neoadjuvant chemotherapy for osteosarcoma. J BUON. 2019;24(3):1181–1185. - PubMed

Publication types

MeSH terms

Substances