. 2021 May 20;21(1):269.
doi: 10.1186/s12935-021-01965-1.

Elevated expression of LPCAT1 predicts a poor prognosis and is correlated with the tumour microenvironment in endometrial cancer

Affiliations

Elevated expression of LPCAT1 predicts a poor prognosis and is correlated with the tumour microenvironment in endometrial cancer

Tianyi Zhao et al. Cancer Cell Int. .

Abstract

Background: Endometrial cancer (EC) is one of the three malignant reproductive tumours that threaten women's lives and health. Glycerophospholipids (GPLs) are important bioactive lipids involved in various physiological and pathological processes, including cancer. Immune infiltration of the tumour microenvironment (TME) is positively associated with the overall survival in EC. Exploring GPL-related factors associated with the TME in endometrial cancer can aid in the prognosis of patients and provide new therapeutic targets.

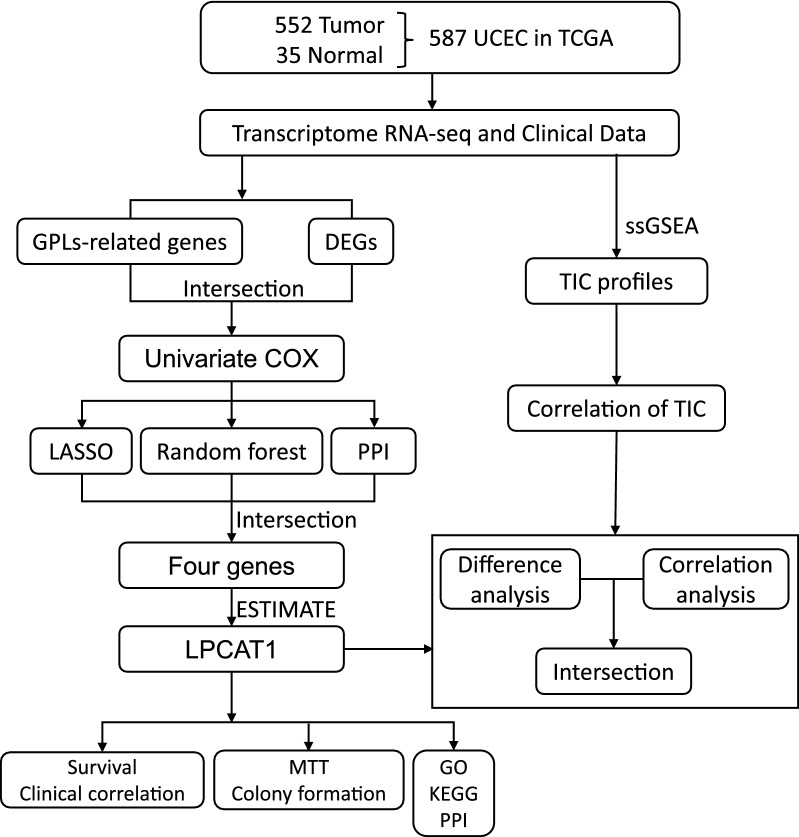
Methods: Differentially expressed GPL-related genes were identified from TCGA-UCEC datasets and the Molecular Signatures Database (MSigDB). Univariate Cox regression analysis was used to select GPL-related genes with prognostic value. The Random forest algorithm, LASSO algorithm and PPI network were used to identify critical genes. ESTIMATEScore was calculated to identify genes associated with the TME. Then, differentiation analysis and survival analysis of LPCAT1 were performed based on TCGA datasets. GSE17025 and immunohistochemistry (IHC) verified the results of the differentiation analysis. An MTT assay was then conducted to determine the proliferation of EC cells. GO and KEGG enrichment analyses were performed to explore the underlying mechanism of LPCAT1. In addition, we used the ssGSEA algorithm to explore the correlation between LPCAT1 and cancer immune infiltrates.

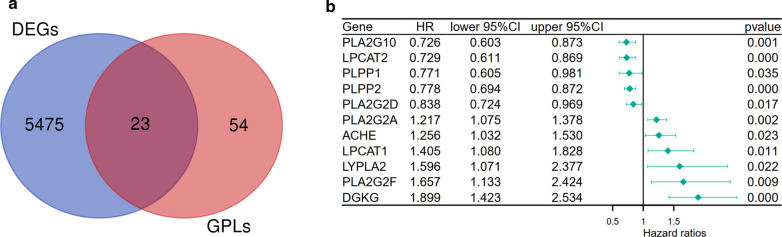
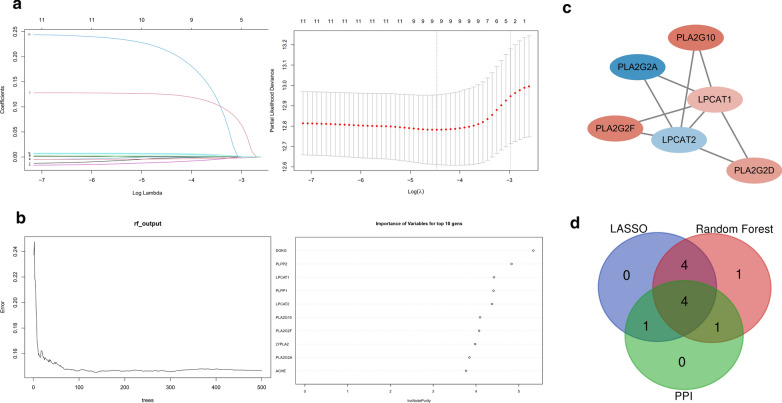
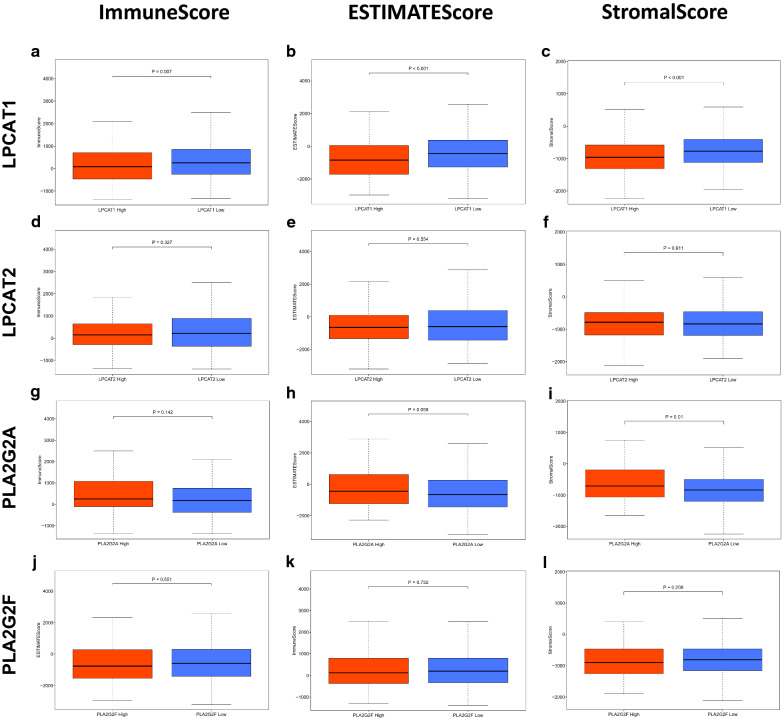
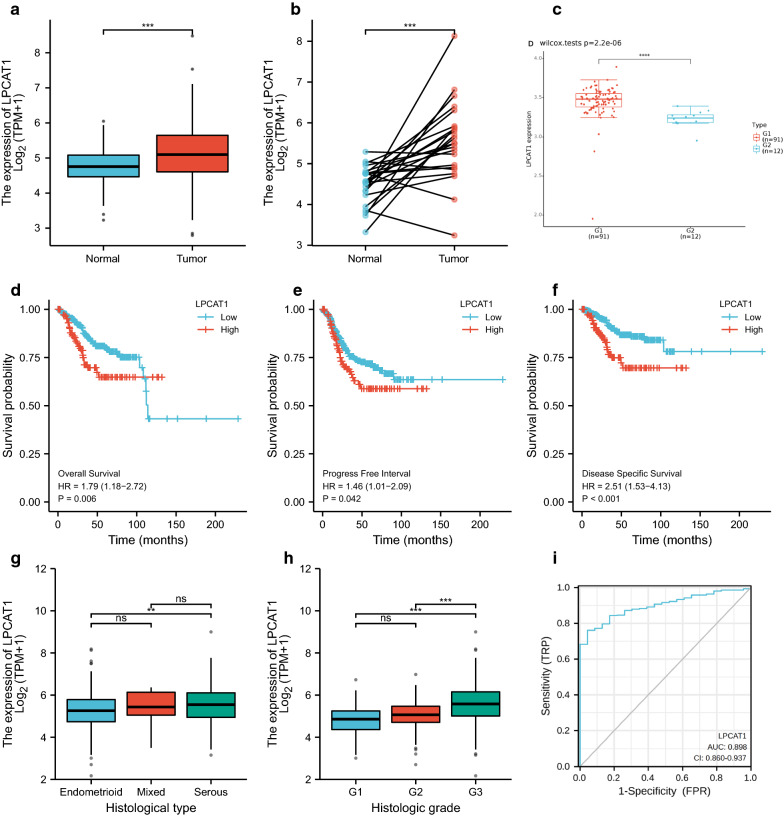
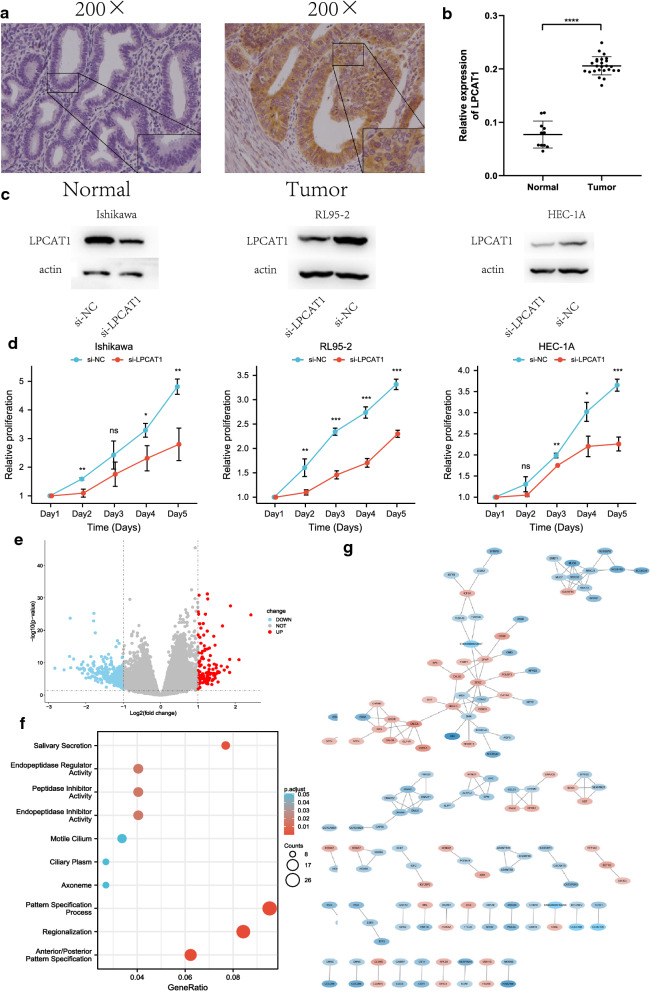
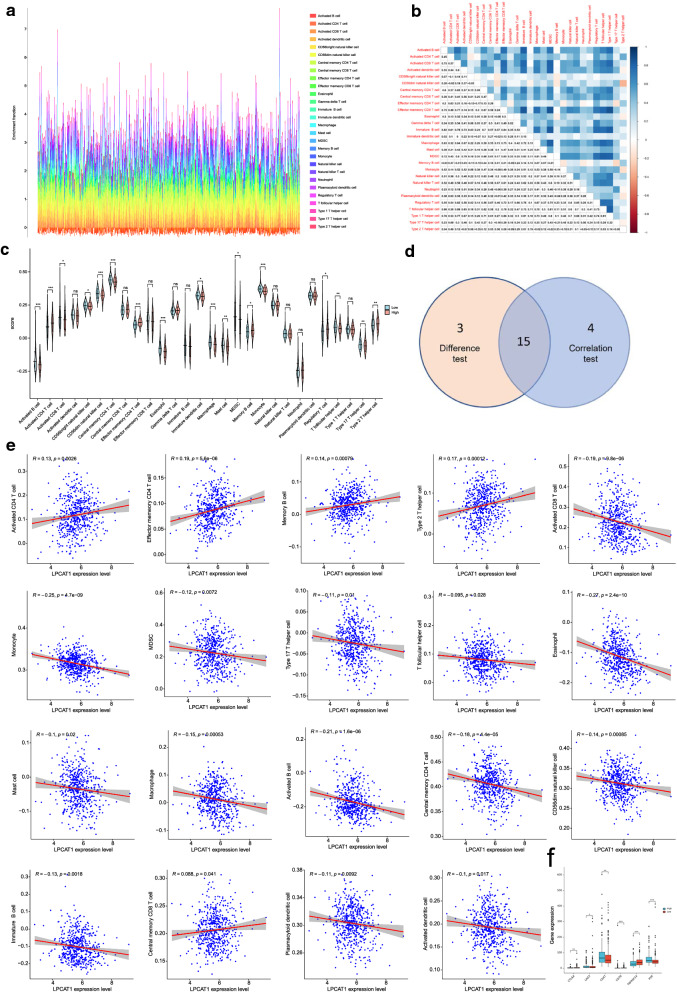
Results: Twenty-three differentially expressed GPL-related genes were identified, and eleven prognostic genes were selected by univariate Cox regression analysis. Four significant genes were identified by two different algorithms and the PPI network. Only LPCAT1 was significantly correlated with the tumour microenvironment. Then, we found that LPCAT1 was highly expressed in tumour samples compared with that in normal tissues, and lower survival rates were observed in the groups with high LPCAT1 expression. Silencing of LPCAT1 inhibited the proliferation of EC cells. Moreover, the expression of LPCAT1 was positively correlated with the histologic grades and types. The ROC curve indicated that LPCAT1 had good prognostic accuracy. Receptor ligand activity, pattern specification process, regionalization, anterior/posterior pattern specification and salivary secretion pathways were enriched as potential targets of LPCAT1. By using the ssGSEA algorithm, fifteen kinds of tumor-infiltrating cells (TICs) were found to be correlated with LPCAT1 expression.

Conclusion: These findings suggested that LPCAT1 may act as a valuable prognostic biomarker and be correlated with immune infiltrates in endometrial cancer, which may provide novel therapy options for and improved treatment of EC.

Keywords: Endometrial cancer; Glycerophospholipids; LPCAT1; Tumor microenvironment.


Conflict of interest statement

The authors declare no competing interests.

Figures

Fig. 1
Fig. 1
Flow chart of data collection and analysis
Fig. 2
Fig. 2
Identification of prognostic GPL-related differentially expressed genes in UCEC patients. a Venn plots showing intersecting genes shared by DEGs between tumour and adjacent normal tissues and GPL-related genes. b Univariate Cox regression analysis of the expression of 23 GPL-related genes and OS was performed and shown on a forest plot, listing 11 significant factors with p<0.05
Fig. 3
Fig. 3
LASSO penalized Cox model, random forest model and PPI analysis for selecting core GPL-related genes. a Nine key GPL-related genes were predicted based on ridge regression and LASSO. b The top ten genes were selected by the random forest algorithm. c The PPI network downloaded from the STRING database was constructed with nodes with interaction confidence values >0.65. d Venn plot displaying four core GPL-related intersecting genes according to the LASSO algorithm, random forest algorithm and PPI analysis
Fig. 4
Fig. 4
Correlation of ImmuneScore, StromalScore and ESTIMATEScore of each UCEC patient with the expression of four core GPL-related genes. ac Distribution of ImmuneScore, StromalScore and ESTIMATEScore in terms of LPCAT1 expression (p=0.007, p<0.001, p<0.001, respectively, by Wilcoxon rank sum test). df Distribution of the three scores in terms of LPCAT2 expression (p=0.327, 0.554, 0.911 for ImmuneScore, StromalScore and ESTIMATEScore, respectively, by Wilcoxon rank sum test). gi Distribution of the scores in terms of PLA2G2A expression (p=0.142, 0.058, 0.01, for ImmuneScore, StromalScore, and ESTIMATEScore separately by Wilcoxon rank sum test). jl Distribution of the scores in terms of PLA2G2F expression (p=0.551, 0.732, 0.298, respectively, by Wilcoxon rank sum test)
Fig. 5
Fig. 5
Differentiated expression of LPCAT1 in tumour and normal samples and the correlation of LPCAT1 expression with the survival and clinicopathological characteristics of TCGA-UCEC patients. a Differentiated expression of LPCAT1 in the normal and tumour samples. Analyses were performed across all normal and tumour samples with ***p<0.001 by Wilcoxon rank sum test. b Paired differentiation analysis for the expression of LPCAT1 in normal and tumour samples derived from the same patient (***p<0.001 by the Wilcoxon rank sum test). c Differentiated expression of LPCAT1 in the normal and tumour samples in GSE17025 (****p<0.0001 by the Wilcoxon rank sum test). df Overall survival, progression-free interval and disease-specific survival analysis of UCEC patients with different LPCAT1 expression levels. Patients were labelled as high expression or low expression according to the optimal cut-off value (minimum p-value). p=0.006, 0.042, 0.036 by log-rank test. g, h The correlation of LPCAT1 expression with histologic grade and histological type. The Wilcoxon rank sum or KruskalWallis rank sum test served as the statistical significance test. i ROC curve for judging the accuracy of LPCAT1(AUC=0.898)
Fig. 6
Fig. 6
Silencing the expression of LPCAT1 inhibits the proliferation of endometrial cancer cells. Volcano plot, proteinprotein interaction and enrichment analyses of GO and KEGG for DEGs between the high-expression group and low-expression group of LPCAT1. a Representative image of LPCAT1 expression in endometrial cancer tissues and normal endometrial samples was evaluated by immunohistochemistry. b Integrated optical density was analysed. ****P<0.0001. c Western blotting was performed to evaluate the protein expression of LPCAT1 at the translation level after transfection with a siRNA targeting LPCAT1 or a scrambled siRNA as a negative control (si-NC). d The relative proliferation ability of the transfected endometrial cancer cells was detected at a fixed time for 5days by the MTT assay. The growth curves were analysed using 2-way ANOVA. e Volcano plot of the DEGs generated by comparison of the high expression group and low expression group depending on the median expression of LPCAT1. Differentially expressed genes were determined by the Wilcoxon rank sum test with q=0.05 and log2FC transformation as the significance threshold. f GO and KEGG enrichment analyses of 378 DEGs. Terms with p and q<0.05 were considered to be significantly enriched. g Interaction network constructed with nodes with interaction confidence values>0.65
Fig. 7
Fig. 7
Correlation of the proportion of TICs in UCEC samples, and association of TICs proportion and typical ICGs with LPCAT1 expression. a Barplot showing the proportion of 22 types of TICs in the UCEC tumour samples. The column names of the barplot are the sample IDs. b Heatmap showing the correlation between 22 kinds of TICs, the p-value in each tiny box indicates the correlation between two cells. Persons correlation coefficient was used for statistical significance test. c Violin plot showing the differentiation ratio of 28 kinds of immune cells between UCEC tumour samples with high or low LPCAT1 expression relative to the median of LPCAT1 expression level, and the Wilcoxon rank sum was used as the statistical significance test. d Scatter plot showing the correlation of 19 TIC proportions with the LPCAT1 expression (p<0.05). The red line in each plot was the fitted curve of linear model indicating the immune cells proportion tropism along with LPCAT1 expression, and the Person correlation coefficient was applied for statistical significance test. e Venn plot displaying fifteen kinds of TICs correlated with LPCAT1 expression codetermined by correlation and difference tests displayed in violin and scatter plots, respectively. f Differential expression of ICGs between the LPCAT1 high-expression group and LPCAT1 low-expression group. *p<0.05, **p<0.01, ***p<0.001

Similar articles

Cited by

References

    1. Sung H, Ferlay J, Siegel RL, Laversanne M, Soerjomataram I, Jemal A, Bray F. Global cancer statistics 2020: GLOBOCAN estimates of incidence and mortality worldwide for 36 cancers in 185 countries. CA Cancer J Clin. 2021 doi: 10.3322/caac.21660. - DOI - PubMed
    1. Lu KH, Broaddus RR. Endometrial cancer. N Engl J Med. 2020;383(21):2053–2064. doi: 10.1056/NEJMra1514010. - DOI - PubMed
    1. Byrne FL, Poon IK, Modesitt SC, Tomsig JL, Chow JD, Healy ME, Baker WD, Atkins KA, Lancaster JM, Marchion DC, et al. Metabolic vulnerabilities in endometrial cancer. Cancer Res. 2014;74(20):5832–5845. doi: 10.1158/0008-5472.CAN-14-0254. - DOI - PubMed
    1. Efeyan A, Comb WC, Sabatini DM. Nutrient-sensing mechanisms and pathways. Nature. 2015;517(7534):302–310. doi: 10.1038/nature14190. - DOI - PMC - PubMed
    1. Holthuis JC, Menon AK. Lipid landscapes and pipelines in membrane homeostasis. Nature. 2014;510(7503):48–57. doi: 10.1038/nature13474. - DOI - PubMed

LinkOut - more resources