. 2021 May 20;19(1):108.
doi: 10.1186/s12915-021-01044-x.

Very long intergenic non-coding (vlinc) RNAs directly regulate multiple genes in cis and trans

Affiliations

Very long intergenic non-coding (vlinc) RNAs directly regulate multiple genes in cis and trans

Huifen Cao et al. BMC Biol. .

Abstract

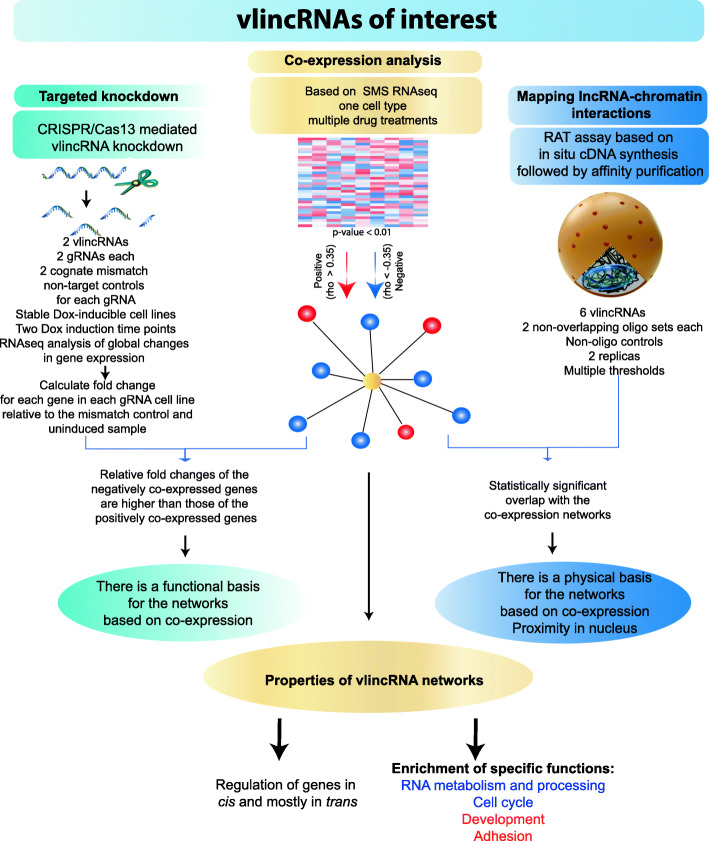
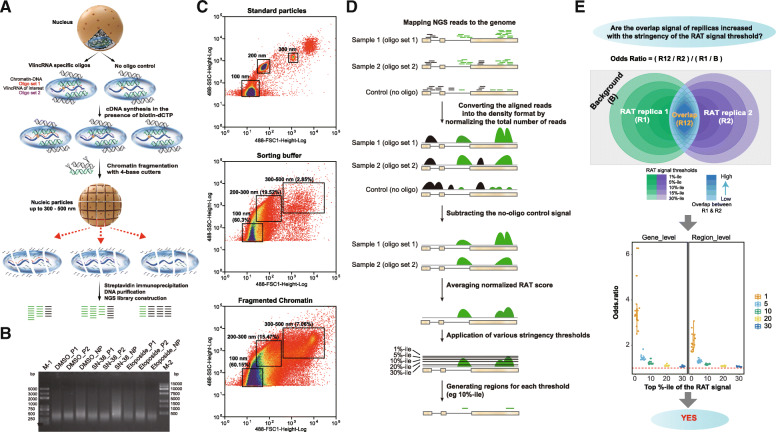
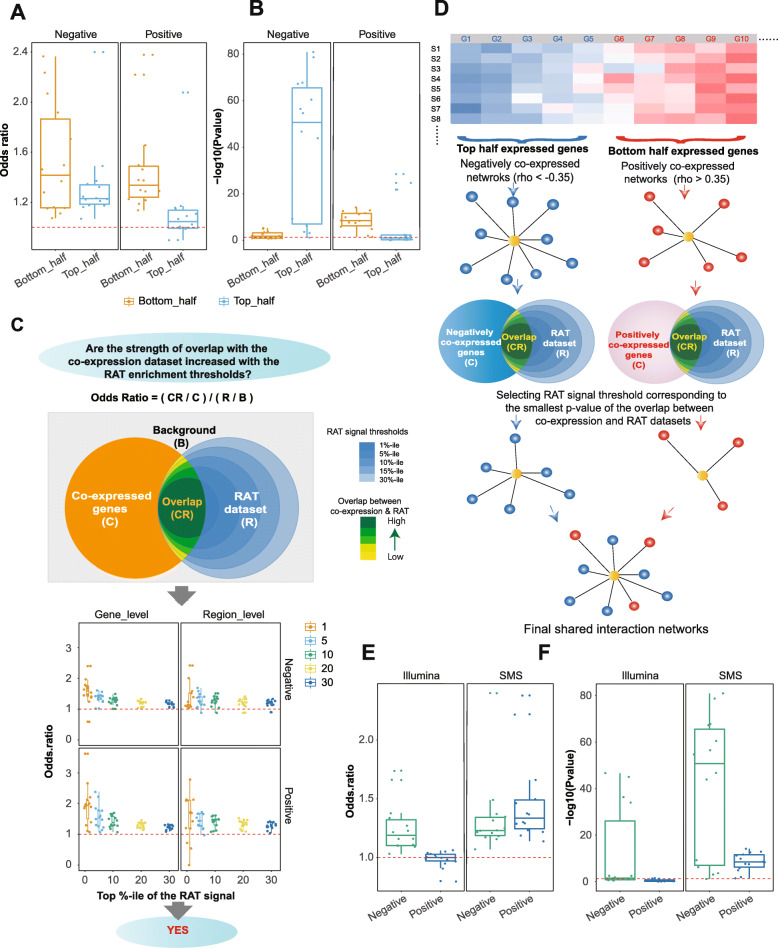
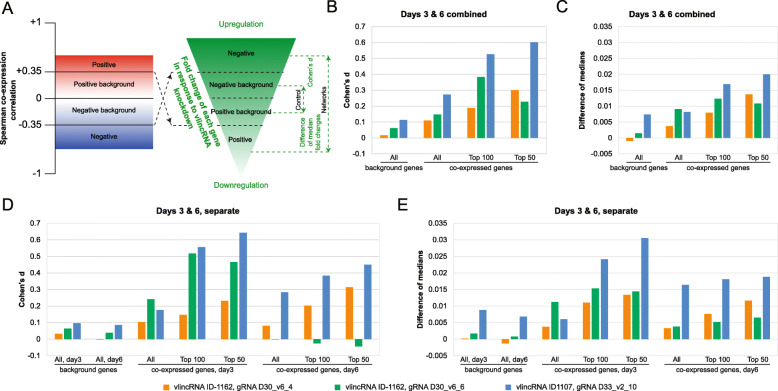
Background: The majority of the human genome is transcribed in the form of long non-coding (lnc) RNAs. While these transcripts have attracted considerable interest, their molecular mechanisms of function and biological significance remain controversial. One of the main reasons behind this lies in the significant challenges posed by lncRNAs requiring the development of novel methods and concepts to unravel their functionality. Existing methods often lack cross-validation and independent confirmation by different methodologies and therefore leave significant ambiguity as to the authenticity of the outcomes. Nonetheless, despite all the caveats, it appears that lncRNAs may function, at least in part, by regulating other genes via chromatin interactions. Therefore, the function of a lncRNA could be inferred from the function of genes it regulates. In this work, we present a genome-wide functional annotation strategy for lncRNAs based on identification of their regulatory networks via the integration of three distinct types of approaches: co-expression analysis, mapping of lncRNA-chromatin interactions, and assaying molecular effects of lncRNA knockdowns obtained using an inducible and highly specific CRISPR/Cas13 system.

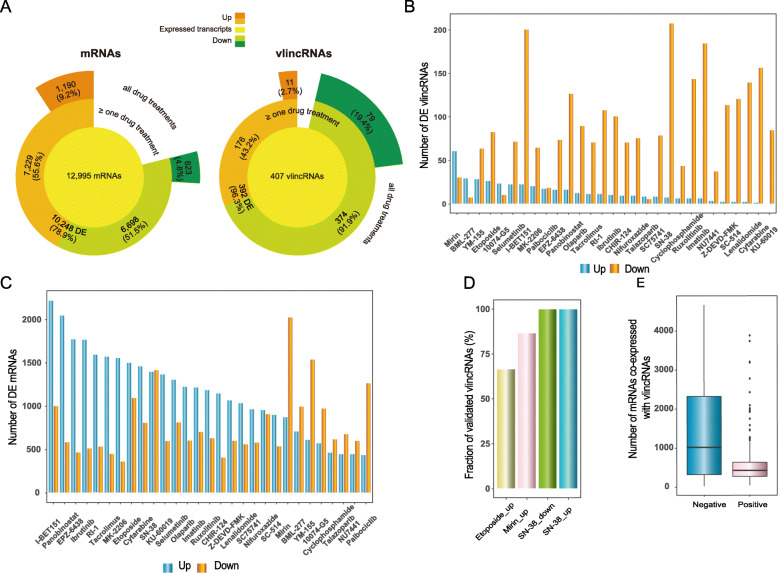
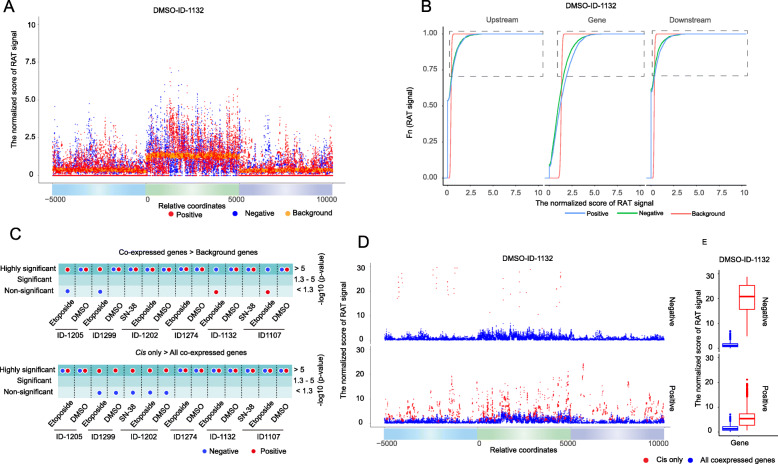
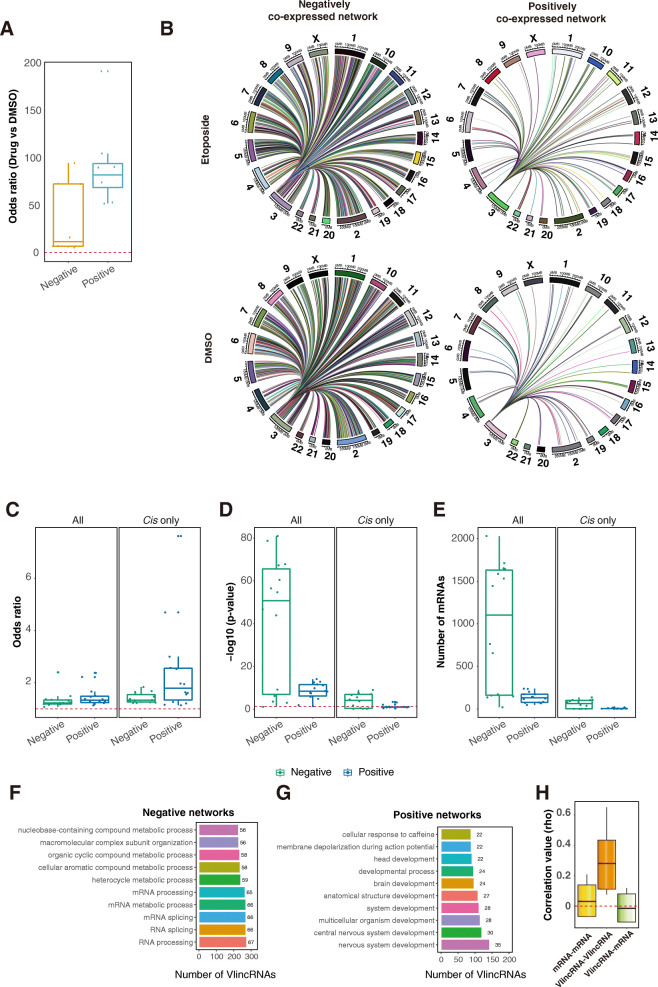
Results: We applied the strategy to annotate 407 very long intergenic non-coding (vlinc) RNAs belonging to a novel widespread subclass of lncRNAs. We show that vlincRNAs indeed appear to regulate multiple genes encoding proteins predominantly involved in RNA- and development-related functions, cell cycle, and cellular adhesion via a mechanism involving proximity between vlincRNAs and their targets in the nucleus. A typical vlincRNAs can be both a positive and negative regulator and regulate multiple genes both in trans and cis. Finally, we show vlincRNAs and their regulatory networks potentially represent novel components of DNA damage response and are functionally important for the ability of cancer cells to survive genotoxic stress.

Conclusions: This study provides strong evidence for the regulatory role of the vlincRNA class of lncRNAs and a potentially important role played by these transcripts in the hidden layer of RNA-based regulation in complex biological systems.

Keywords: Anti-cancer drugs; CRISPR/Cas13; Cell cycle; Development; RNA processing; RNA-chromatin interactions; Regulatory networks; Single-molecule sequencing; lncRNA; vlincRNA.


Conflict of interest statement

The authors declare that they have no competing interests.

Figures

Fig. 1
Fig. 1
Flow chart diagram illustrating the overall concept of the project. The overall concept of the project, critical experimental and analytical steps and major conclusions are shown
Fig. 2
Fig. 2
SMS-based expression and co-expression analyses for various drug treatments. a Distributions of the numbers of DE mRNAs (left) and vlincRNAs (right). The yellow inner circles represent mRNAs or vlincRNAs expressed in K562; the orange and green middle sections represent respectively up- or downregulated transcripts in at least one drug treatment; the orange and green outer sections represent respectively up- or downregulated transcripts in all drug treatments. b, c Numbers of DE vlincRNAs (b) and mRNAs (c) for each indicated treatment. The blue and orange bars represent respectively up- and downregulated transcripts. d Fractions of DE vlincRNAs validated by qPCR in each indicated treatment. e Box plots representing numbers genes found in either negative and positive co-expression-based vlincRNA networks
Fig. 3
Fig. 3
Description and validation of the RAT assay. a The flow diagram of the molecular biological part of the RAT assay. The light blue oval represents a region of the nucleus in the relative vicinity of a vlincRNA that would be co-purified with the vlincRNA by the RAT assay. The green and black lines represent DNA molecules that respectively are and are not located in the relative vicinity of vlincRNA. The red and purple lines represent specific oligonucleotides from the set 1 and 2 targeting each vlincRNA (short lines) and the cDNAs primed by these oligonucleotides (long lines). b An example of the DNA size distributions obtained after chromatin fragmentation in a typical RAT experiment for the DMSO- or drug-treated (etoposide or SN-38) samples. The assays performed with either the oligonucleotide set 1 (P1), 2 (P2), or the no-oligonucleotide control (NP) for the vlincRNA ID-1202. c Size distributions of particles obtained in a sorting experiment in the either the buffer (middle panel) and the buffer containing the chromatin fragmented using the conditions employed in a typical RAT experiment (bottom panel). The distribution of the particles with known sizes of 100, 200, and 300nm is shown in the top panel. Note the increase in the fraction of the particles in the 300500nm range in the fragmented chromatin sample vs the sorting buffer (7.06% vs 2.85%). d The flow diagram of the analytical part of the RAT assay. e Top: definition of the odds ratio and the depiction of the hypothesis tested in the part below. Bottom: box plots of the odds ratios of the overlaps between the two biological replicas of the RAT assay at the gene (left) and region (right) levels at different RAT signal thresholds (X-axes)
Fig. 4
Fig. 4
Patterns and statistical significance of enrichment of the RAT signal in the co-expressed genes. a Plots showing ANARS for gene bodies and 5kb flanking regions for all genes co-expressed with vlincRNA ID-1132 and the background genes. The sizes of the genic regions were scaled to 5kb. The ANARS shown in this example was calculated based on the RAT assay performed in the DMSO-treated cells. The ANARS for the positively, negatively and the control background genes is represented by respectively red, blue, and orange dots. b ECDF plots for the data shown in a. Note the shift to the right of the plots corresponding to the co-expressed genes signifying increase in the signal relative to the background genes. The top 30% of the data used for the statistical significance analysis are demarcated by the boxes. c Summary of the distribution of the statistical significance of enrichment of ANARS in the co-expressed vs the background genes (top) and cis vs all genes (bottom). d Plots showing ANARS for gene bodies and 5kb flanking regions for genes co-expressed with vlincRNA ID-1132 (and located on the same chromosome (cis, red dots) and all co-expressed genes (blue dots). The sizes of the genic regions were scaled to 5kb. e Boxplots of the data presented in d for positions with non-zero ANARS
Fig. 5
Fig. 5
Validation of the co-expression derived networks using RAT assay. a, b Box plots of the odd ratios (a) and p values (b) of overlap between co-expression networks and the chromatin interaction datasets after stratifying the genes into the top and bottom half based on the expression. c Top: definition of the odds ratio and the depiction of the hypothesis tested in the part below. Bottom: box plots of the odds ratios of the overlaps between the co-expression networks and genes containing RAT regions at the gene (left) and region (right) levels at different RAT signal thresholds (X-axes). d A diagram illustrating selection of final RAT signal thresholds for each of the 14 vlincRNA-treatment combinations based on the best overlap with the co-expressed genes. e, f Overlap between the co-expression networks and genes containing RAT signals at the final RAT signal thresholds for the SMS and Illumina platforms. Odds ratios (e) and p values (f) are shown
Fig. 6
Fig. 6
Effect of vlincRNA knockdowns using CRISPR/Cas13 on relative fold changes of the co-expressed genes. a Schematic representation of the expected connection between the either positively or negatively co-expressed genes (left) and the corresponding change in expression level in response to a vlincRNA knockdown (right). be Relative differences in the fold changes between negatively and positively co-expressed genes for each gRNA targeting-control pair (bottom). The relative differences were calculated as Cohens d metrics (b, d) or differences of medians (c, e) by either combining the data for both time points (3 and 6days) (b, c) or analyzing them separately (d, e). More details in the text
Fig. 7
Fig. 7
Properties of vlincRNA regulatory networks. a Stability of the regulatory networks in different treatmentsbox plots of the odds ratios of the overlap between networks in the DMSO- and drug-treated samples for the 6 vlincRNAs. be Regulation of multiple genes in trans and cis. Most of the genes in the positively and negatively correlating networks are found on different chromosomes as illustrated for the co-expression networks of the vlincRNA ID-1202 in either etoposide or DMSO treatments. Connections between the vlincRNA located on the chromosome 3 and each gene co-expressed (either positively or negatively) with it and containing site of vlincRNA-chromatin interactions are shown by the thin lines. Box plots of the odds ratios (c), p values (d), and the total number of genes in common (e) based on the comparisons of the co-expression networks and chromatin interaction datasets for either all genes (left plots) or genes found on the same chromosome (right plots) for the 14 vlincRNA-drug combinations. f, g Top ten GO terms enriched in genes found in either negative (f) or positive (g) co-expression networks for all 407 vlincRNAs. The GO terms were ranked based on the number of vlincRNAs (X-axes) whose networks were enriched in these terms. The numbers next to each term represent % of vlincRNAs containing the term out of the total 407 vlincRNAs. h Boxplots of the Spearman correlation values of all possible pairwise combinations of mRNA-mRNA, vlincRNA-vlincRNA, and mRNA-vlincRNA

Similar articles

Cited by

References

    1. Kapranov P, Cawley SE, Drenkow J, Bekiranov S, Strausberg RL, Fodor SP, et al. Large-scale transcriptional activity in chromosomes 21 and 22. Science. 2002;296(5569):916–919. doi: 10.1126/science.1068597. - DOI - PubMed
    1. Kapranov P, St Laurent G, Raz T, Ozsolak F, Reynolds CP, Sorensen PH, et al. The majority of total nuclear-encoded non-ribosomal RNA in a human cell is 'dark matter' un-annotated RNA. BMC Biol. 2010;8(1):149. doi: 10.1186/1741-7007-8-149. - DOI - PMC - PubMed
    1. Djebali S, Davis CA, Merkel A, Dobin A, Lassmann T, Mortazavi A, et al. Landscape of transcription in human cells. Nature. 2012;489(7414):101–108. doi: 10.1038/nature11233. - DOI - PMC - PubMed
    1. Kung JT, Colognori D, Lee JT. Long noncoding RNAs: past, present, and future. Genetics. 2013;193(3):651–669. doi: 10.1534/genetics.112.146704. - DOI - PMC - PubMed
    1. Mercer TR, Mattick JS. Structure and function of long noncoding RNAs in epigenetic regulation. Nat Struct Mol Biol. 2013;20(3):300–307. doi: 10.1038/nsmb.2480. - DOI - PubMed

Publication types