

Gut microbiome variation modulates the effects of dietary fiber on host metabolism
- PMID: 34016169
- PMCID: PMC8138933
- DOI: 10.1186/s40168-021-01061-6
Gut microbiome variation modulates the effects of dietary fiber on host metabolism
Abstract
Background: There is general consensus that consumption of dietary fermentable fiber improves cardiometabolic health, in part by promoting mutualistic microbes and by increasing production of beneficial metabolites in the distal gut. However, human studies have reported variations in the observed benefits among individuals consuming the same fiber. Several factors likely contribute to this variation, including host genetic and gut microbial differences. We hypothesized that gut microbial metabolism of dietary fiber represents an important and differential factor that modulates how dietary fiber impacts the host.
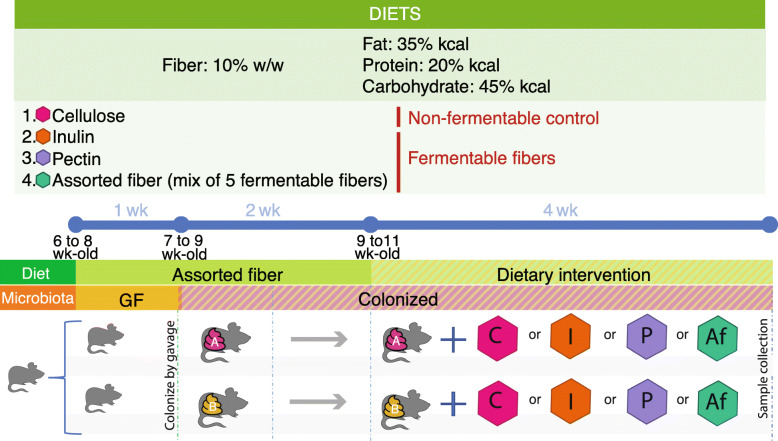
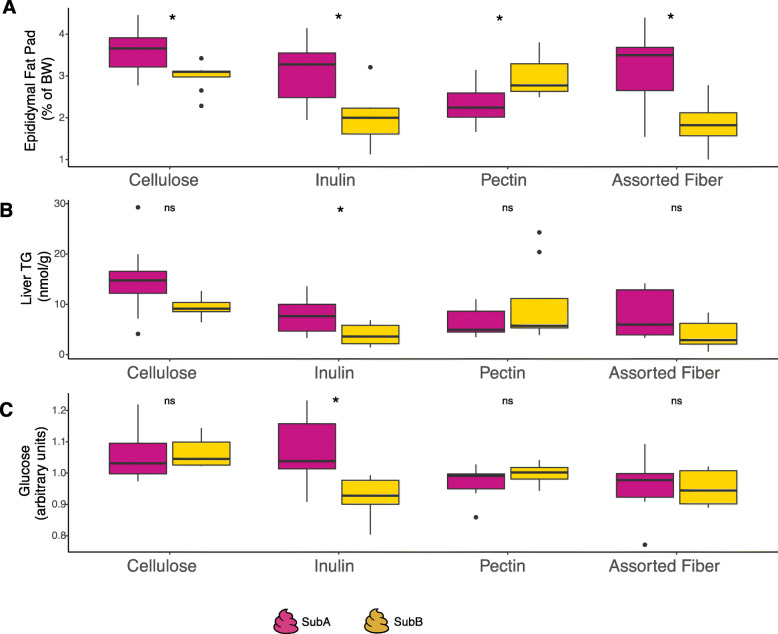
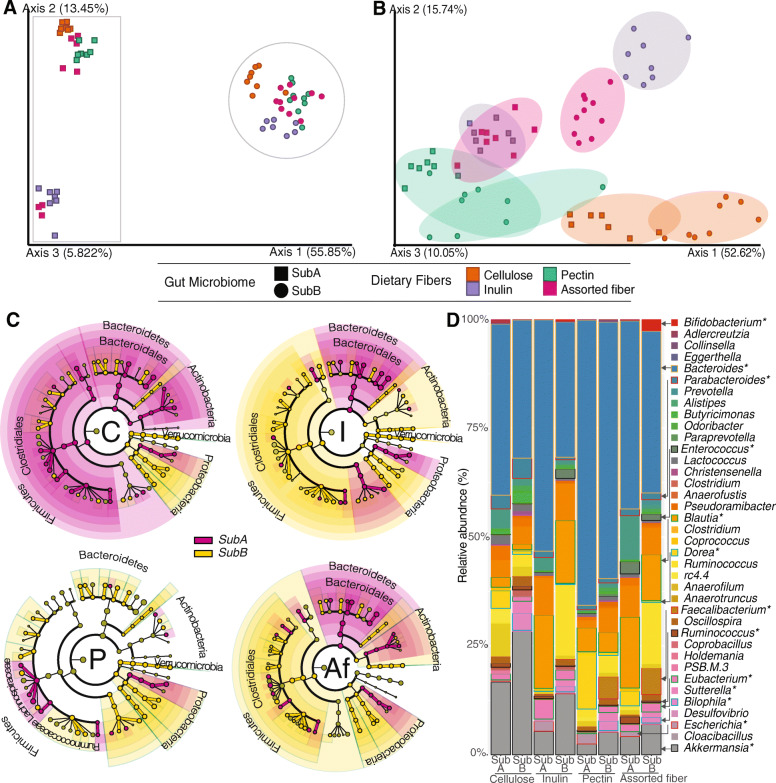
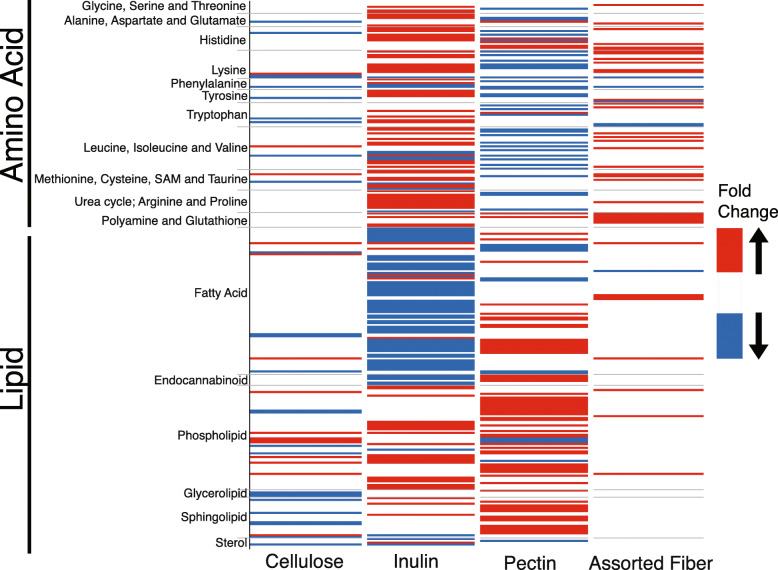
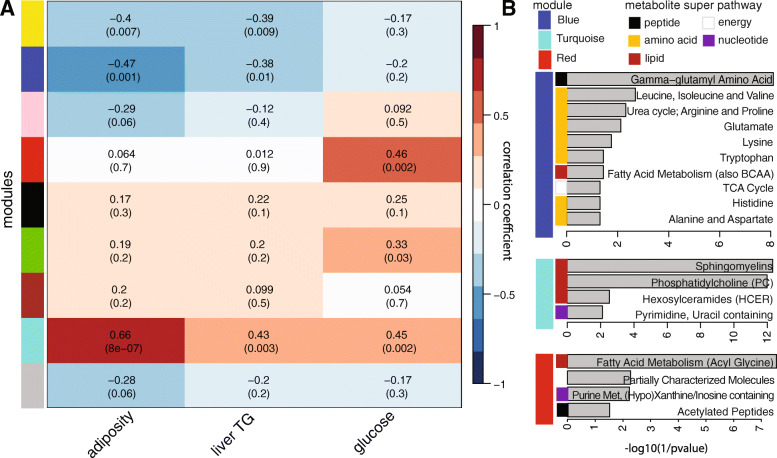
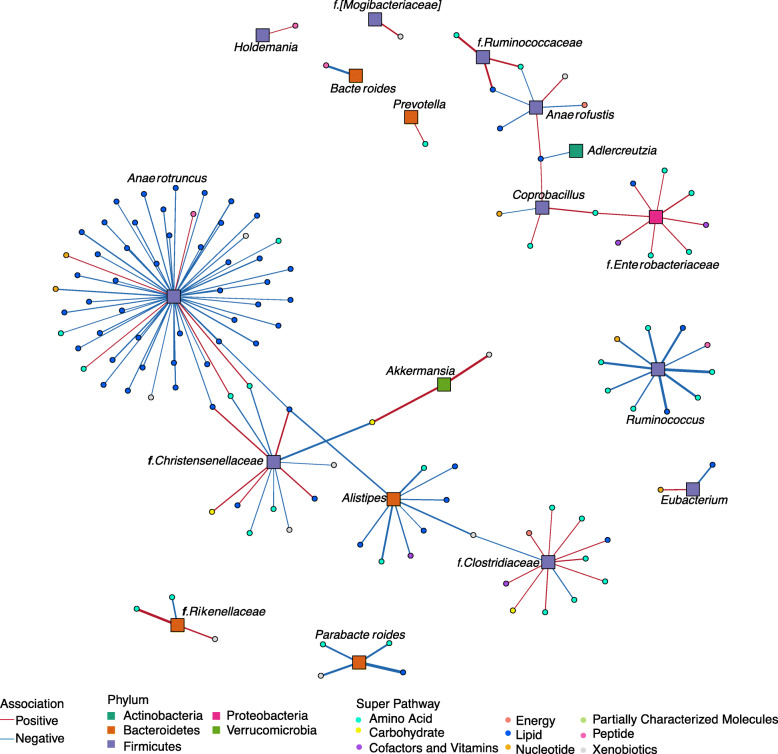
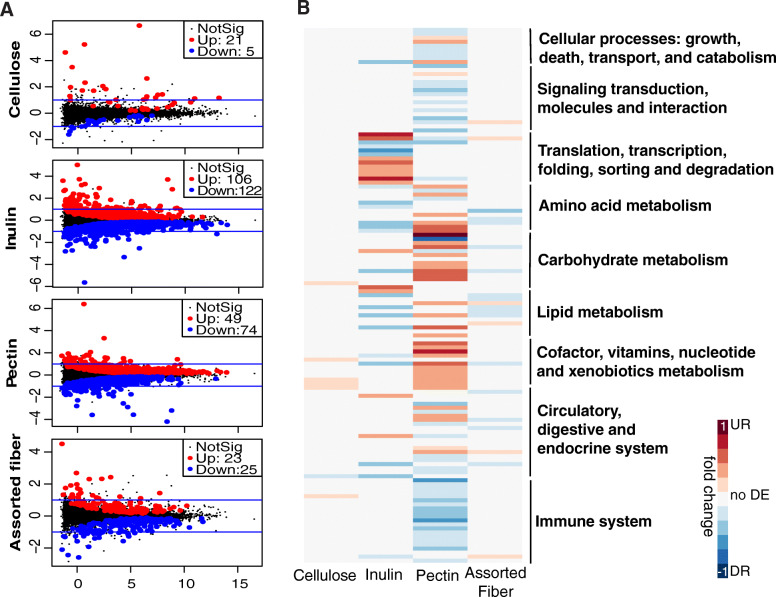
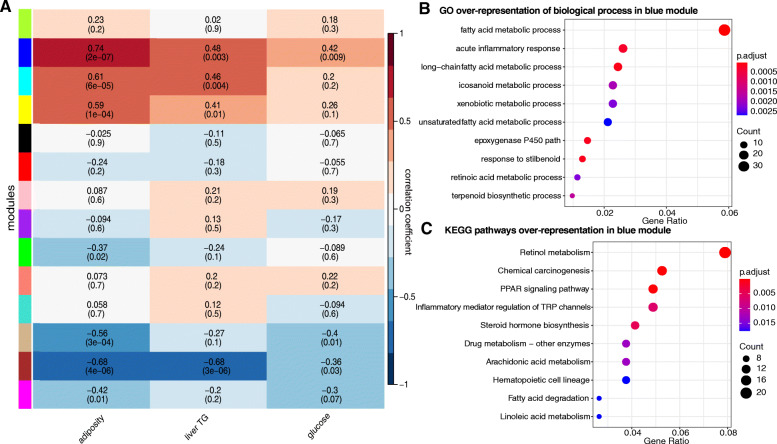
Results: We examined genetically identical gnotobiotic mice harboring two distinct complex gut microbial communities and exposed to four isocaloric diets, each containing different fibers: (i) cellulose, (ii) inulin, (iii) pectin, (iv) a mix of 5 fermentable fibers (assorted fiber). Gut microbiome analysis showed that each transplanted community preserved a core of common taxa across diets that differentiated it from the other community, but there were variations in richness and bacterial taxa abundance within each community among the different diet treatments. Host epigenetic, transcriptional, and metabolomic analyses revealed diet-directed differences between animals colonized with the two communities, including variation in amino acids and lipid pathways that were associated with divergent health outcomes.
Conclusion: This study demonstrates that interindividual variation in the gut microbiome is causally linked to differential effects of dietary fiber on host metabolic phenotypes and suggests that a one-fits-all fiber supplementation approach to promote health is unlikely to elicit consistent effects across individuals. Overall, the presented results underscore the importance of microbe-diet interactions on host metabolism and suggest that gut microbes modulate dietary fiber efficacy. Video abstract.
Conflict of interest statement
The authors declare that they have no competing interests.
Figures
Similar articles
-
Inulin diet uncovers complex diet-microbiota-immune cell interactions remodeling the gut epithelium.Microbiome. 2023 Apr 26;11(1):90. doi: 10.1186/s40168-023-01520-2. Microbiome. 2023. PMID: 37101209 Free PMC article.
-
Metabolomic, Lipidomic, Transcriptomic, and Metagenomic Analyses in Mice Exposed to PFOS and Fed Soluble and Insoluble Dietary Fibers.Environ Health Perspect. 2022 Nov;130(11):117003. doi: 10.1289/EHP11360. Epub 2022 Nov 4. Environ Health Perspect. 2022. PMID: 36331819 Free PMC article.
-
Effects of dietary inulin on bacterial growth, short-chain fatty acid production and hepatic lipid metabolism in gnotobiotic mice.J Nutr Biochem. 2015 Sep;26(9):929-37. doi: 10.1016/j.jnutbio.2015.03.010. Epub 2015 May 1. J Nutr Biochem. 2015. PMID: 26033744
-
Health promoting microbial metabolites produced by gut microbiota after prebiotics metabolism.Food Res Int. 2020 Oct;136:109473. doi: 10.1016/j.foodres.2020.109473. Epub 2020 Jun 25. Food Res Int. 2020. PMID: 32846558 Review.
-
Dietary Fiber Gap and Host Gut Microbiota.Protein Pept Lett. 2017 May 10;24(5):388-396. doi: 10.2174/0929866524666170220113312. Protein Pept Lett. 2017. PMID: 28219317 Review.
Cited by
-
Gut Microbiota Dysbiosis, Oxidative Stress, Inflammation, and Epigenetic Alterations in Metabolic Diseases.Antioxidants (Basel). 2024 Aug 14;13(8):985. doi: 10.3390/antiox13080985. Antioxidants (Basel). 2024. PMID: 39199231 Free PMC article. Review.
-
Gut bacterial metabolism contributes to host global purine homeostasis.Cell Host Microbe. 2023 Jun 14;31(6):1038-1053.e10. doi: 10.1016/j.chom.2023.05.011. Epub 2023 Jun 5. Cell Host Microbe. 2023. PMID: 37279756 Free PMC article.
-
The Bifidogenic Effect of 2'Fucosyllactose Is Driven by Age-Specific Bifidobacterium Species, Demonstrating Age as an Important Factor for Gut Microbiome Targeted Precision Medicine.Nutrients. 2024 Dec 31;17(1):151. doi: 10.3390/nu17010151. Nutrients. 2024. PMID: 39796584 Free PMC article.
-
Food and Gut Microbiota-Derived Metabolites in Nonalcoholic Fatty Liver Disease.Foods. 2022 Sep 5;11(17):2703. doi: 10.3390/foods11172703. Foods. 2022. PMID: 36076888 Free PMC article. Review.
-
Nutrient Intake and Gut Microbial Genera Changes after a 4-Week Placebo Controlled Galacto-Oligosaccharides Intervention in Young Females.Nutrients. 2021 Dec 8;13(12):4384. doi: 10.3390/nu13124384. Nutrients. 2021. PMID: 34959936 Free PMC article. Clinical Trial.
References
-
- Yatsunenko T, Rey FE, Manary MJ, Trehan I, Dominguez-Bello MG, Contreras M, Magris M, Hidalgo G, Baldassano RN, Anokhin AP, Heath AC, Warner B, Reeder J, Kuczynski J, Caporaso JG, Lozupone CA, Lauber C, Clemente JC, Knights D, Knight R, Gordon JI. Human gut microbiome viewed across age and geography. Nature. 2012;486(7402):222–227. doi: 10.1038/nature11053. - DOI - PMC - PubMed
-
- Deschasaux M, Bouter KE, Prodan A, Levin E, Groen AK, Herrema H, Tremaroli V, Bakker GJ, Attaye I, Pinto-Sietsma SJ, van Raalte DH, Snijder MB, Nicolaou M, Peters R, Zwinderman AH, Bäckhed F, Nieuwdorp M. Depicting the composition of gut microbiota in a population with varied ethnic origins but shared geography. Nat Med. 2018;24(10):1526–1531. doi: 10.1038/s41591-018-0160-1. - DOI - PubMed
Publication types
MeSH terms
Substances
Grants and funding
LinkOut - more resources
Full Text Sources
Other Literature Sources
