. 2021 Jun;35(11-12):847-869.
doi: 10.1101/gad.348295.121. Epub 2021 May 20.

ASCL1 represses a SOX9+ neural crest stem-like state in small cell lung cancer

Affiliations

ASCL1 represses a SOX9+ neural crest stem-like state in small cell lung cancer

Rachelle R Olsen et al. Genes Dev. 2021 Jun.

Abstract

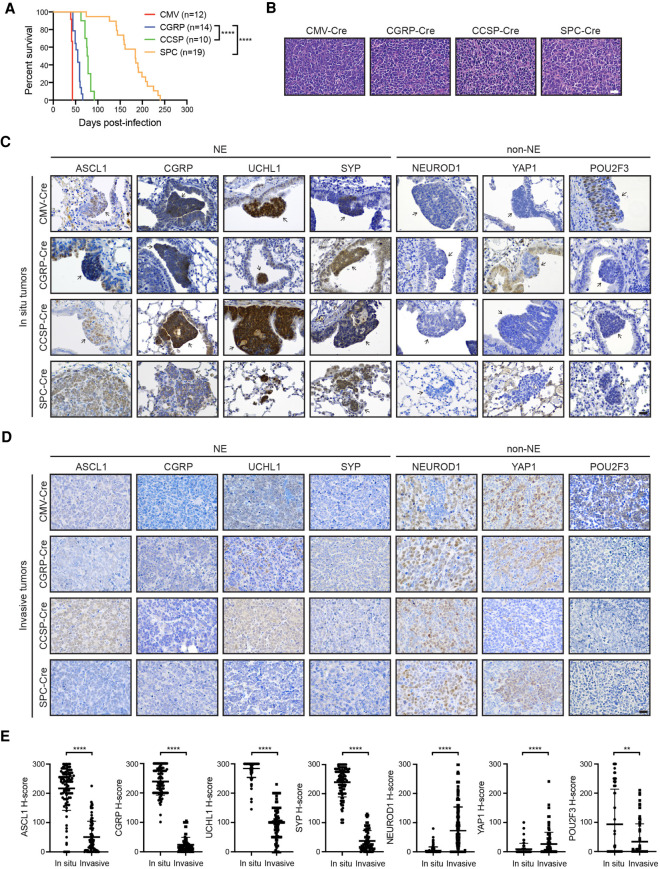
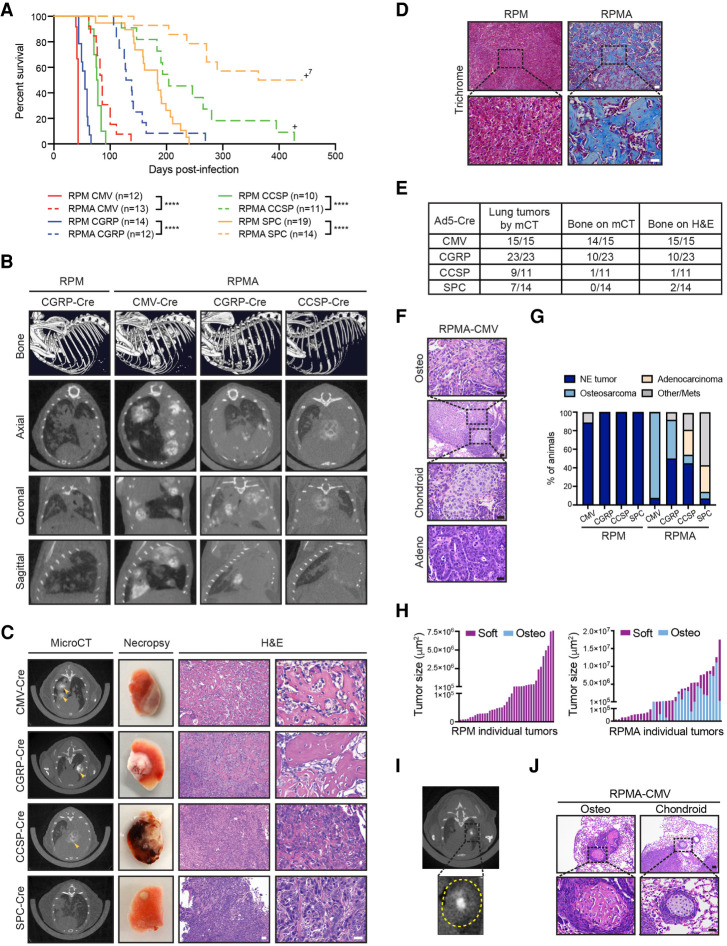
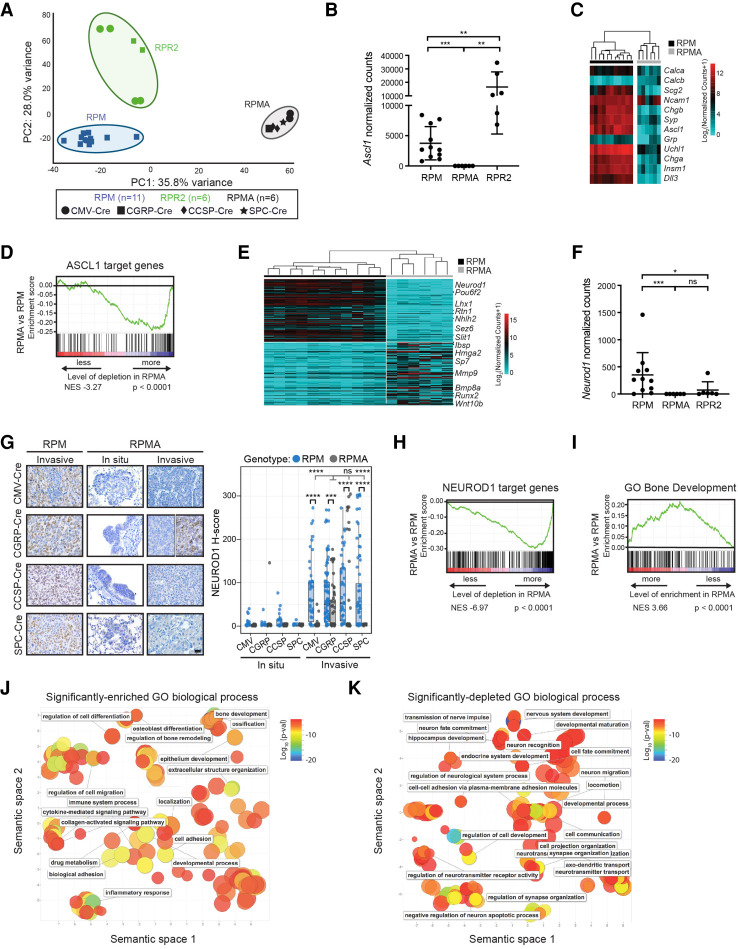
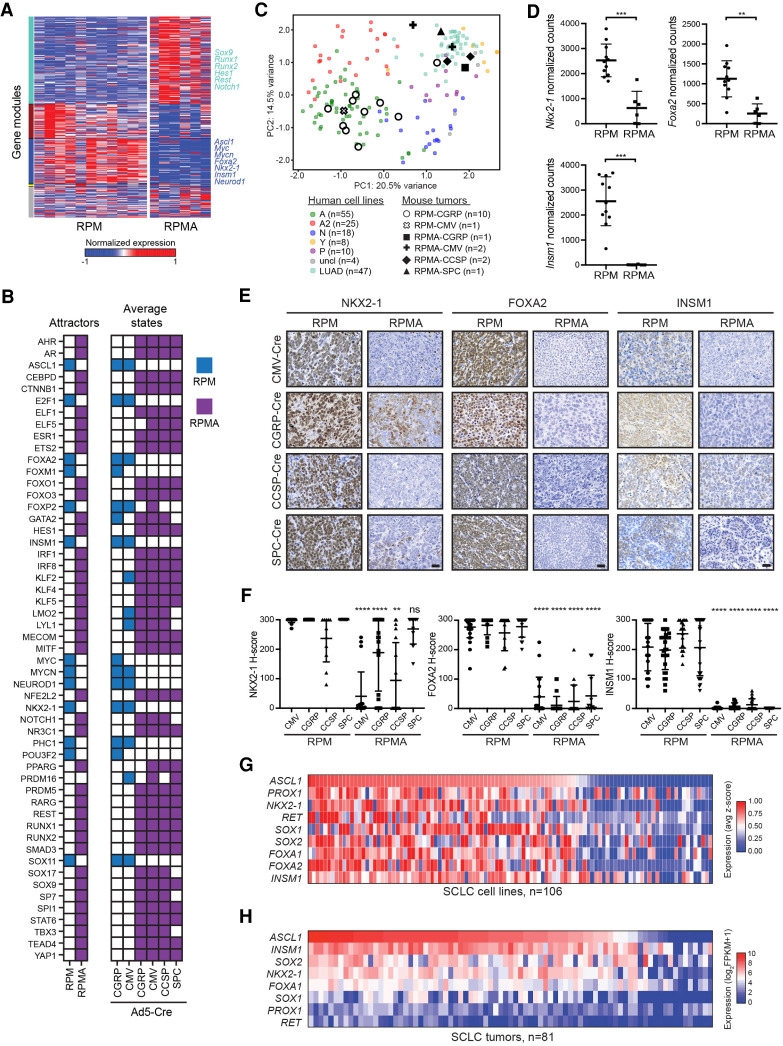
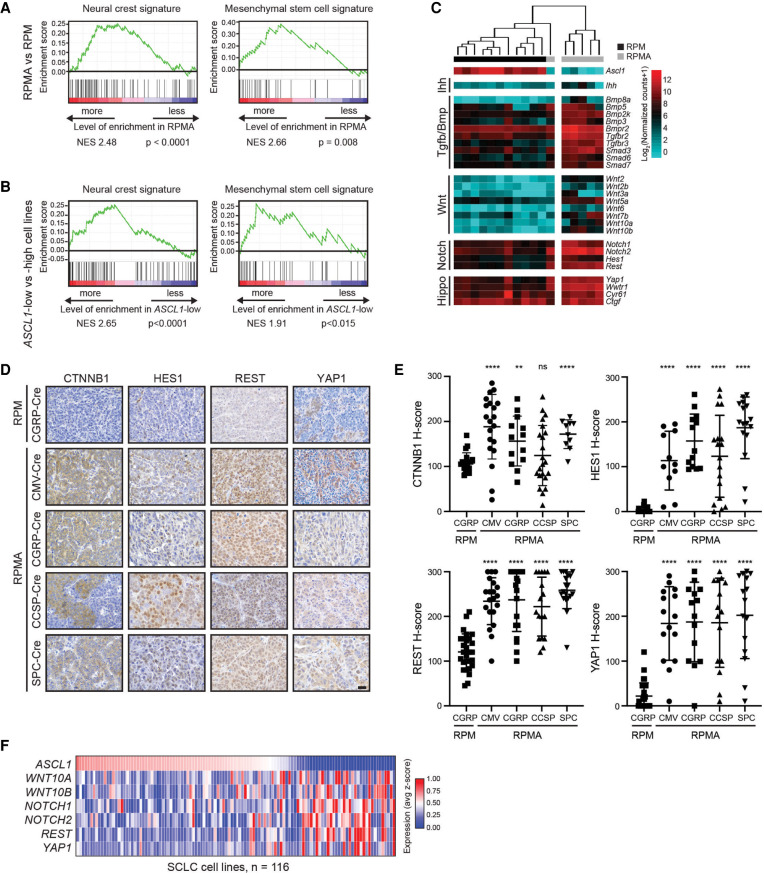
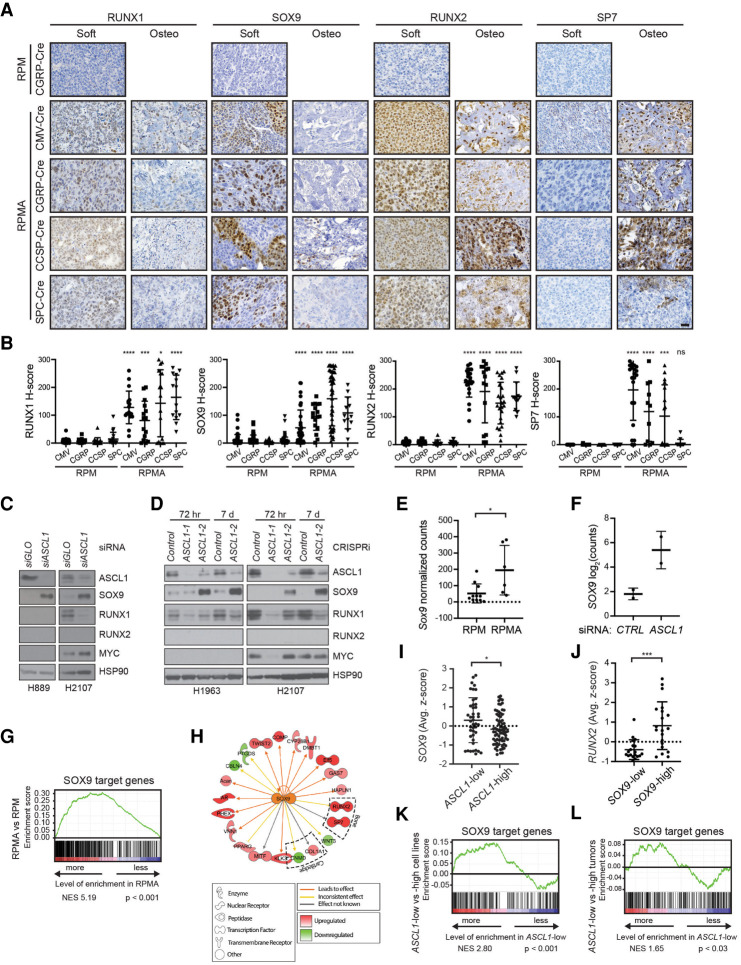
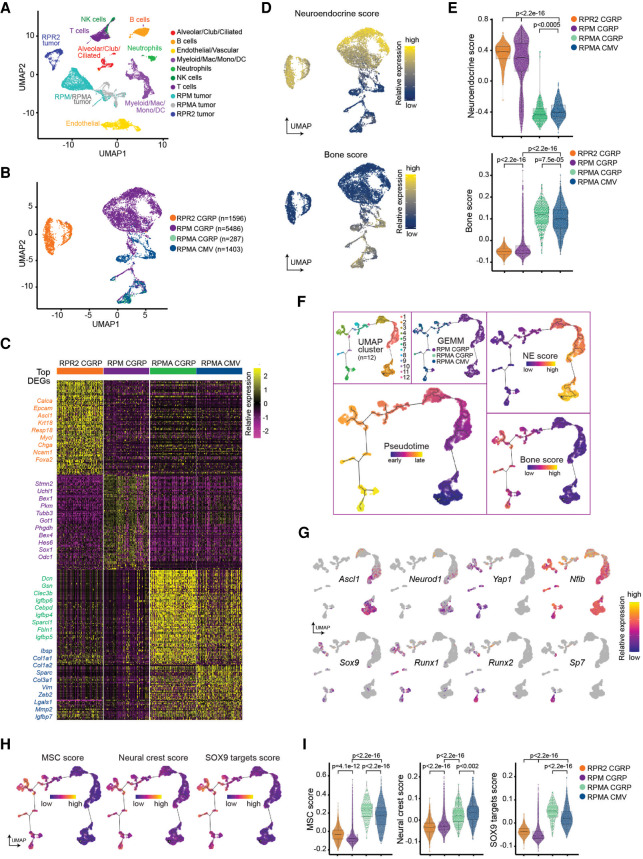
ASCL1 is a neuroendocrine lineage-specific oncogenic driver of small cell lung cancer (SCLC), highly expressed in a significant fraction of tumors. However, ∼25% of human SCLC are ASCL1-low and associated with low neuroendocrine fate and high MYC expression. Using genetically engineered mouse models (GEMMs), we show that alterations in Rb1/Trp53/Myc in the mouse lung induce an ASCL1+ state of SCLC in multiple cells of origin. Genetic depletion of ASCL1 in MYC-driven SCLC dramatically inhibits tumor initiation and progression to the NEUROD1+ subtype of SCLC. Surprisingly, ASCL1 loss promotes a SOX9+ mesenchymal/neural crest stem-like state and the emergence of osteosarcoma and chondroid tumors, whose propensity is impacted by cell of origin. ASCL1 is critical for expression of key lineage-related transcription factors NKX2-1, FOXA2, and INSM1 and represses genes involved in the Hippo/Wnt/Notch developmental pathways in vivo. Importantly, ASCL1 represses a SOX9/RUNX1/RUNX2 program in vivo and SOX9 expression in human SCLC cells, suggesting a conserved function for ASCL1. Together, in a MYC-driven SCLC model, ASCL1 promotes neuroendocrine fate and represses the emergence of a SOX9+ nonendodermal stem-like fate that resembles neural crest.

Keywords: ASCL1; SCLC; cell of origin; lung cancer; mouse models; neuroendocrine; plasticity; small cell lung cancer.


Figures

Figure 1.
Figure 1.
MYC-driven SCLC can arise in multiple lung cell types and initially expresses ASCL1. (A) Survival of RPM mice infected with indicated cell type-specific Ad-Cre viruses. Number of mice indicated in the figure. Mantel-Cox log-rank test, (****) P < 0.0001. (B) Representative H&E histology of SCLC from RPM mice initiated with indicated Ad-Cre viruses. Scale bar, 25 µm. (C) Representative immunohistochemistry (IHC) of early in situ tumor lesions for indicated neuroendocrine (NE) or non-NE markers (top) in RPM mice infected with indicated Ad-Cre viruses (left). Arrows indicate in situ tumors. Images shown are from mice collected at approximately the following time points postinfection: CMV 43 d, CGRP 55 d, CCSP 80 d, and SPC 180 d. Scale bar, 25 µm. (D) Representative IHC of large, invasive tumors for indicated neuroendocrine (NE) or non-NE markers (top) in RPM mice infected with indicated Ad-Cre viruses (left). Images shown are from mice collected at approximately the following time points postinfection: CMV 43 d, CGRP 55 d, CCSP 80 d, and SPC 180 d. Scale bar, 25 µm. (E) H-score quantification of IHC in C and D. H-score = percentage positive cells multiplied by intensity score of 0–3 (see the Materials and Methods). Approximately 70–200 tumors from three to 10 mice per condition were quantified. Data are shown as mean ± standard deviation (SD). Mann-Whitney two-tailed t-tests, (**) P < 0.01, (****) P < 0.0001. See also Supplemental Figure S1.
Figure 2.
Figure 2.
ASCL1 loss delays tumorigenesis and promotes bone differentiation in multiple cells of origin. (A) Survival curve comparing RPM (solid lines; data from Fig. 1A) versus RPMA mice (dashed lines) infected with indicated cell type-specific Cre viruses. Number of mice indicated in the figure. (+)Mice censored to end the cohort. Mantel-Cox log-rank test, (****) P < 0.0001. (B, top row) Representative bone analysis of microCT images in RPM versus RPMA mice with advanced lung tumors infected with the indicated Ad-Cre viruses. (Bottom rows) Matched axial, coronal, and sagittal cross-sections of RPM and RPMA lungs used for bone analysis. Images were collected at the following time points postinfection: RPM-CGRP 49 d, RPMA-CMV 111 d, RPMA-CGRP 139 d, and RPMA-CCSP 204 d. (C) Representative microCT axial cross-sections, necropsy images, and H&E staining for tumors from RPMA mice infected with indicated Ad-Cre viruses. Images were from mice collected at the following time points postinfection: CMV 85 d, CGRP 138 d, CCSP 204 d, and SPC 204 d. In microCT panel, yellow arrowheads indicate areas of focal bone formation. Necropsy image shows one whole lung lobe. In H&E panels, scale bar indicates 50 µm in 10× image (left), and 25 µm in the 40× image (right). (D) Representative Trichrome staining in RPM-CMV (43 d postinfection) versus RPMA-CMV (111 d postinfection) tumors. Scale bars: 50 μm for 10× image (top), 25 μm for 40× image (bottom). (E) Table indicating number of RPMA mice per cohort with lung tumors detected by microCT imaging, bone detected by microCT, or bone detected by H&E review. (F) Representative H&E from indicated mouse with adenocarcinoma or osteosarcoma and chondroid differentiation in adjacent tumor areas. Scale bars: 50 μm for 10× image (second image from top), 25 μm for 40× images. (G) Percent of RPM and RPMA mice infected with indicated cell type-specific Cre viruses that succumbed to the indicated tumor histological type. RPMA animals had a mixture of tumor types in each animal but were scored based on the preponderance of tumor type and size. “Other/mets” include animals that were sacrificed without tumors to end the cohort or that succumbed due to lymph node or brain metastases. (H) Size of individual soft tissue tumors and osteosarcomas quantified from PAB-stained slides from a representative RPM-CMV or RPMA-CMV mouse. (I) Representative microCT image from an RPMA-CGRP mouse showing bone density within the center of a soft tissue mass; tumor circled with dashed yellow line in inset. (J) Representative H&E from indicated mouse with osteosarcoma or chondroid differentiation. Scale bar indicates 50 μm for 10× image (top) and 25 μm for 40× image (bottom). See also Supplemental Figure S2, Supplemental Table S1, and Supplemental Movies.
Figure 3.
Figure 3.
RPMA tumors are transcriptionally distinct with loss of ASCL1 and NEUROD1 target genes. (A) Principal component (PC) analysis comparing gene expression by bulk RNA-seq in RPM, RPMA, and RPR2 tumors with Ad-Cre virus indicated in the figure. (B) Ascl1 expression shown as normalized counts by RNA-seq from lung tumors in indicated GEMMs. Mean ± SD. Mann-Whitney two-tailed t-test, (**) P < 0.01, (***) P < 0.0003. (C) Heat map comparing log2 normalized counts for expression of select neuroendocrine genes in RPM versus RPMA tumors. (D) Gene set enrichment analysis (GSEA) in RPMA versus RPM tumors using ASCL1 ChIP-seq target genes from Borromeo et al. (2016). Normalized enrichment score (NES) and P-value indicated in figure. (E) Heat map of top 200 (100 up and 100 down) differentially expressed genes in RPMA versus RPM tumors with select genes indicated. (F) Neurod1 expression as normalized counts by RNA-seq from lung tumors in indicated GEMMs. Mean ± SD. Mann-Whitney two-tailed t-test, (*) P < 0.05, (***) P < 0.001, (ns) not significant. (G) Representative IHC and H-score quantification for NEUROD1 in indicated tumors. Approximately 20–100 tumors were quantified from five to seven mice per condition. Images are from mice collected at approximately the following time points postinfection: RPM-CMV 43 d, RPM-CGRP 45 d, RPM-CCSP 80 d, RPM-SPC 185 d, RPMA-CMV in situ 85 d, RPMA-CMV invasive 95 d, RPMA-CGRP in situ 125 d, RPMA-CGRP invasive 180 d, RPMA-CCSP in situ 265 d, RPMA-CCSP invasive 220 d, RPMA-SPC in situ 290 d, and RPMA-SPC invasive 360 d. Scale bar, 25 µm. RPMA-CGRP IHC panel is split to indicate heterogeneity observed. Data from RPM in situ tumors are also shown in Supplemental Figure S1C. For box plots, the median and interquartile range are shown (top of box is 25th percentile, bottom of box is the 75th percentile). Gray statistics line bars indicate comparisons between RPMA models; black statistics line bars indicate comparisons between RPM and RPMA models initiated with the same virus. Mean ± SD. Mann-Whitney two-tailed t-test, (***) P = 0.0005, (****) P < 0.0001, (ns) not significant. (H) GSEA comparing RPMA versus RPM tumors using NEUROD1 ChIP-seq target genes from RPM tumors (n = 2) and human SCLC cell lines from Borromeo et al. (2016). Normalized enrichment score (NES) and P-value indicated in the figure. (I) GSEA comparing RPMA versus RPM tumor gene expression to a known ossification signature, “GO_Bone_Development.” NES and P-values are indicated in the figure. (J) Scatter plot visualizing semantic similarity of GO biological processes enriched in RPMA versus RPM tumors. (K) Scatter plot visualizing semantic similarity of GO biological processes depleted in RPMA versus RPM tumors.
Figure 4.
Figure 4.
Network analyses predict transcriptional regulators that drive osteosarcoma cell fate upon ASCL1 loss. (A) Weighted gene coexpression network analysis (WGCNA) reveals coexpressed gene modules (colored bars on the left Y-axis label) in RPM and RPMA tumors. (B) Binarized average states and state-attractors in RPM (blue) and RPMA (purple) tumors initiated with the indicated Cre viruses. For each gene, colored squares are ON and white squares are OFF. (C) Principal component (PC) analysis comparing bulk RNA-seq expression in human SCLC cell lines (SCLC lines from CCLE and cBioPortal and lung adenocarcinoma [LUAD] cell lines from CCLE) with mouse RPM or RPMA tumors initiated with the indicated viruses. Human SCLC cell lines were classified into subtypes based on high expression of ASCL1 (A and A2 variant), NEUROD1 (N), POU2F3 (P), or YAP1 (Y), or were unclassified (uncl). Mouse tumors were harvested at the following time points postinfection: RPM-CMV 55 d, RPM-CGRP 47–61 d, RPMA-CMV 85–86 d, RPMA-CGRP 111 d, RPMA-CCSP 120–204 d, and RPMA-SPC 204 d. (D) Normalized counts of indicated genes from RNA-seq in indicated GEMMs from C. Data are shown as mean ± SD. Mann-Whitney two-tailed t-test, (***) P < 0.001; (**) P < 0.01. (E) Representative IHC images for indicated antibodies in RPM and RPMA mice infected with cell type-specific Cre viruses. Images were collected from mice at approximately the following time points postinfection: RPM-CMV 43 d, RPM-CGRP 50 d, RPM-CCSP 85 d, RPM-SPC 190 d, RPMA-CMV 95 d, RPMA-CGRP 160 d, RPMA-CCSP 210 d, and RPMA-SPC 310 d. Scale bar, 25 µm. (F) H-Score IHC quantification for indicated proteins in RPM and RPMA tumors. Approximately five to 33 tumors were quantified from n = 3–5 mice per condition. Data are shown as mean ± SD. Mann-Whitney two-tailed t-test, (**) P < 0.01, (****) P < 0.0001, (ns) not significant. (G) Heat map derived from “SCLC-CellMinerCDB” showing relative expression of SCLC transcription factor genes compared with ASCL1. (H) Heat map showing relative expression of SCLC transcription factor genes in human tumors from George et al. (2015) compared with ASCL1. See also Supplemental Figure S3.
Figure 5.
Figure 5.
ASCL1 represses nonendodermal cell fates and Hippo/Notch/Wnt developmental pathways in MYC-driven SCLC. (A) GSEA in RPMA versus RPM tumors compared with neural crest and mesenchymal stem cell signatures. NES and P-values are indicated in the figure. (B) GSEA in ASCL1-low versus ASCL1-high human cell lines (SCLC-CellMinerCDB, where subtype status is defined by SCLC-CellMinerCDB) compared with neural crest and mesenchymal stem cell signatures. NES and P-values are indicated in the figure. (C) Heat map showing expression of indicated genes in RPM versus RPMA tumors analyzed by RNA-seq for components of the indicated developmental pathways. (D) Representative IHC for indicated antibodies (top) in RPM versus RPMA tumors initiated with the indicated cell type-specific Cre viruses (left). Images were collected from mice at approximately the following time points postinfection: RPM-CGRP, 50 d; RPMA-CMV, 95 d; RPMA-CGRP, 155 d; RPMA-CCSP, 215 d; and RPMA-SPC, 310 d. Scale bar, 25 μm. (E) H-score IHC quantification for indicated antibodies in D. Data are shown as mean ± SD. Approximately 11–28 tumors were used for quantification from three to five animals per condition. Mann-Whitney two-tailed t-test, (**) P < 0.01, (****) P < 0.0001, (ns) not significant. (F) Heat map derived from “SCLC-CellMinerCDB” with expression of selected genes in developmental pathways relative to ASCL1 in human SCLC cell lines. See also Supplemental Figure S4.
Figure 6.
Figure 6.
ASCL1 represses SOX9 in mouse and human SCLC tumor cells. (A) Representative IHC for indicated antibodies (top) in RPM versus RPMA tumors initiated with the indicated cell type-specific Cre viruses (left). RPMA tumors were classified as noncalcified tumors (soft) or osteosarcomas (osteo). Images were collected from mice at approximately the following time points postinfection: RPM-CGRP, 55 d; RPMA-CMV, 85 d; RPMA-CGRP, 150 d; RPMA-CCSP, 215 d; and RPMA-SPC, 310 d. Scale bar, 25 μm. (B) H-score quantification for the indicated proteins in RPM versus RPMA tumors from A. Data are shown as mean ± SD and include both soft and osteo tumors. Approximately 11–85 tumors from three to six mice per condition were quantified. Mann-Whitney two-tailed t-test, (*) P < 0.05, (***) P < 0.001, (****) P < 0.0001, (ns) not significant. (C) Representative immunoblot following 72 h treatment with control (CTRL) or ASCL1 siRNAs in the indicated human SCLC cell lines. HSP90 serves as loading control. (D) Representative immunoblot following stable infection with dCas9-KRAB for CRISPRi-mediated vector control or ASCL1 repression in the indicated human SCLC cell lines at indicated time points. Cells with ASCL1-1 were dying at 72 h and dead by 7 d. HSP90 serves as loading control. (E) Sox9 expression as normalized counts by RNA-seq from lung tumors in indicated GEMMs. Mean ± SD. Two-tailed t-test, (*) P < 0.05. (F) SOX9 expression by RNA-seq from human SCLC cell line NCI-H2107 treated for 72 h with control (CTRL) or ASCL1 siRNAs performed in biological duplicate. Results are reported as log2 normalized counts with mean ± SD. (G) GSEA for SOX9 target genes from Larsimont et al. (2015), in RPMA versus RPM tumors. NES and P-values indicated in the figure. (H) Predicted SOX9 target genes enriched or depleted in RPMA versus RPM tumors by IPA. (I) SOX9 expression in human SCLC cell lines grouped by ASCL1 expression levels in “SCLC-CellMinerCDB.” Data are shown as average z-score ± SD. Mann-Whitney two-tailed t-test, (*) P < 0.05. (J) RUNX2 expression in human SCLC cell lines grouped by SOX9 expression levels in “SCLC-CellMinerCDB.” Data are shown as average z-score ± SD. Mann-Whitney two-tailed t-test, (***) P = 0.0005. (K) GSEA for SOX9 target genes from Larsimont et al. (2015), in ASCL1-low versus ASCL1-high human SCLC cell lines from SCLC-CellMinerCDB, where ASCL1 subtype is defined by SCLC-CellMinerCDB. NES and P-values are indicated in the figure. (L) GSEA for SOX9 target genes from Larsimont et al. (2015), in ASCL1-low versus ASCL1-high human tumors from George et al. (2015). NES and P-values are indicated in the figure. ASCL1 status defined by analysis in Irelend et al. (2020). See also Supplemental Figure S5.
Figure 7.
Figure 7.
ASCL1 constrains MYC-driven evolution. (A) Primary RPMA (n = 2), RPR2 (n = 1), and RPM (n = 5) lung tumor and nontumor cell populations captured by scRNA-seq and shown in UMAP space. Predicted cell types were determined based on gene expression in Supplemental Figure S6. (B) Following removal of nontumor and low-quality cells, UMAP of RPM, RPMA, and RPR2 tumor cells only, labeled by genotype and virus used to initiate tumors. Number of cells captured per sample indicated in legend. (C) Heat map of top 100 significant DEGs for each tumor type from B (or fewer if <100 genes were significantly enriched). (Left) Genes of interest are labeled and color-coded by sample. (D) NE score from Zhang et al. (2018) (top) and published bone score (MSigDB “GO_Bone_Development”) (bottom) represented in UMAP space with cells from B. (E) Violin plots of established NE and Bone scores from D applied to scRNA-seq data of tumor samples in B. Student's two-tailed unpaired t test P-values are labeled in the figure. (F) Combined RPM and RPMA tumor cells plotted along a pseudotime trajectory using Monocle 3. (Top left) UMAP clustering along the trajectory. (Top middle) Cells labeled by tumor sample. (Bottom left) Predicted pseudotime ordering where early is dark purple and late is yellow–orange. (Right) Reciprocal expression of NE (top) and Bone scores (bottom) from D over predicted pseudotime. (G) Expression of individual genes in UMAP space as in F. Relative expression levels of each gene per cell are colored based on the panel legend. Cells with no detectable expression are labeled in gray. (H) Single-cell expression scores for a mesenchymal stem cell signature (MSC) (left) and neural crest cell signature (middle) based on MSigDB signatures used for GSEAs in Figure 5. (Right) Single-cell expression score for SOX9 target genes from Larsimont et al. (2015) is also shown. (I) Violin plots of MSC score, Neural crest score, and SOX9 target gene score corresponding with expression maps shown in H. Student's two-tailed unpaired t-test P-values are labeled in the figure. See also Supplemental Figure S6 and Supplemental Table S4.

References

    1. Achilleos A, Trainor PA. 2012. Neural crest stem cells: discovery, properties and potential for therapy. Cell Res 22: 288–304. 10.1038/cr.2012.11 - DOI - PMC - PubMed
    1. Augustyn A, Borromeo M, Wang T, Fujimoto J, Shao C, Dospoy PD, Lee V, Tan C, Sullivan JP, Larsen JE, et al. 2014. ASCL1 is a lineage oncogene providing therapeutic targets for high-grade neuroendocrine lung cancers. Proc Natl Acad Sci 111: 14788–14793. 10.1073/pnas.1410419111 - DOI - PMC - PubMed
    1. Berman SD, Calo E, Landman AS, Danielian PS, Miller ES, West JC, Fonhoue BD, Caron A, Bronson R, Bouxsein ML, et al. 2008a. Metastatic osteosarcoma induced by inactivation of Rb and p53 in the osteoblast lineage. Proc Natl Acad Sci 105: 11851–11856. 10.1073/pnas.0805462105 - DOI - PMC - PubMed
    1. Berman SD, Yuan TL, Miller ES, Lee EY, Caron A, Lees JA. 2008b. The retinoblastoma protein tumor suppressor is important for appropriate osteoblast differentiation and bone development. Mol Cancer Res 6: 1440–1451. 10.1158/1541-7786.MCR-08-0176 - DOI - PMC - PubMed
    1. Borges M, Linnoila RI, van de Velde HJ, Chen H, Nelkin BD, Mabry M, Baylin SB, Ball DW. 1997. An achaete-scute homologue essential for neuroendocrine differentiation in the lung. Nature 386: 852–855. 10.1038/386852a0 - DOI - PubMed

MeSH terms

Substances