. 2021 Jun 30;41(26):5620-5637.
doi: 10.1523/JNEUROSCI.1601-20.2021. Epub 2021 May 20.

Chitinase-Like Protein Ym2 (Chil4) Regulates Regeneration of the Olfactory Epithelium via Interaction with Inflammation

Affiliations

Chitinase-Like Protein Ym2 (Chil4) Regulates Regeneration of the Olfactory Epithelium via Interaction with Inflammation

Li Wang et al. J Neurosci. .

Abstract

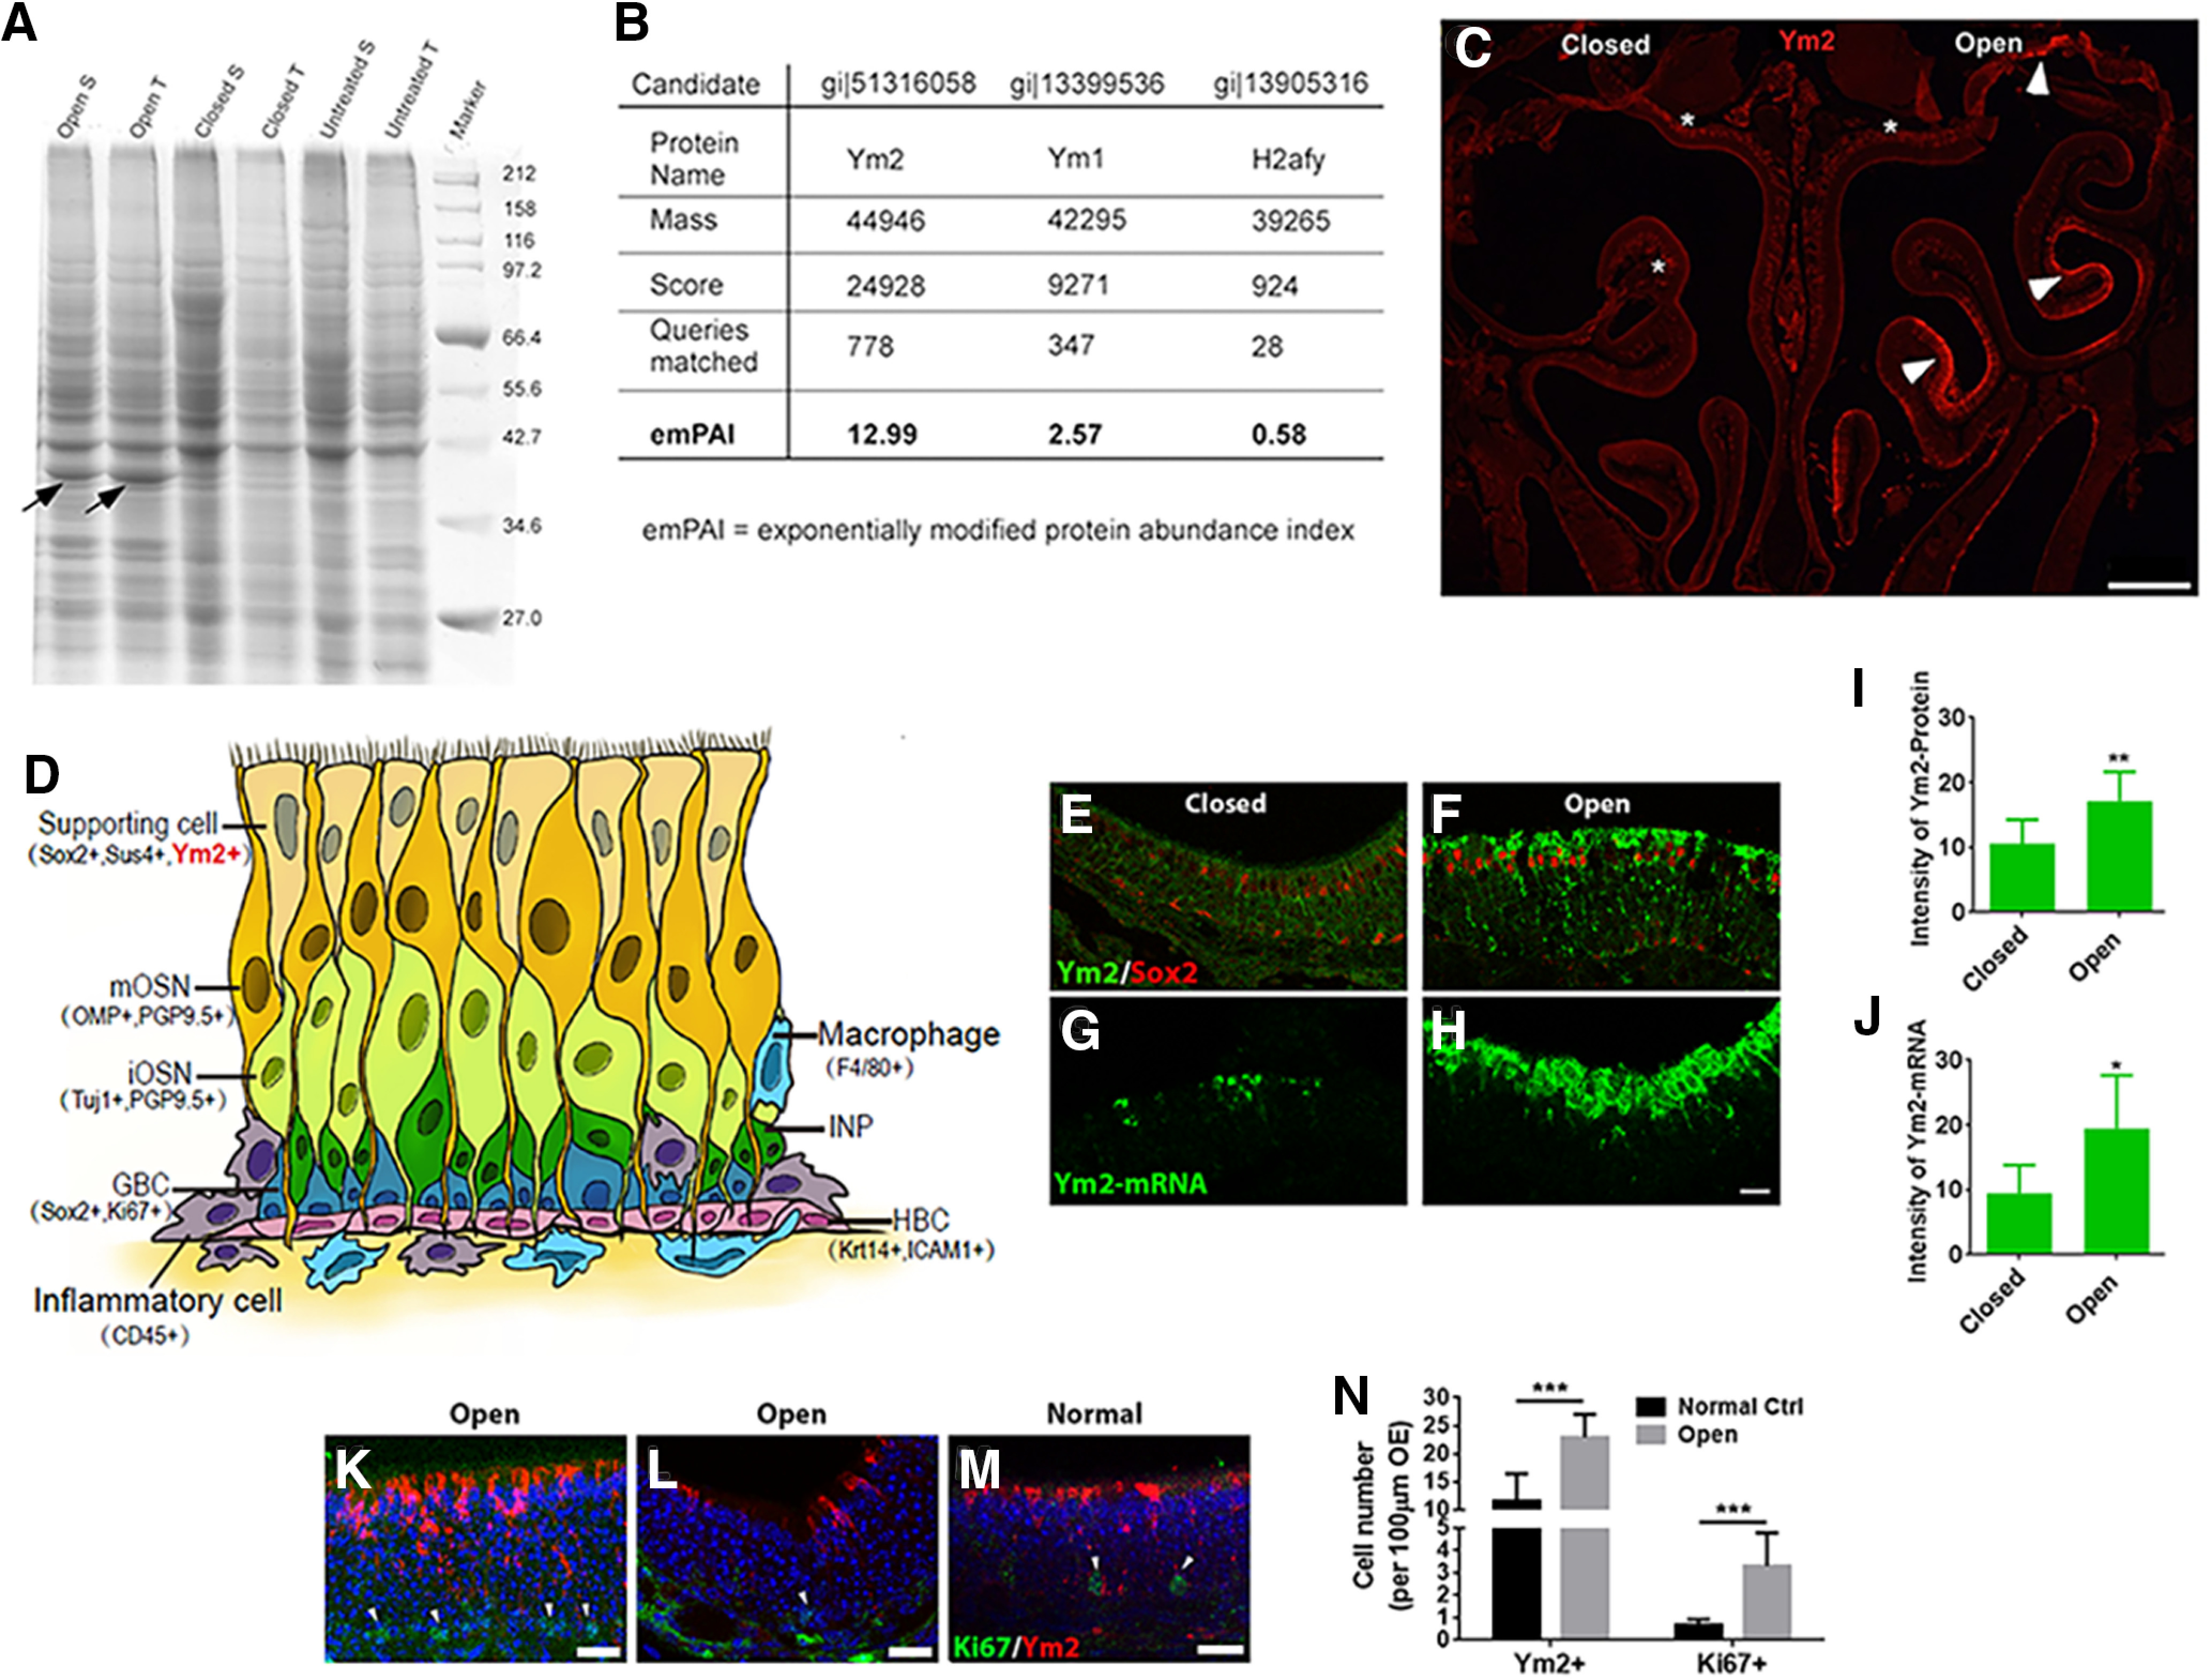
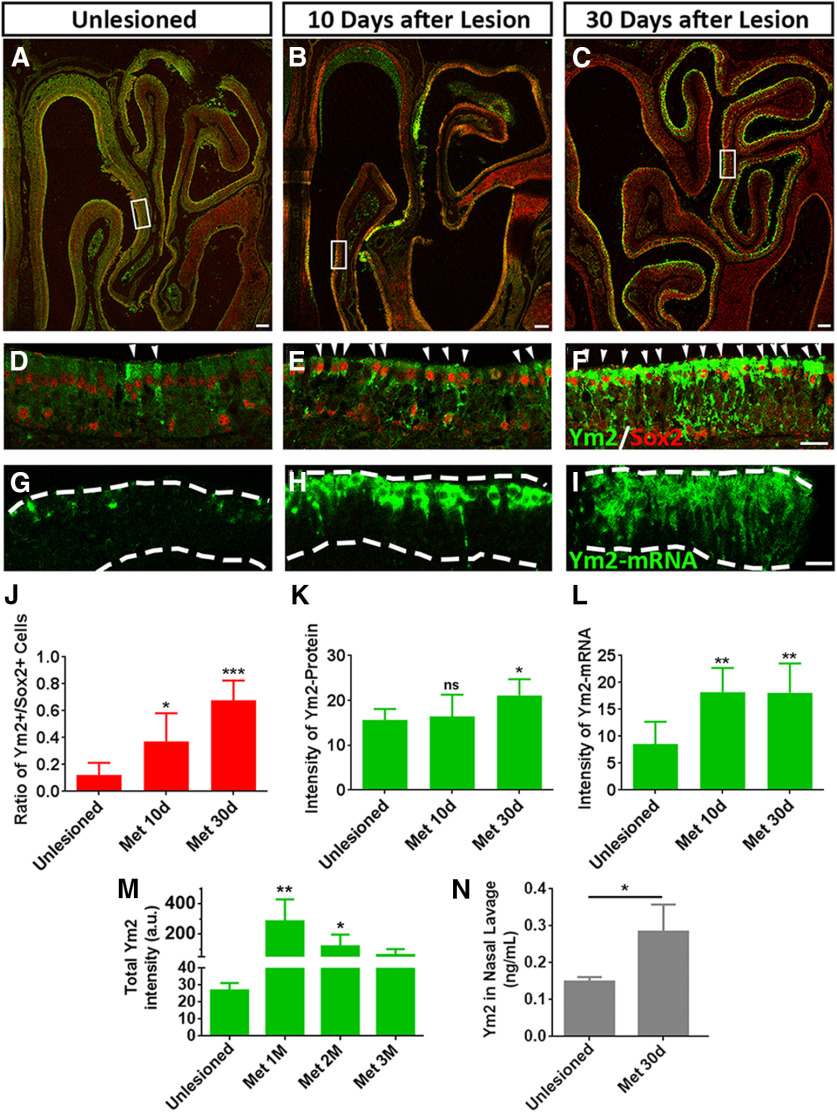
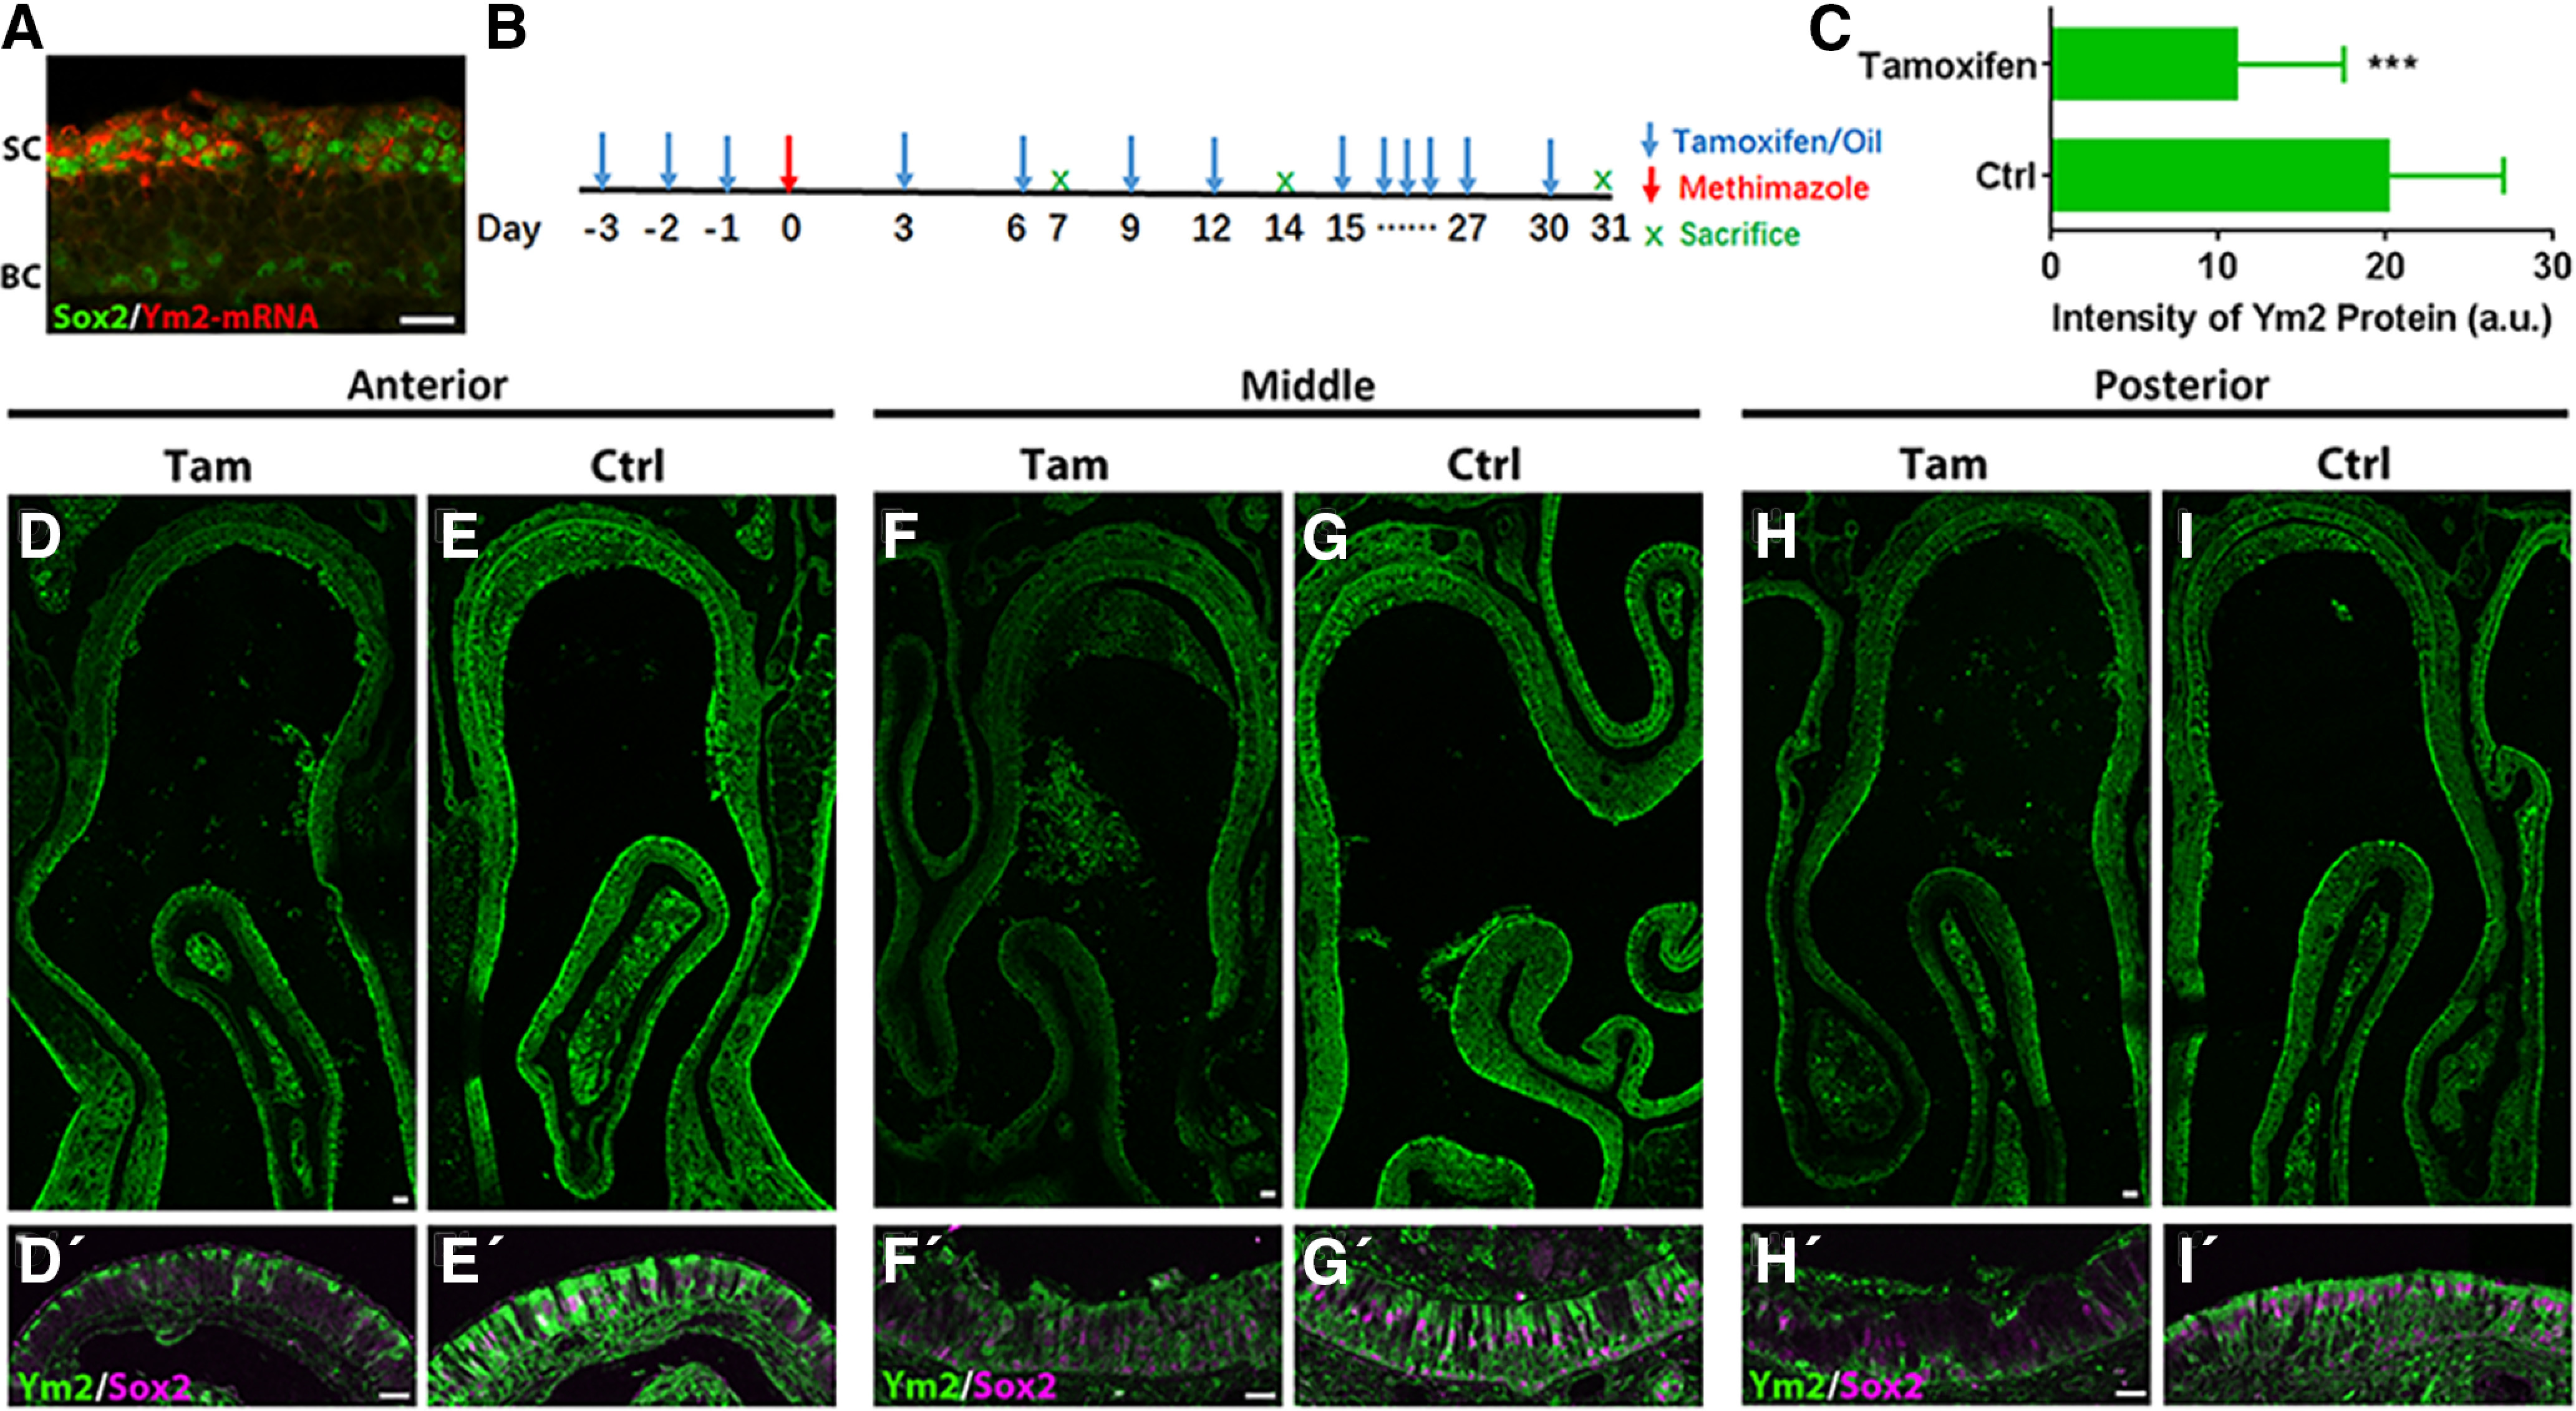
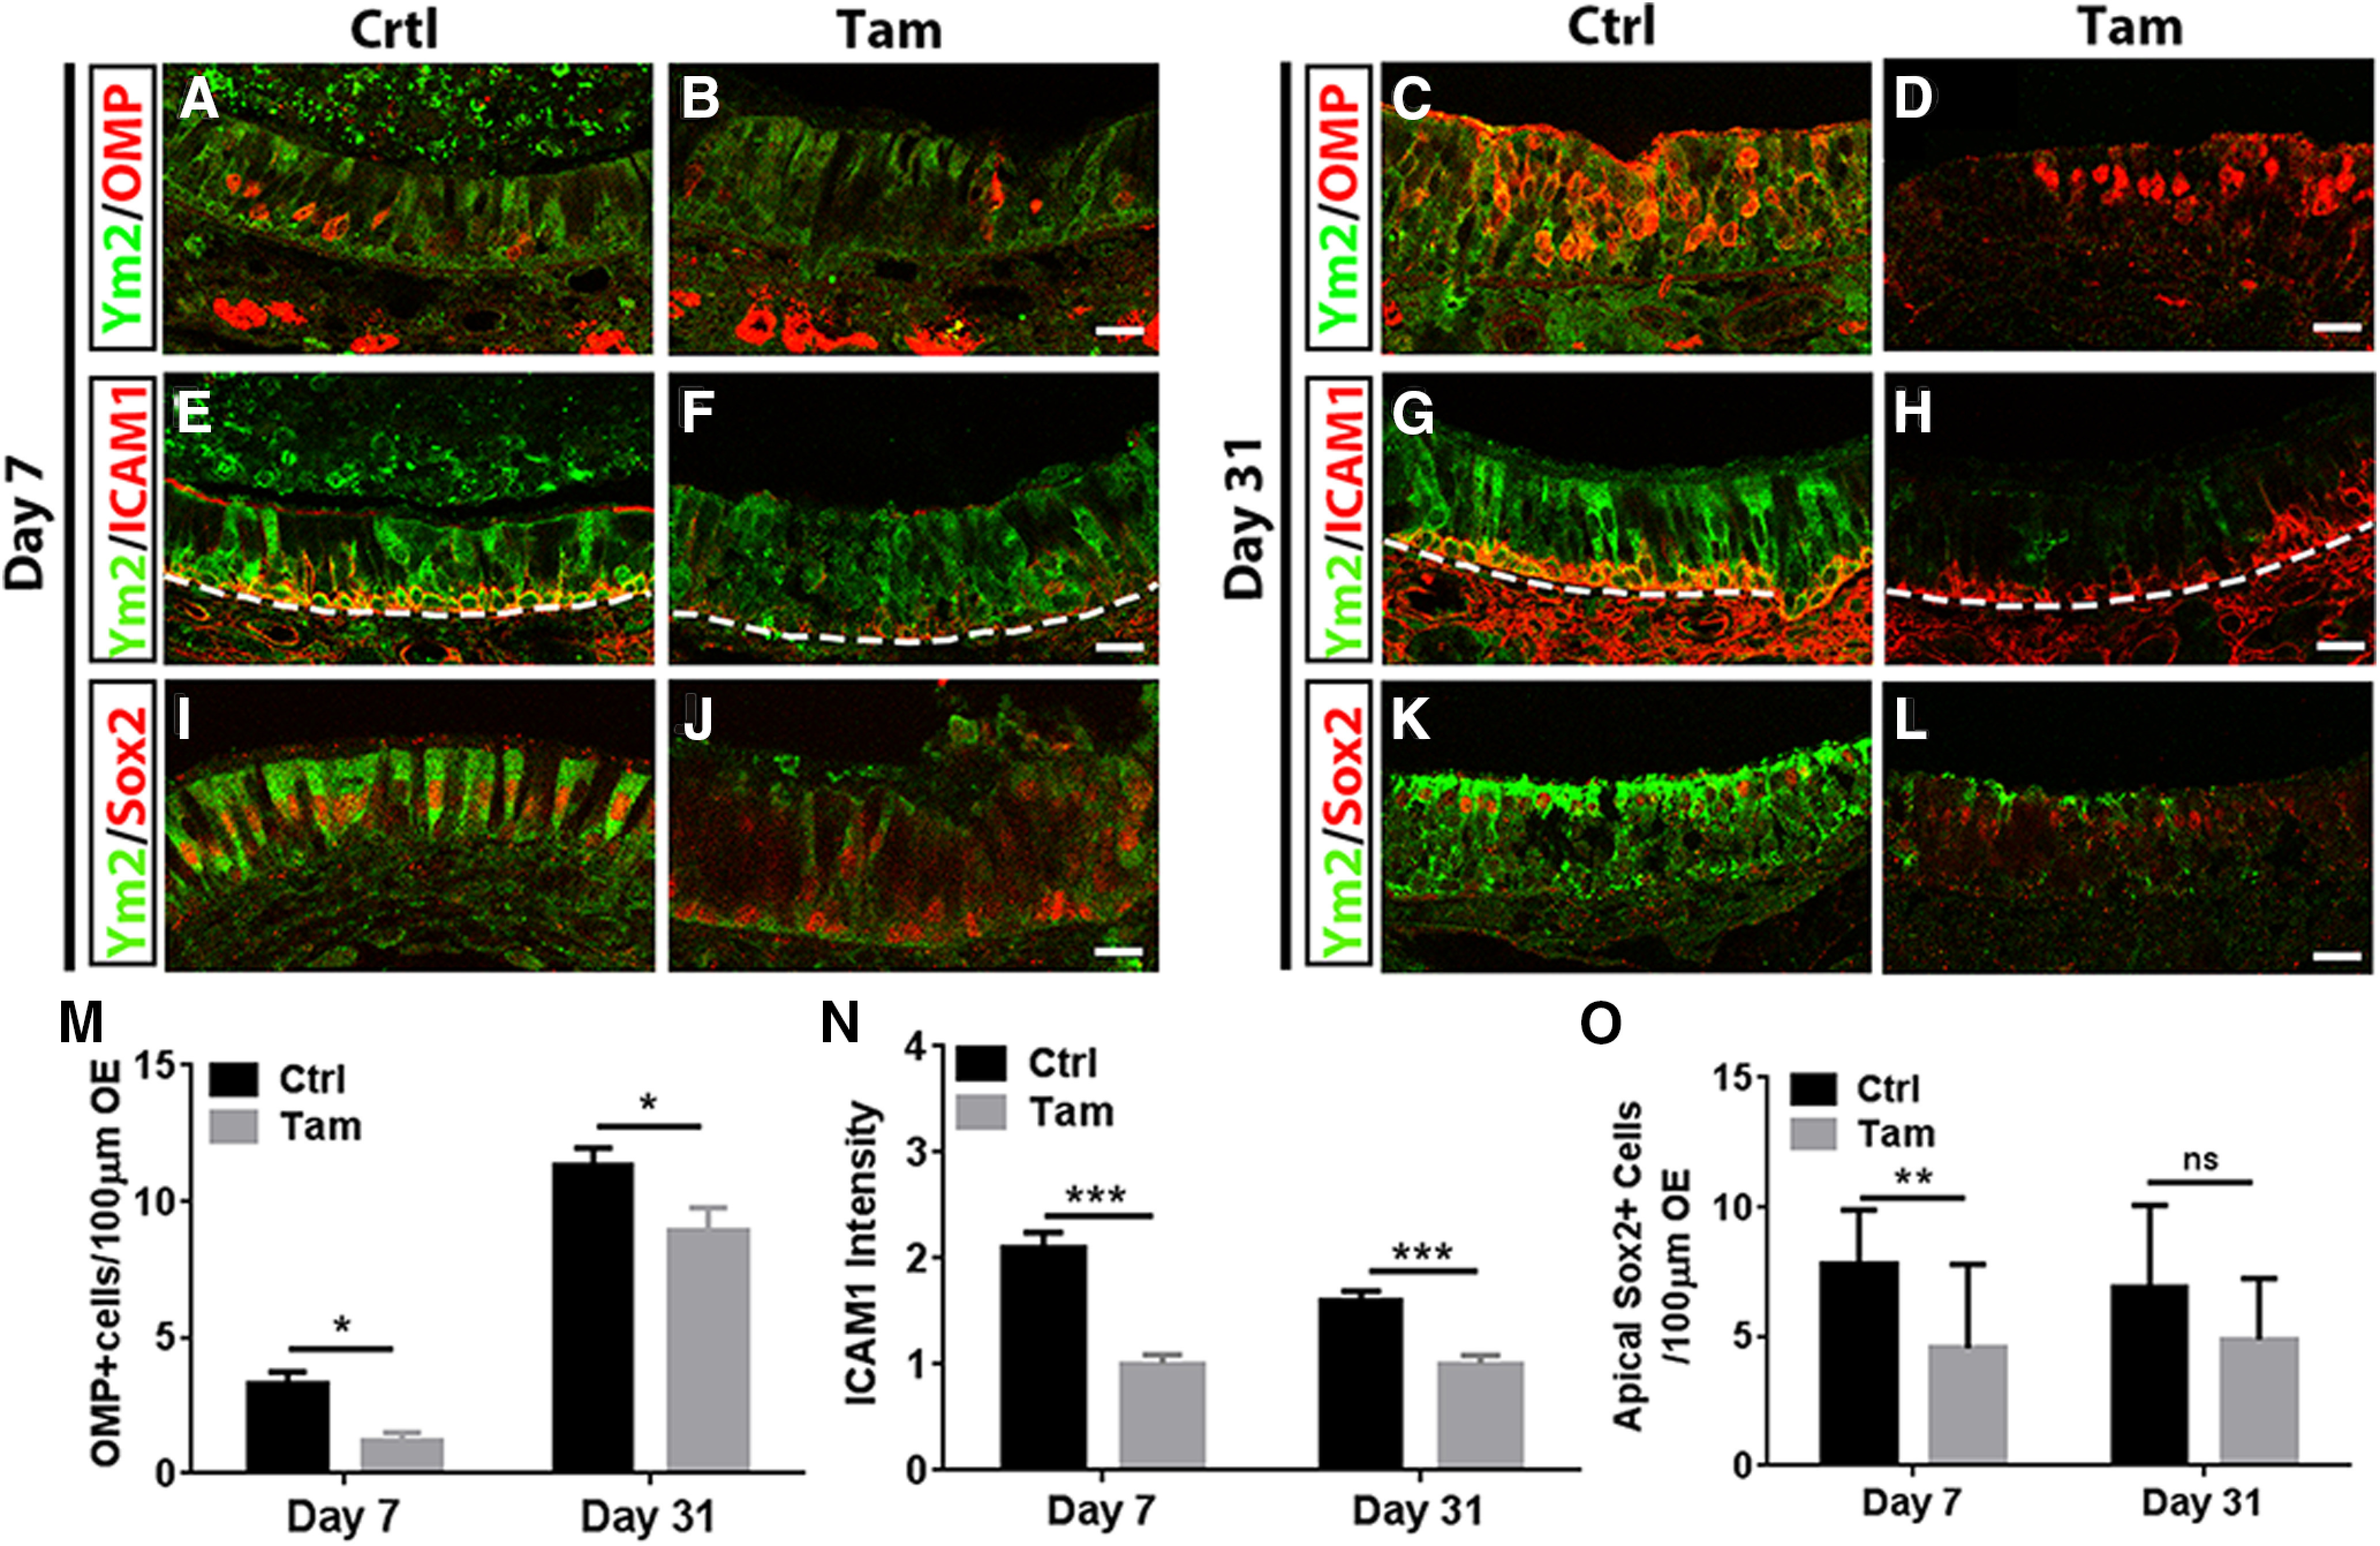
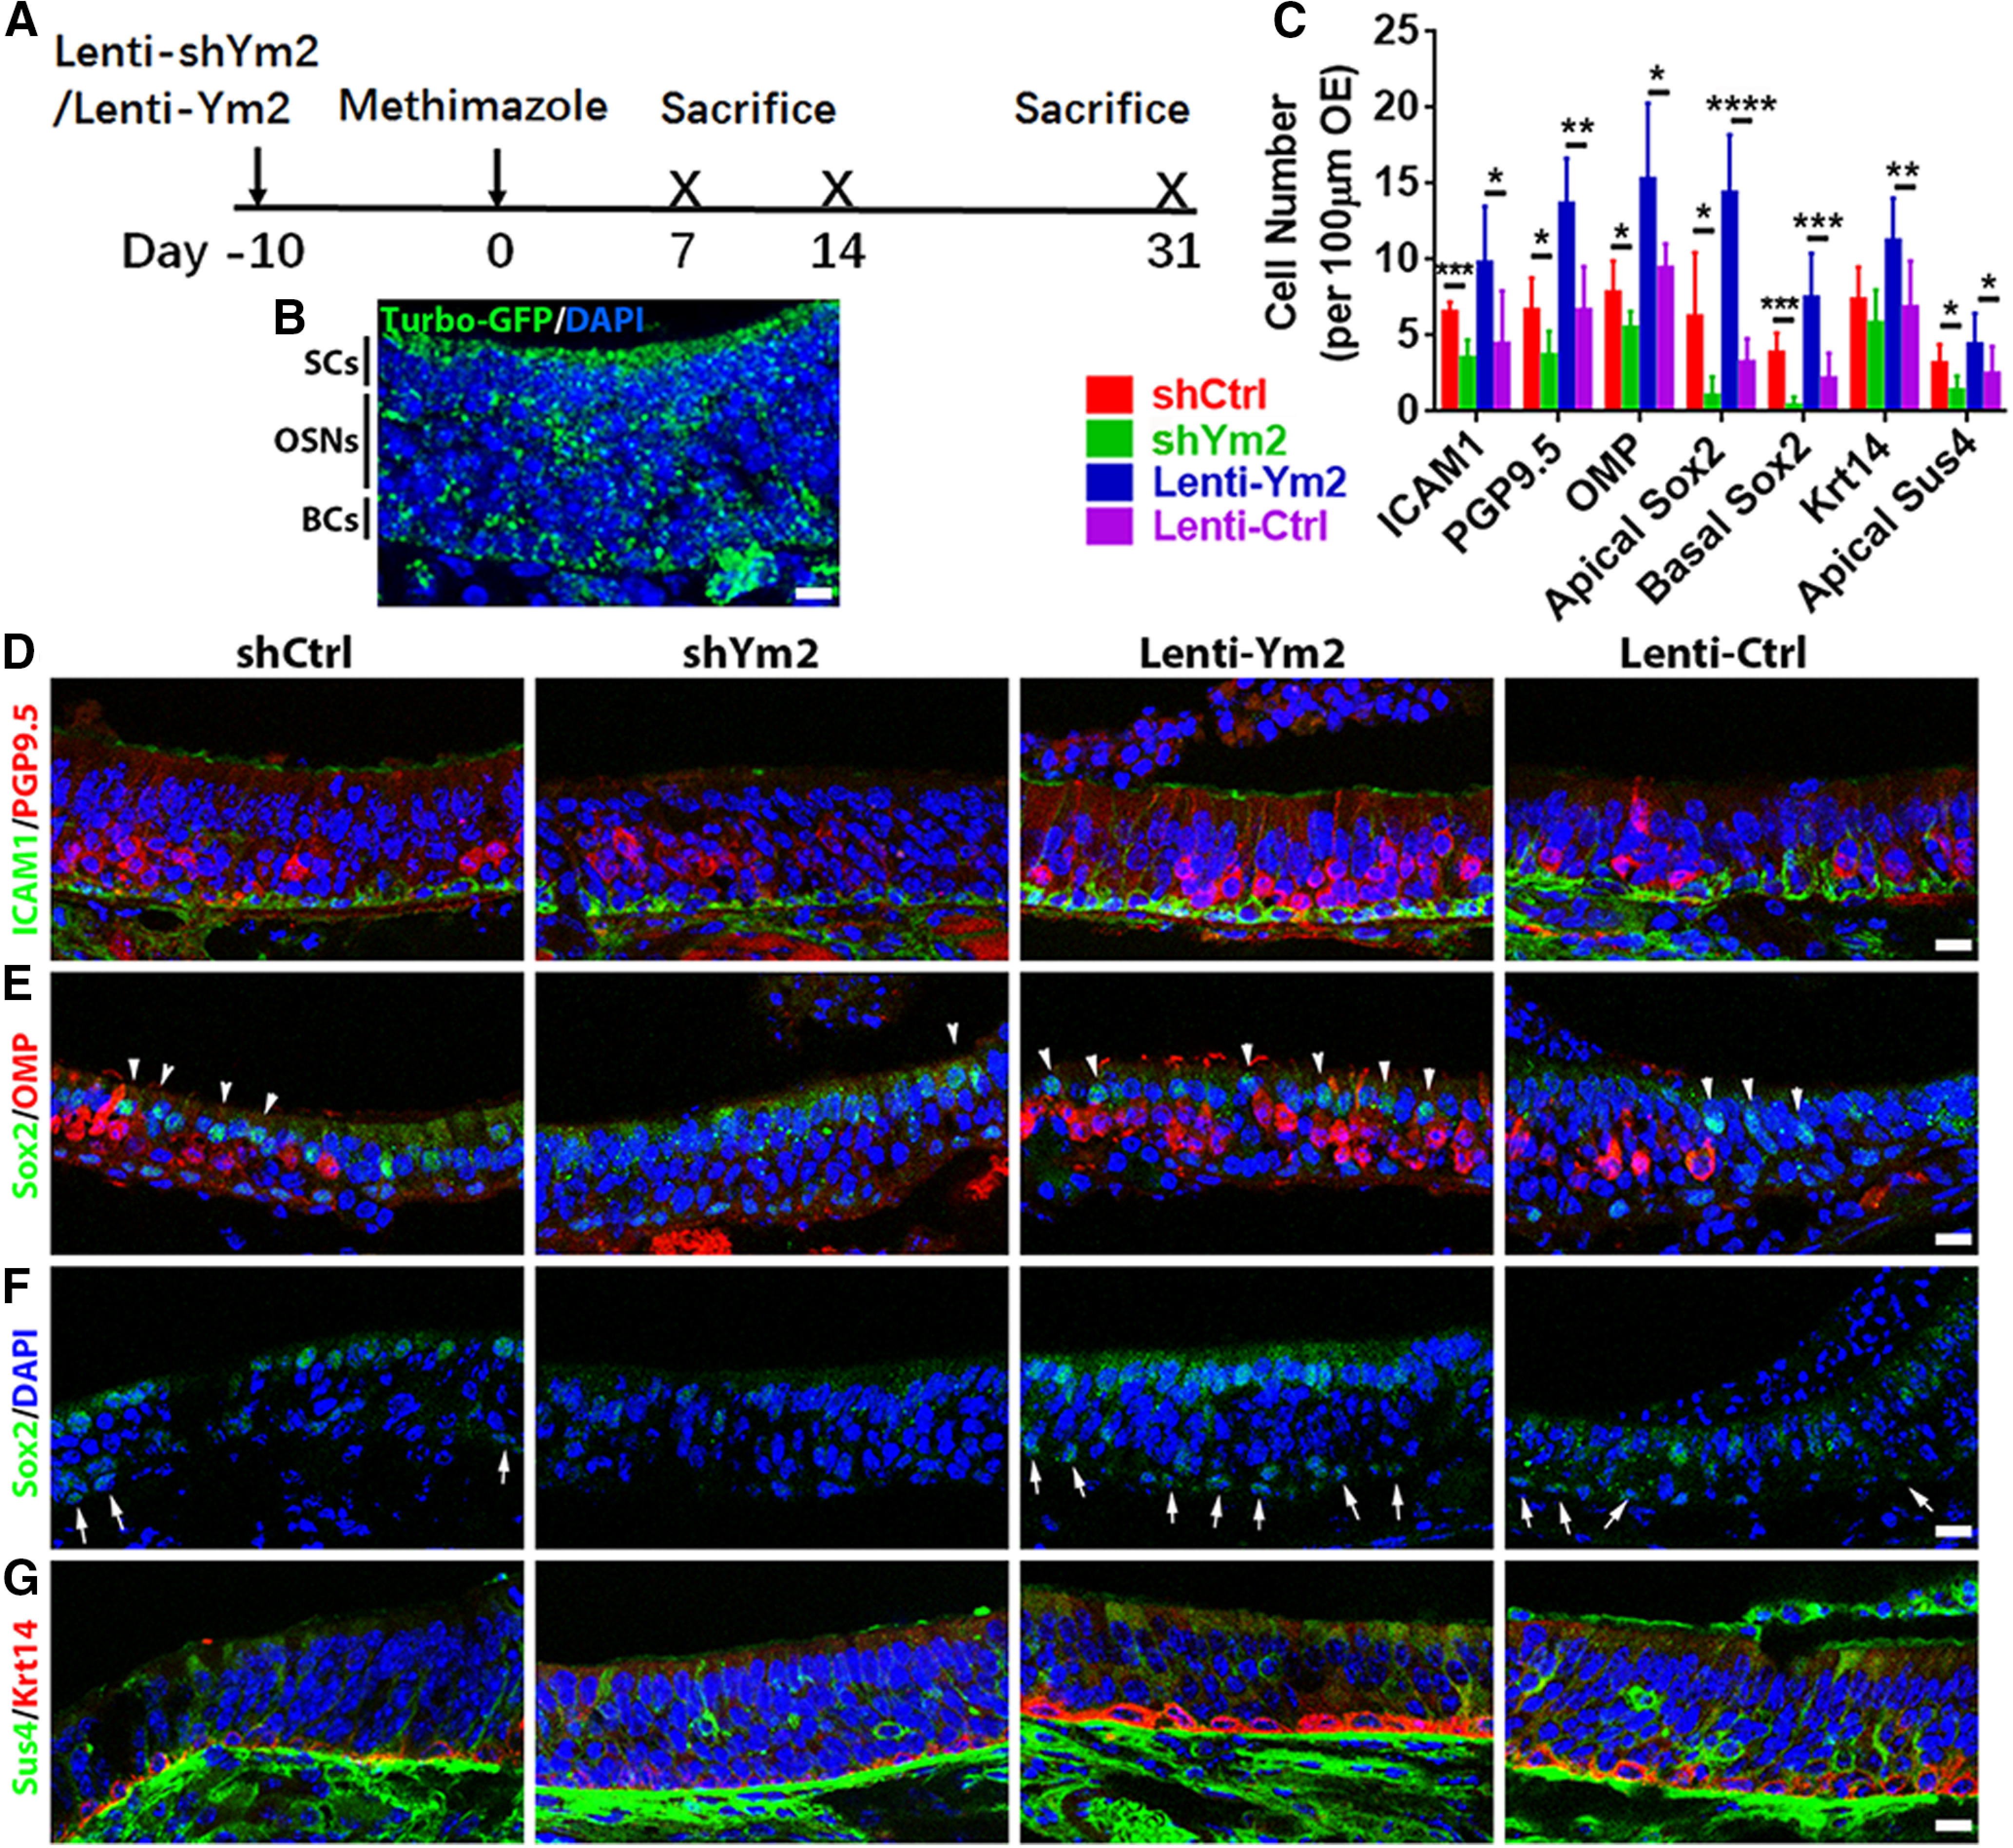
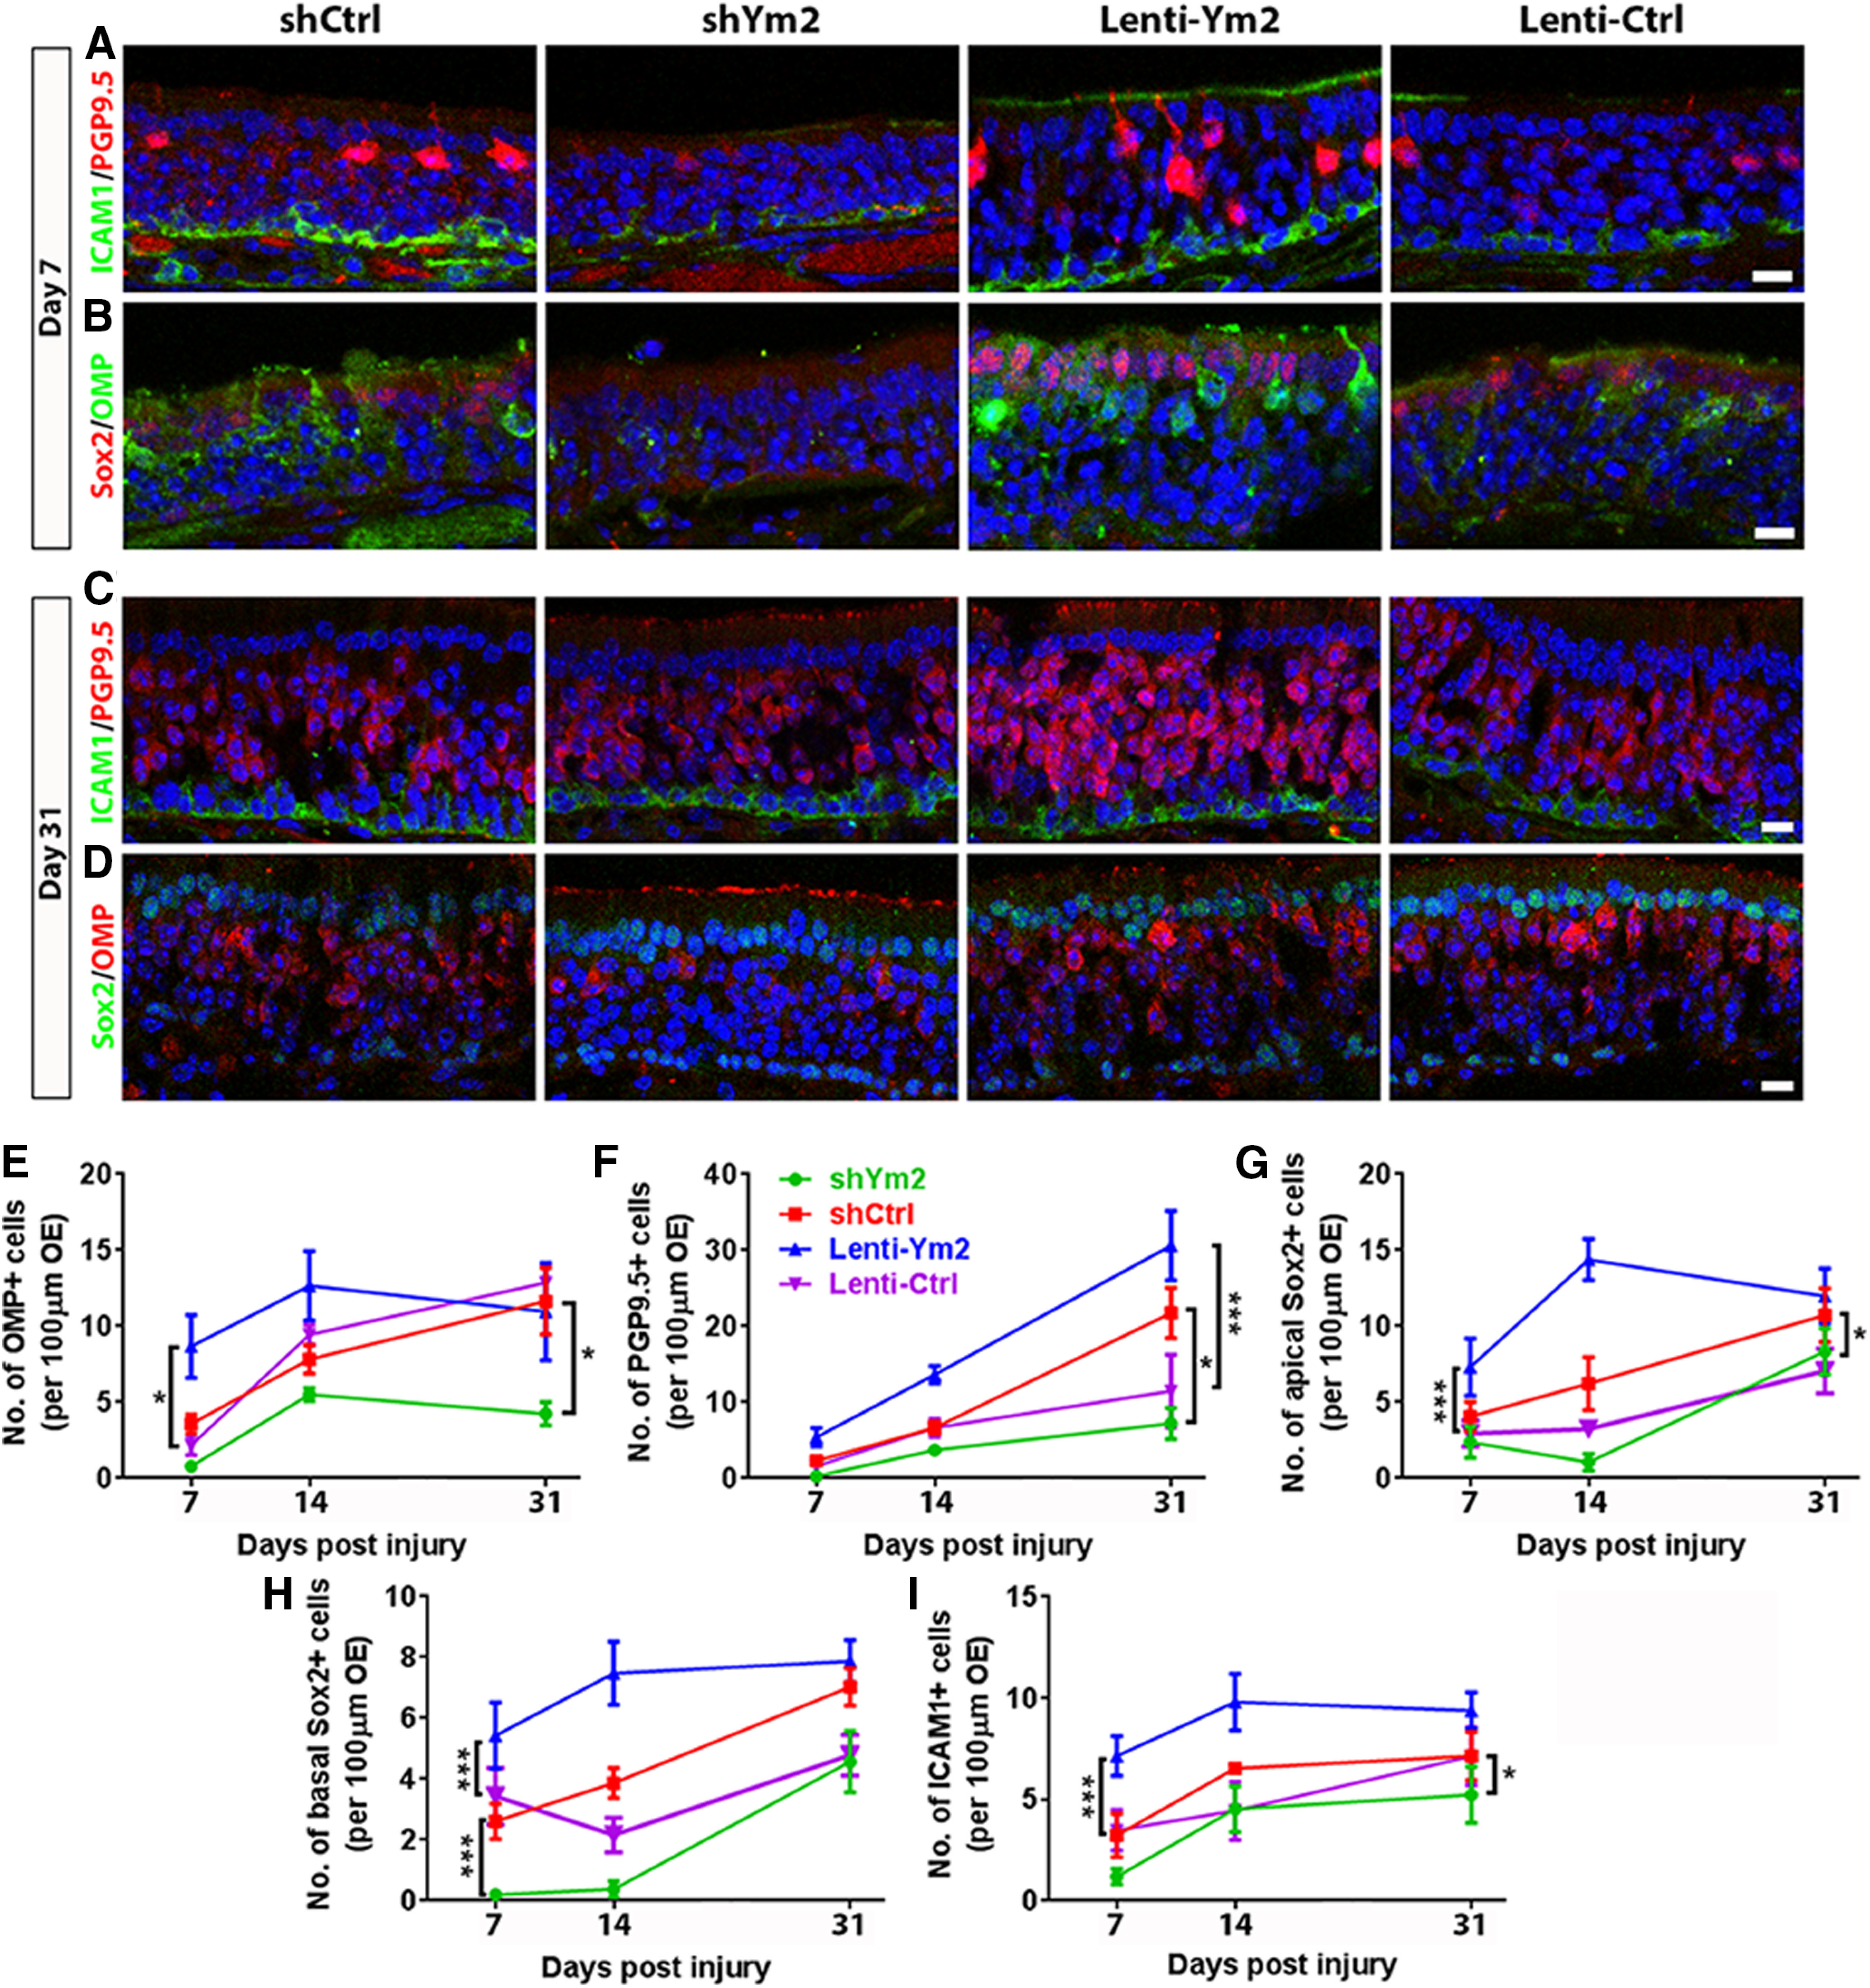
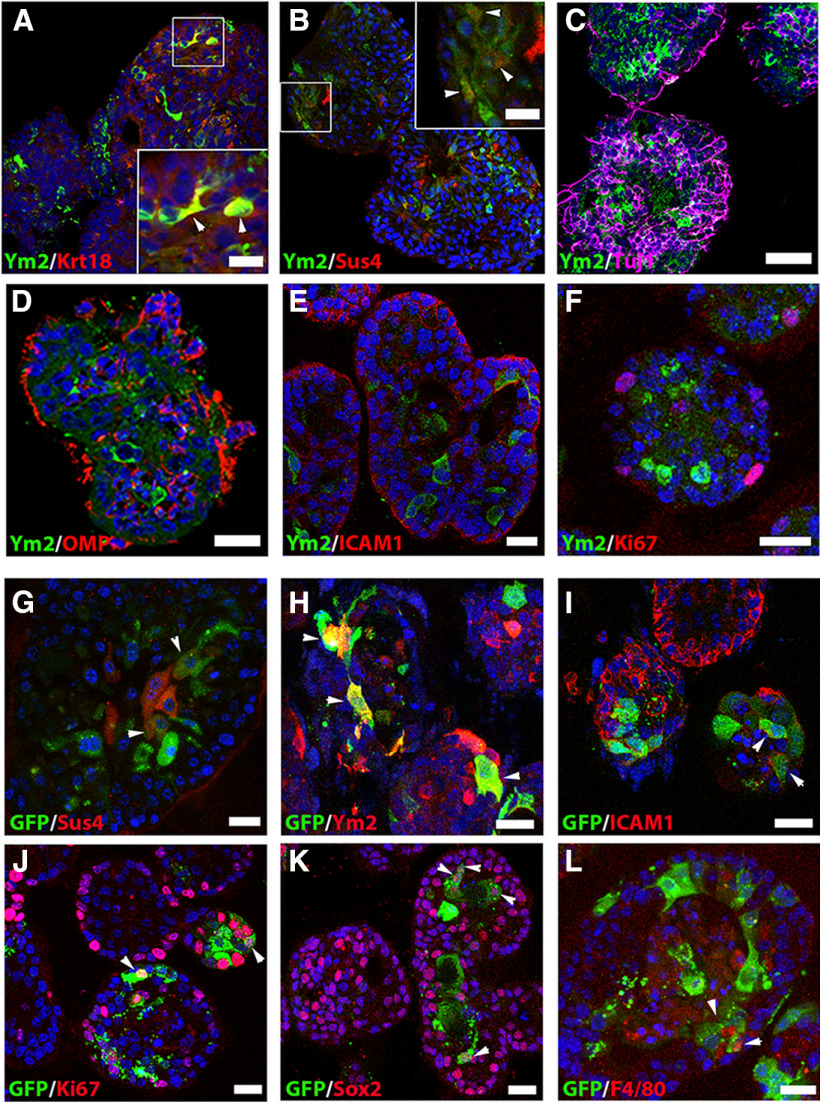
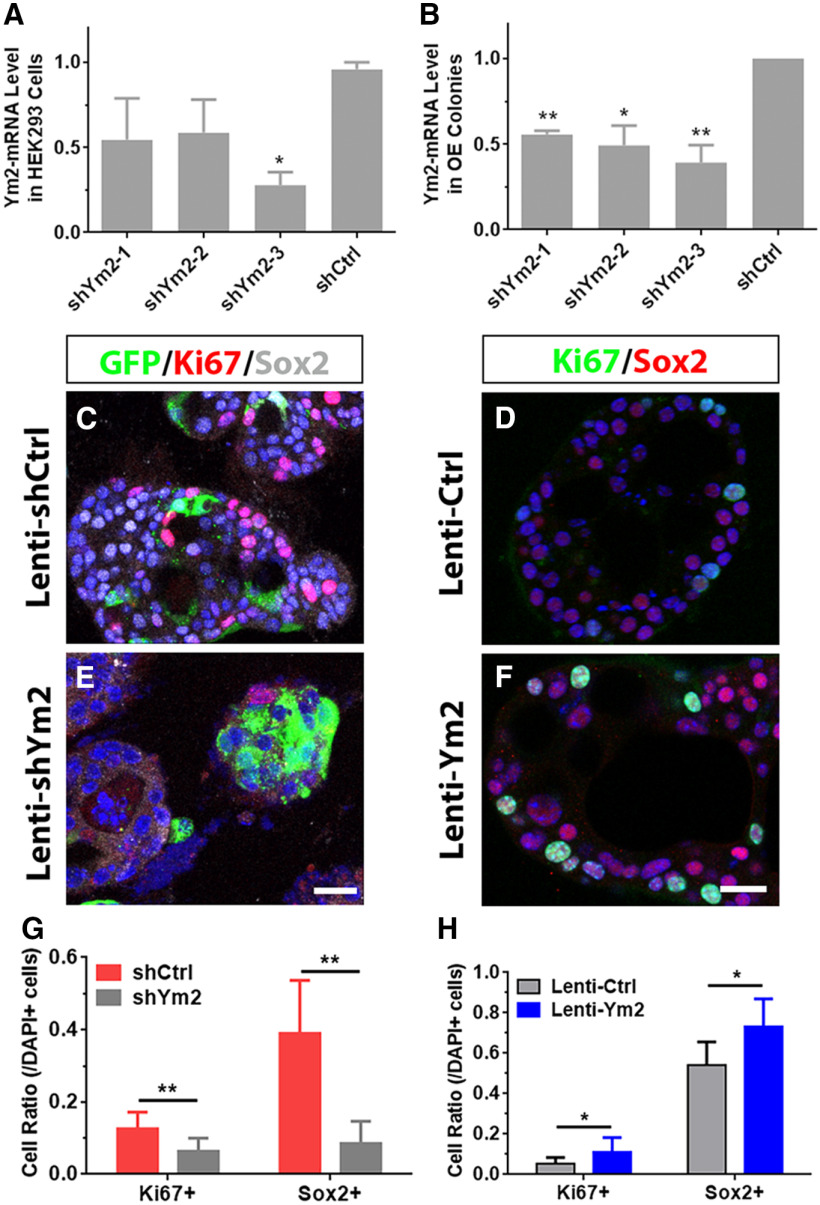
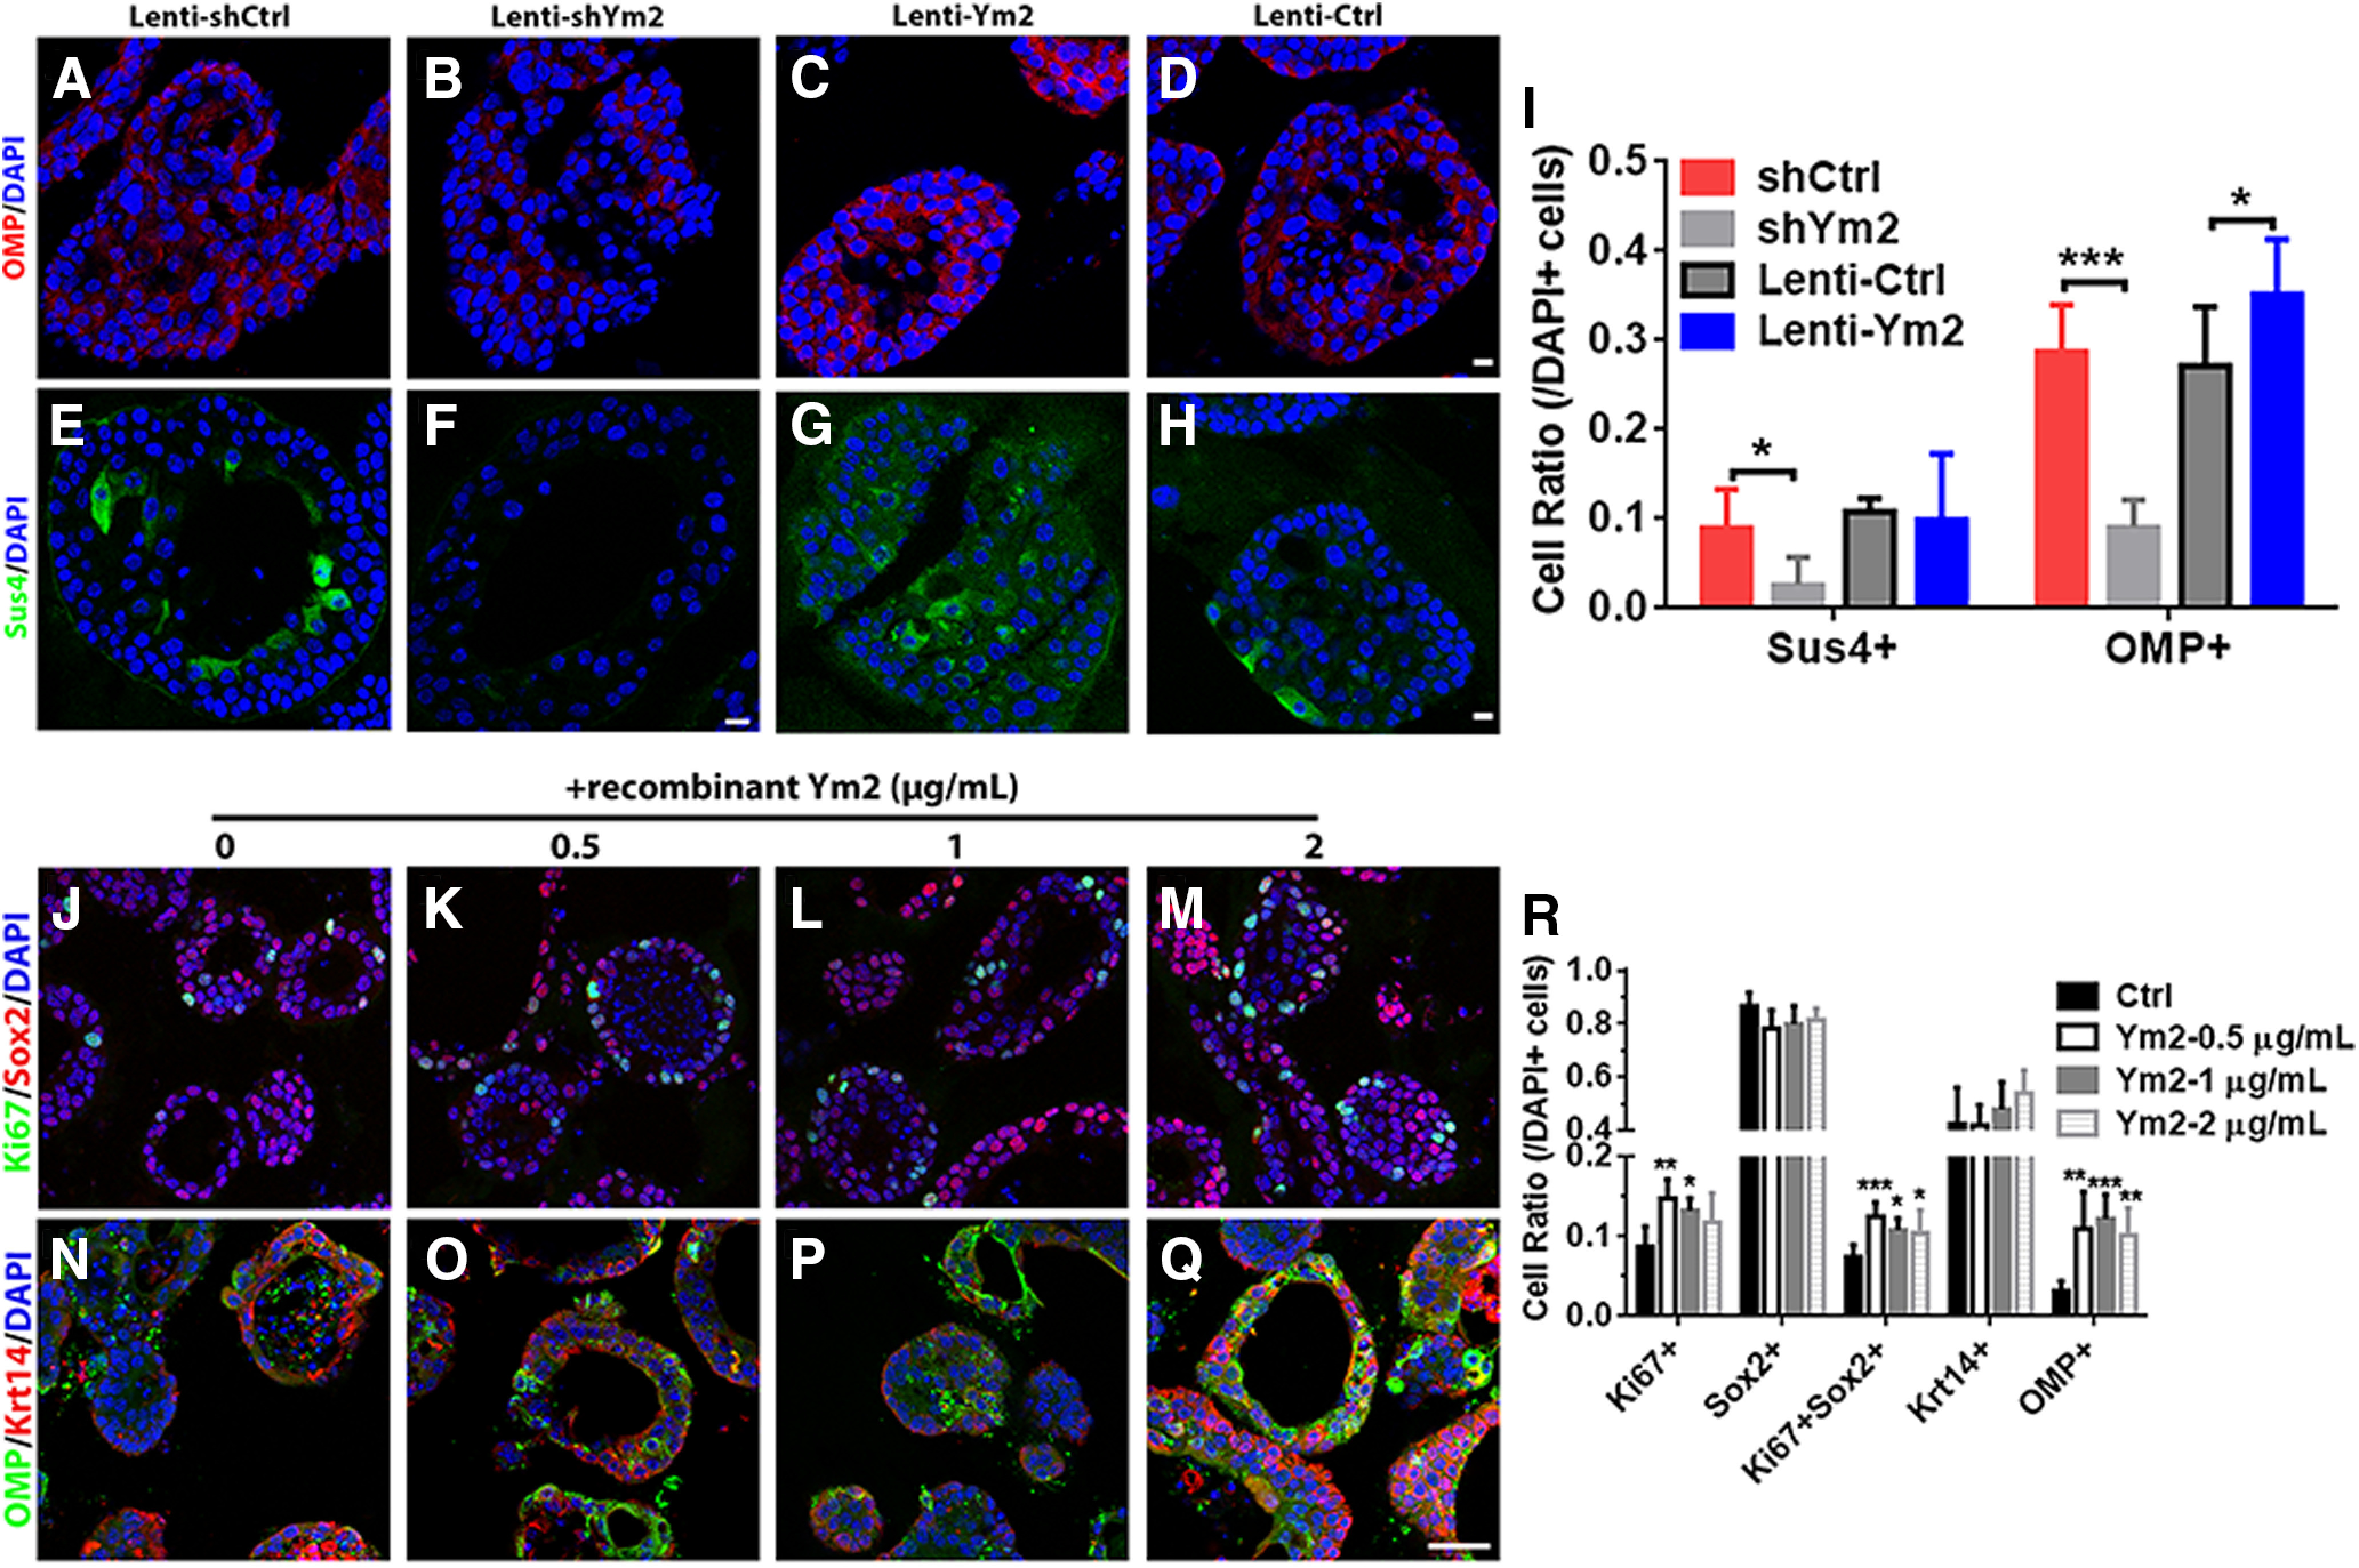
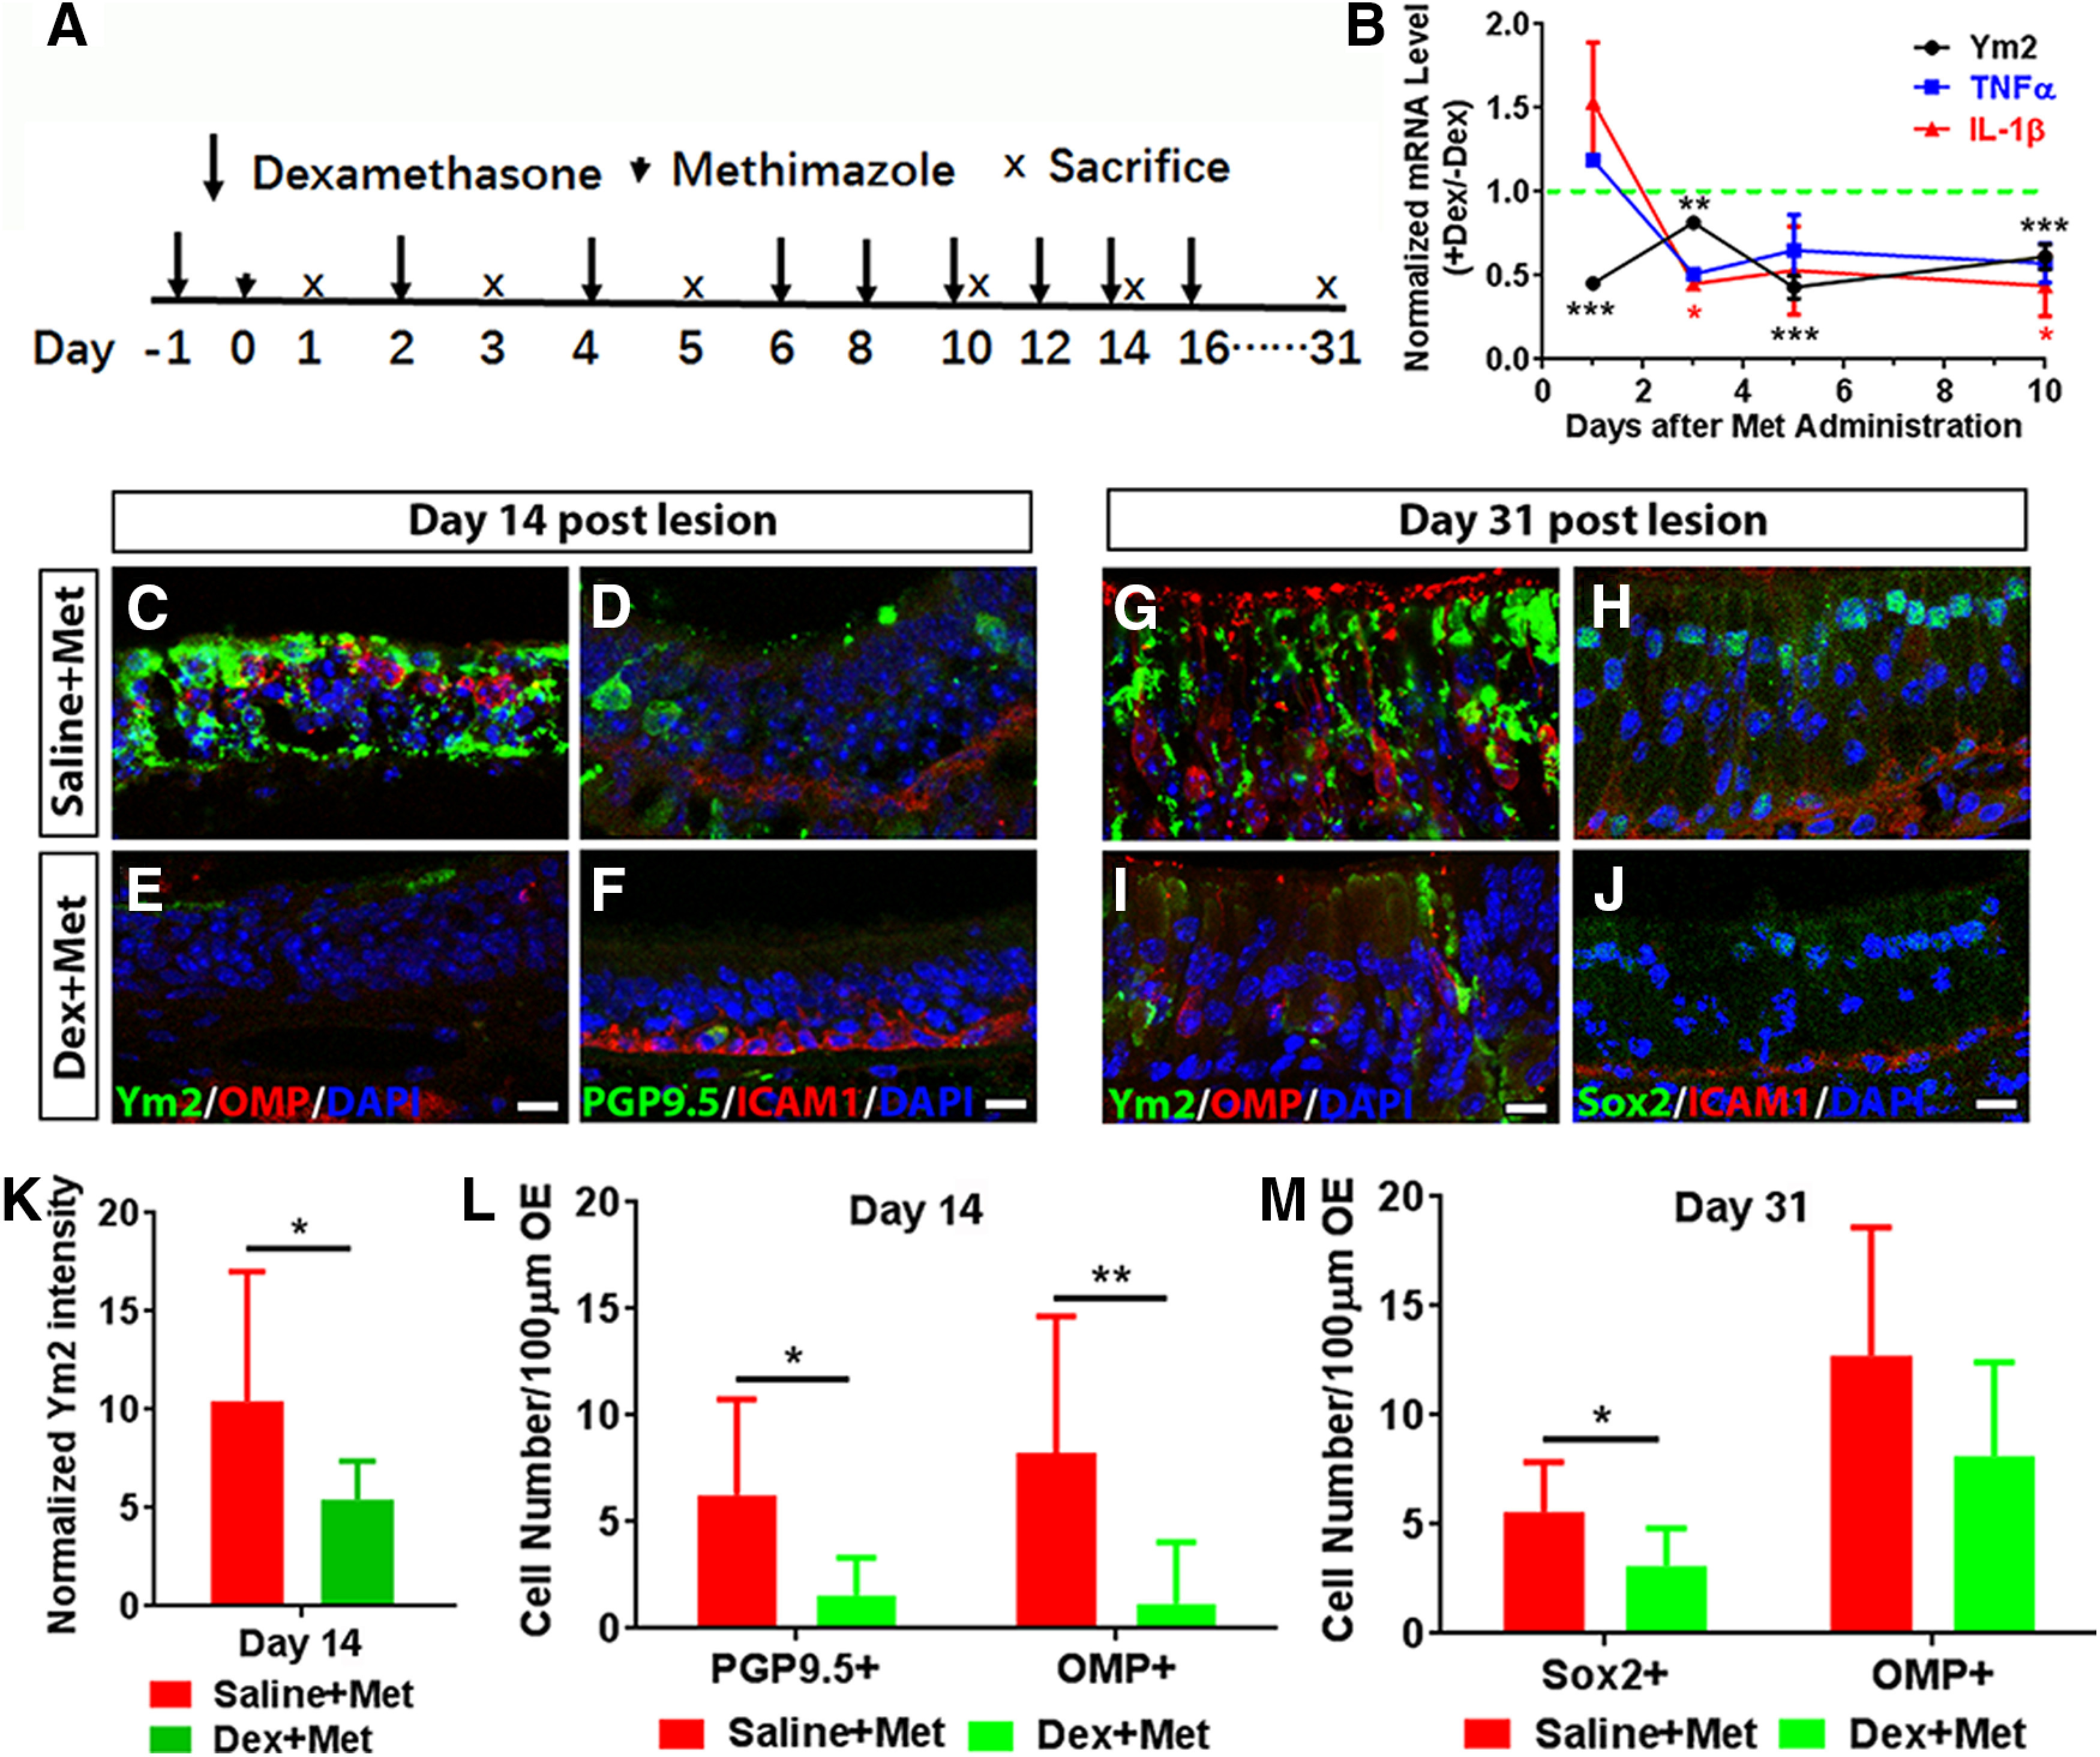
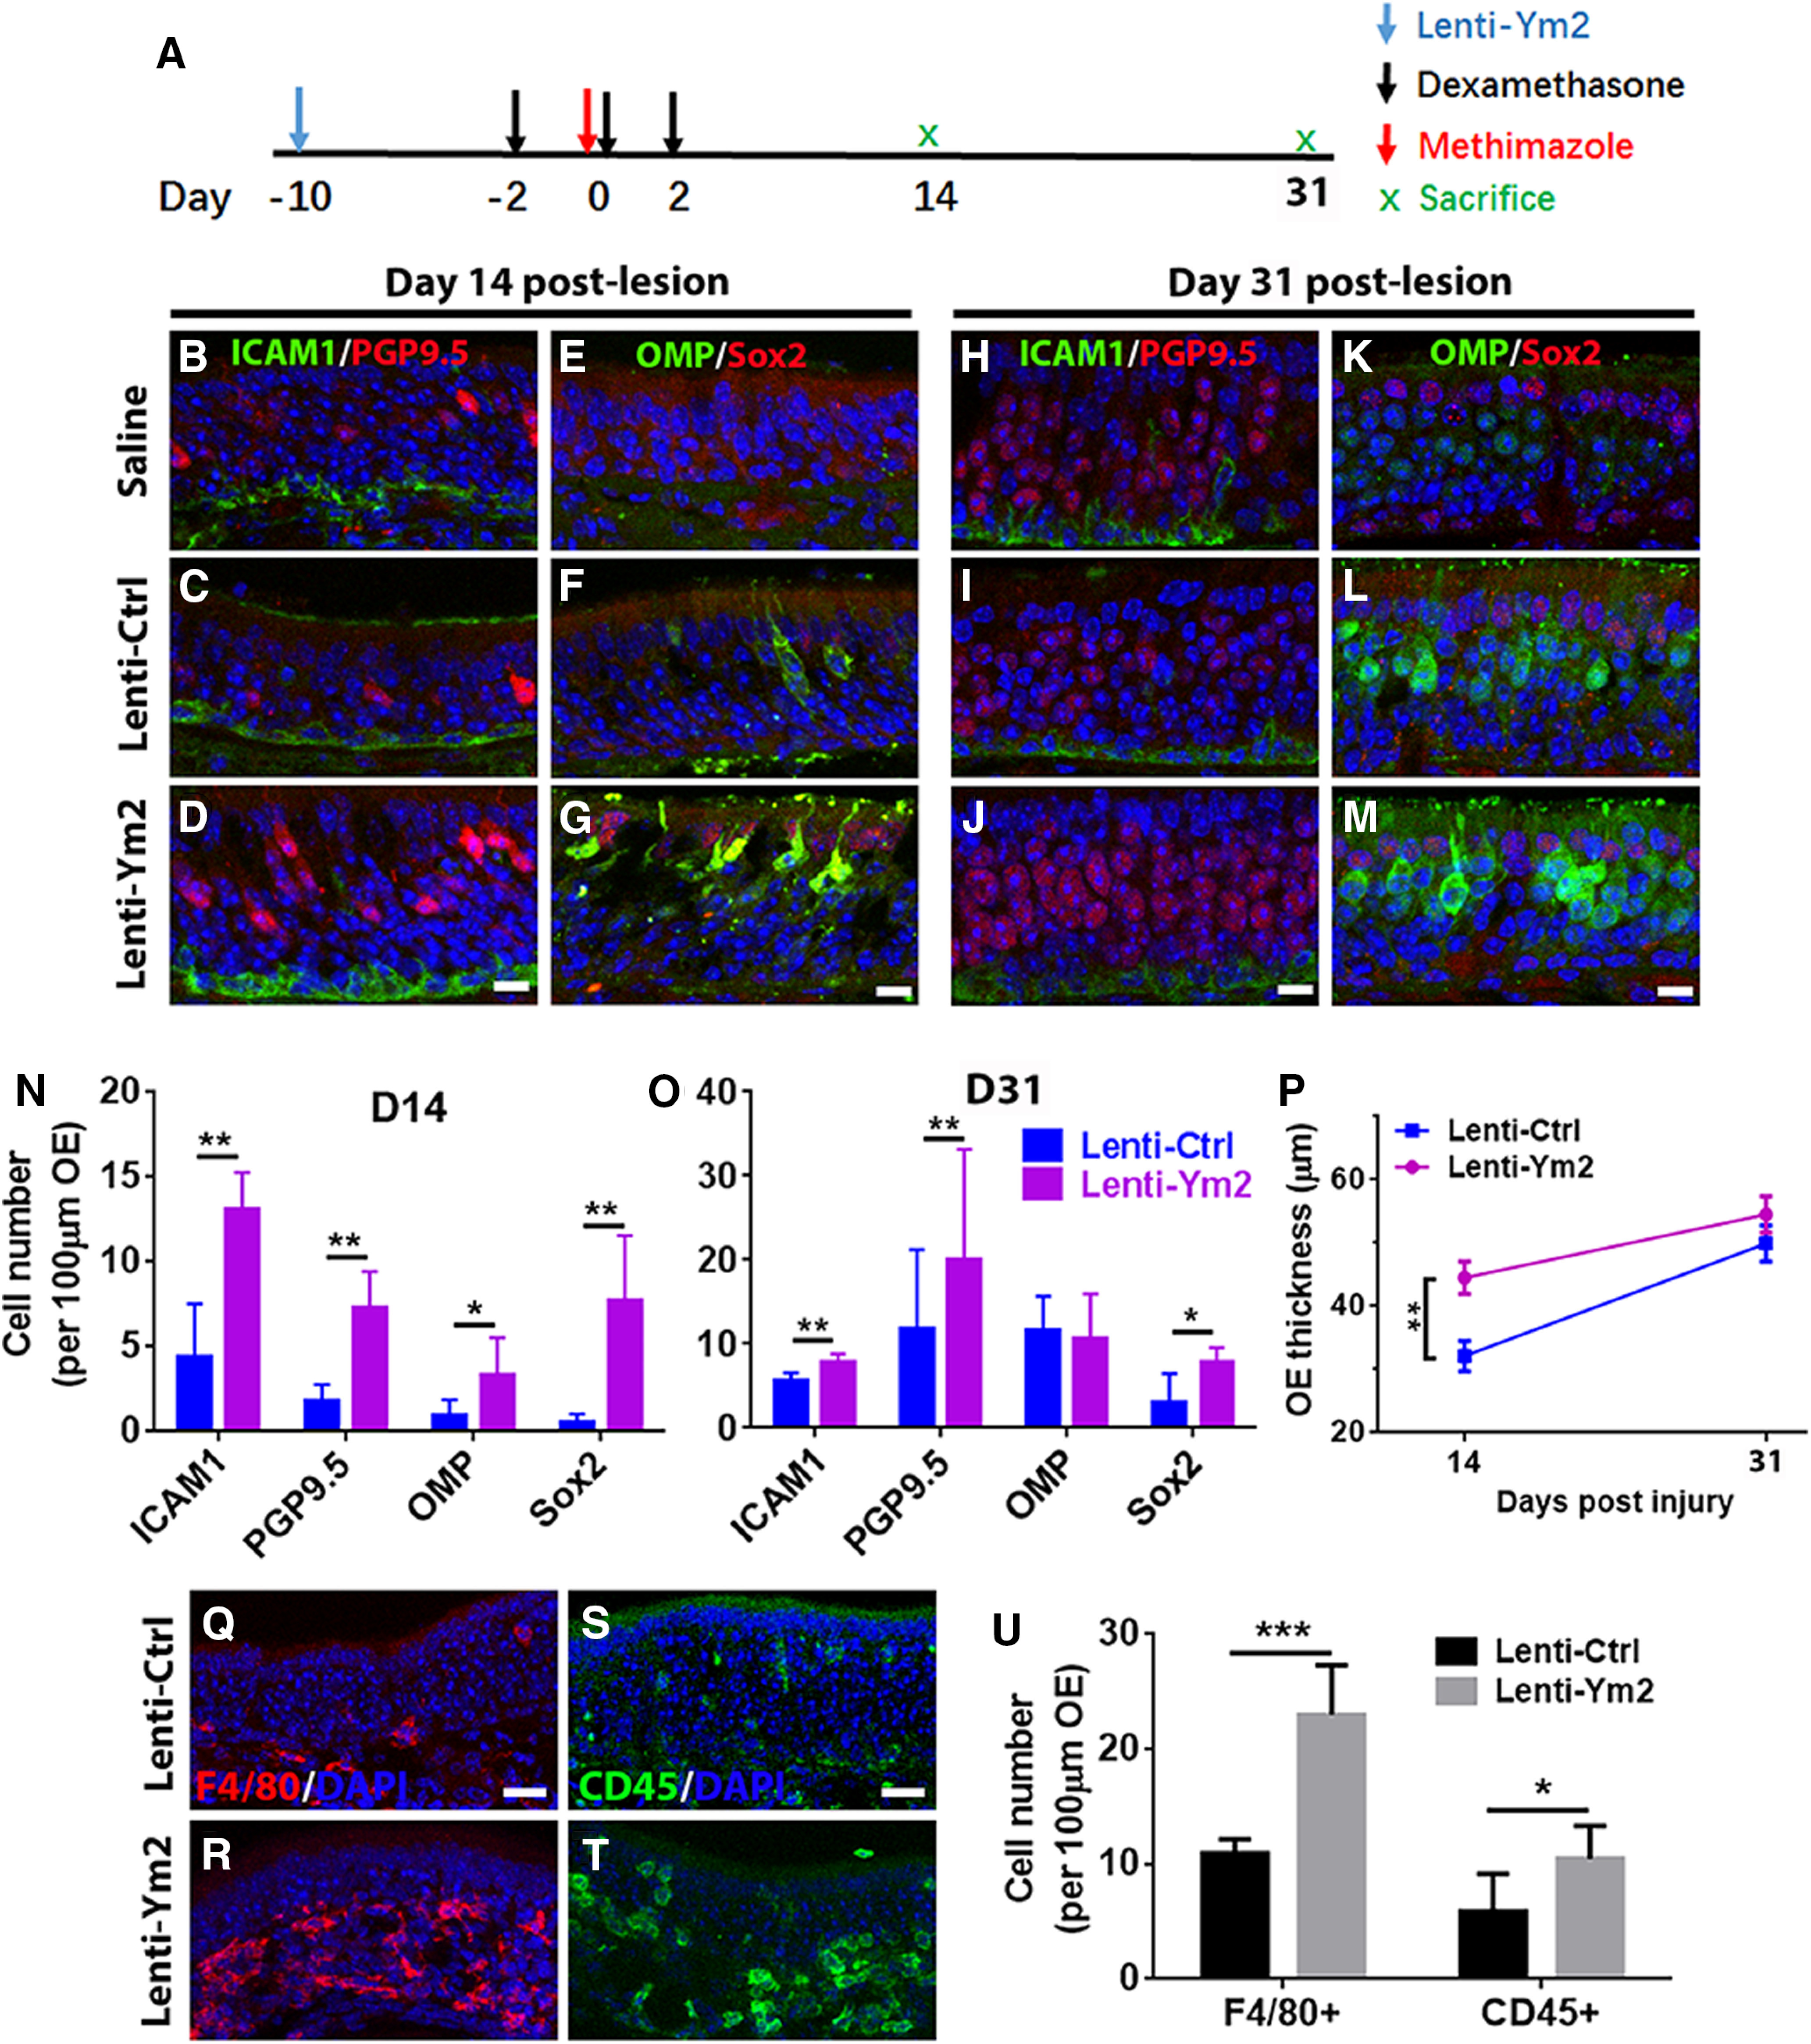
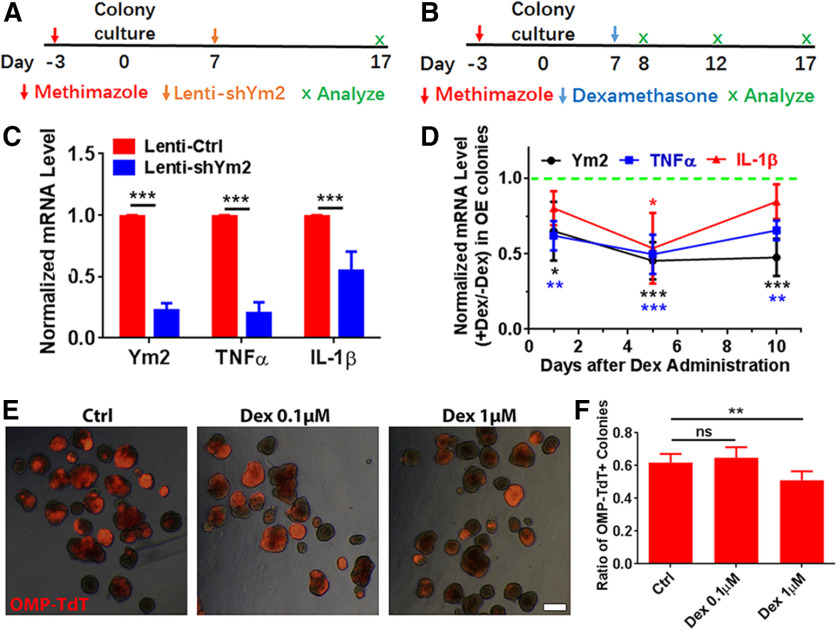
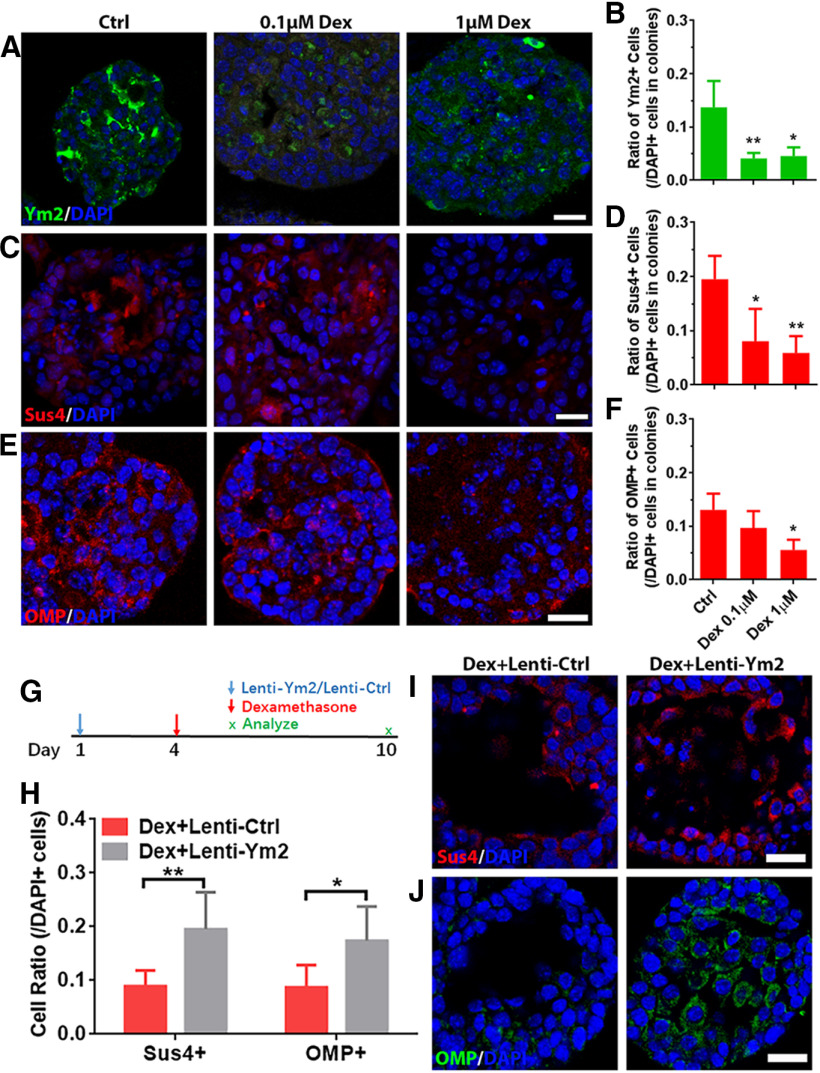
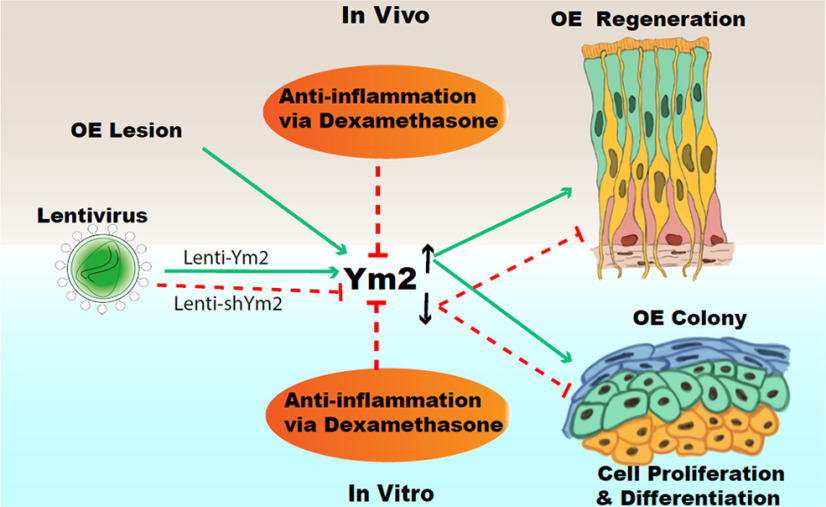
The adult olfactory epithelium (OE) regenerates sensory neurons and nonsensory supporting cells from resident stem cells after injury. How supporting cells contribute to OE regeneration remains largely unknown. In this study, we elucidated a novel role of Ym2 (also known as Chil4 or Chi3l4), a chitinase-like protein expressed in supporting cells, in regulating regeneration of the injured OE in vivo in both male and female mice and cell proliferation/differentiation in OE colonies in vitro We found that Ym2 expression was enhanced in supporting cells after OE injury. Genetic knockdown of Ym2 in supporting cells attenuated recovery of the injured OE, while Ym2 overexpression by lentiviral infection accelerated OE regeneration. Similarly, Ym2 bidirectionally regulated cell proliferation and differentiation in OE colonies. Furthermore, anti-inflammatory treatment reduced Ym2 expression and delayed OE regeneration in vivo and cell proliferation/differentiation in vitro, which were counteracted by Ym2 overexpression. Collectively, this study revealed a novel role of Ym2 in OE regeneration and cell proliferation/differentiation of OE colonies via interaction with inflammatory responses, providing new clues to the function of supporting cells in these processes.SIGNIFICANCE STATEMENT The mammalian olfactory epithelium (OE) is a unique neural tissue that regenerates sensory neurons and nonsensory supporting cells throughout life and postinjury. How supporting cells contribute to this process is not entirely understood. Here we report that OE injury causes upregulation of a chitinase-like protein, Ym2, in supporting cells, which facilitates OE regeneration. Moreover, anti-inflammatory treatment reduces Ym2 expression and delays OE regeneration, which are counteracted by Ym2 overexpression. This study reveals an important role of supporting cells in OE regeneration and provides a critical link between Ym2 and inflammation in this process.

Keywords: Ym2; chitinase-like protein; inflammation; olfactory epithelium; regeneration; supporting cell.


Figures

Figure 1.
Figure 1.
Ym2 is highly expressed on the open side of naris-occluded mice. A, Coomassie Brilliant Blue staining on an SDS-PAGE gel revealed a protein at ∼38 kDa (arrows) with the greatest difference between the closed and open sides. Tissues were collected from three mice that underwent unilateral naris closure from P1 to P30. S, Septum; T, turbinates. B, Mass spectrometric analysis revealed that the protein was most likely to be Ym2 with the highest emPAI (exponentially modified protein abundance index). Ym1 had the second highest emPAI (but much lower than Ym2), presumably because of its high sequence homology with Ym2. C, Higher Ym2 expression was observed in the open side. Arrowheads denote Ym2 antibody staining in the supporting cell layer and asterisks denote the lamina propria. D, Schematic of the OE containing multiple cell types with biomarkers in parentheses. E–H, Immunostaining and FISH indicated Ym2 was abundant in the supporting cell layer in the open side (F, H) compared with the closed side (E, G). I, J, Statistical analysis of Ym2 protein and mRNA intensity in the closed and open side (n = 9 and 10 sections, respectively, from three mice; arbitrary unit). K–M, Immunostaining against Ym2 and Ki67 in the OE of the open side of naris-occluded mice (K, L) and untreated control mice (M). Arrowheads mark Ki67+ cells. N, Statistical analysis of the number of Ym2+ and Ki67+ cells per 100 μm OE (n = 10 and 11 sections in control and open side from three mice in each condition). Because of the patchy expression of Ym2 in the open-side OE, the most densely labeled regions under the two conditions were captured and compared. Statistical significance was determined by unpaired Student's t test. I: **p = 0.009 (t(17) = 2.986); J: *p = 0.046 (t(17) = 2.524); N: ***p < 0.001; Ki67+: t(19) = 5.537; Ym2+: t(19) = 5.808. Scale bars: C, 0.5 mm; H, K–M, 20 μm.
Figure 2.
Figure 2.
Ym2 is highly abundant in the lesioned OE. A–F, Immunostaining revealed that Ym2 protein was upregulated in methimazole-lesioned OE on day 10 (B, E) and day 30 (C, F) compared with the unlesioned OE (saline injection; A, D). G–I, FISH analysis revealed higher Ym2-mRNA expression in the lesioned OE on day 10 (H) and day 30 (I) compared with the unlesioned control (G). J–L, Statistical analysis of the percentage of Ym2+/Sox2+ cells (J; n = 4, 10, and 9 sections from three mice in each group), immunostaining signal intensity (K; n = 5, 10, and 14 sections), and FISH signal intensity (L; n = 6, 12, and 20 sections). M, Statistical analysis of the total intensity of immunostaining against Ym2 in unlesioned and lesioned OE (months 1, 2, and 3 postinjury; n = 5, 6, 6, and 5 sections from three mice in each group). a.u., arbitrary unit. N, Concentration of Ym2 in the nasal lavage from methimazole-treated (30 d postinjection) and age-matched unlesioned mice (n = 3 mice in each condition). Statistical significance was determined by one-way ANOVA with Dunnett's multiple-comparisons test (J–M) and by unpaired t test (N). ns, Not significant. J: F(2,20) = 16.21, p < 0.0001; K: F(2,26) = 5.764, p = 0.0085; L: F(2,35) = 4.902, p = 0.0133; M: F(3,18) = 8.456, p = 0.0016; N: *p = 0.022 (t(4) = 2.268). Asterisks indicated the significance when compared with the unlesioned group. The rectangles in A–C are enlarged in D–F. Arrowheads in D–F point to Sox2+/Ym2+ cells. The unit of Ym2-protein and Ym2-mRNA intensity in K, L, and M is arbitrary. The dashed lines in G–I mark the OE borders. Met, methimazole. Scale bars: A–C, 100 μm; F, I, 20 μm.
Figure 3.
Figure 3.
Ym2 knockdown in Sox2-CreERT2/Ym2fl/fl mice with tamoxifen induction. A, Confocal image of FISH against Ym2-mRNA and immunostaining against Sox2 on an OE section from a 3-week-old mouse. B, Scheme of tamoxifen-induced Ym2 knockdown in methimazole-lesioned OE. Repeated tamoxifen injections ensure Ym2 knockdown in continuously generated supporting cells. C, Statistical analysis on intensity of Ym2 antibody staining in the OE on day 7 post-methimazole injection (n = 20 and 17 sections from three control and tamoxifen-treated mice, respectively). a.u., Arbitrary units. D–I′, Confocal images of immunostaining against Ym2 and Sox2 in anterior (D, D′), middle (F, F′), and posterior (H, H′) regions with tamoxifen induction compared with the corresponding regions (anterior, E, E′; middle, G, G′; posterior, I, I′) in controls injected with sunflower oil (day 7 post-methimazole injection). Statistical significance was determined by unpaired Student's t test. C: ***p = 0.0002 (t(35) = 4.157). SC, Supporting cell; BC, basal cell; Tam, tamoxifen; Ctrl, control. Scale bars: D, F, H, 100 μm; A, D′, F′, H′, 20 μm.
Figure 4.
Figure 4.
Genetic downregulation of Ym2 attenuates regeneration in the lesioned OE. A–L, Immunostaining showed that Ym2 downregulation through tamoxifen (Tam) induction in Sox2-CreERT2/Ym2fl/fl mice decreased the percentage of OMP+ cells (A–D), ICAM1+ cells (E–H), and Sox2+ supporting cells in the OE (I–L) on day 7 and day 31 postinjury compared with oil-injected controls (Ctrl). M, Statistical analysis on the number of OMP+ cells per 100 µm OE on day 7 and day 31 postinjury in control and Ym2 downregulation groups (n = 26 sections from three mice in each group). N, Statistical analysis of the ICAM1 expression intensity on day 7 and day 31 postinjury (n = 12 sections in each group). O, Statistical analysis on the number of apical Sox2+ cells/100 μm OE (n = 15 and 22 sections on day 7 and day 31 postinjury). The dashed line in E–H separated OE from lamina propria. Statistical significance was determined by two-way ANOVA. M: F(1,100) = 24.45, p < 0.0001; N: F(1,44) = 48.70, p < 0.0001; O: F(1,70) =15.16, p = 0.0002. ns, Not significant. Asterisks were determined by Sidak's multiple-comparisons test. Scale bars, 20 μm.
Figure 5.
Figure 5.
Ym2 regulates the recovery of the lesioned OE. A, The timeline of lentiviral and methimazole administration. B, Confocal image of Lenti-shYm2-infected OE immunostained with anti-TurboGFP. C, Statistical analysis of ICAM1+, PGP9.5+, OMP+, apical Sox2+, basal Sox2+, Krt14+, and Sus4+ cells/100 µm OE in Lenti-shCtrl, Lenti-shYm2, Lenti-Ym2, and Lenti-Ctrl groups on day 14 postlesion (n = 9 sections from three mice in each group). D–G, Confocal images of ICAM1+ and PGP9.5+ (D), apical Sox2+ and OMP+ (E), basal Sox2+ (F), and Sus4+ and Krt14+ (G) cells in the OE on day 14 post-OE lesion from mice injected with Lenti-shCtrl, Lenti-shYm2, Lenti-Ym2, or Lenti-Ctrl. Apical and basal Sox2+ cells are denoted by arrowheads and arrows in E and F. Statistical significance was determined by unpaired Student's t test. ICAM1+: ***p = 0.0003 (t = 5.47) and *p = 0.022 (t = 2.664); PGP9.5+: *p = 0.018 (t = 2.769) and **p = 0.0013 (t = 4.261); OMP+: *p = 0.041 (t = 2.372) and *p = 0.027 (t = 2.781); apical Sox2+: *p = 0.028 (t = 2.605) and ****p < 0.0001 (t = 7.109); basal Sox2+: ***p = 0.0002 (t = 5.55) and ***p = 0.0003 (t = 4.631); Krt14+: p = 0.237 (t = 1.251) and **p = 0.008 (t = 3.05); apical Sus4+: *p = 0.02 (t = 2.742) and *p = 0.023 (t = 2.065). The degree of freedom for all t tests is 16. Scale bars, 10 μm.
Figure 6.
Figure 6.
Ym2 regulates regeneration in the lesioned OE. A–D, Confocal images of ICAM1+, PGP9.5+, OMP+, and Sox2+ cells in the lesioned OE from mice injected with Lenti-shCtrl, Lenti-shYm2, Lenti-Ym2, or Lenti-Ctrl on day 7 and day 31 postinjury. E–I, Statistical analysis on the number of OMP+, PGP9.5+, apical Sox2+, basal Sox2+, and ICAM1+ cells/100 µm OE of mice injected with Lenti-shYm2, Lenti-shCtrl, Lenti-Ym2, or Lenti-Ctrl on day 7, day 14, and day 31 postinjury (OMP: n = 6 sections from three mice in each group; PGP9.5: n = 5–7 sections; apical Sox2+: n = 5–7 sections; basal Sox2+: n = 5–9 sections; ICAM1+: 5–7 sections). Statistical significance was determined by unpaired Student's t test between Lenti-shCtrl and Lenti-shYm2 or between Lenti-Ym2 and Lenti-Ctrl at the same time points, or by two-way ANOVA at all three time points together. Statistical analysis shown in E–I was based on two-way ANOVA. E: F(3,60) = 12.10, p < 0.0001; F: F(3,56) = 16.49, p < 0.0001; G: F(3,59) = 17.9, p < 0.0001; H: F(3,65) = 22.36, p < 0.0001; I: F(3,57) = 12.21, p < 0.0001. Asterisks was determined by Tukey's multiple-comparisons test. Scale bars, 10 μm.
Figure 7.
Figure 7.
Presumptive supporting cells in OE colonies express Ym2, and lentiviral infection in OE colonies is not cell type specific. A–F, Confocal images of Ym2+ and CK18+ (A), Sus4+ (B), Tuj1+ (C), OMP+ (D), ICAM1+ (E), and Ki67+ (F) cells in OE colonies. G–L, Lentiviral-infected (GFP+) OE colonies were immunostained with Sus4 (G), Ym2 (H), ICAM1 (I), Ki67 (J), Sox2 (K), and F4/80 (L). Lenti-Ctrl was used in H; Lenti-shYm2 was used in G, and I–L. Arrowheads mark Ym2+/CK18+, and Ym2+/Sus4+ cells in A and B, and positively stained GFP+ cells in G–L. Scale bars: C–L, 20 μm; A, B, 10 μm.
Figure 8.
Figure 8.
Ym2 regulates cell proliferation of OE colonies. A, B, Quantitative PCR analysis showed the efficiency of Lenti-shYm2 of downregulating Ym2-mRNA expression in Ym2-overexpressed HEK293 cells or OE colonies (n = 3 independent experiments). shYm2-1, shYm2-2, and shYm2-3 were lentiviruses targeting three different parts of the Ym2 sequence. C–F, Confocal images of Ki67+ or Sox2+ cells in Lenti-shCtrl-, Lenti-shYm2-, Lenti-Ctrl-, or Lenti-Ym2-infected OE colonies. G, H, Statistical analysis of the percentage of Ki67+ and Sox2+ cells in OE colonies with Lenti-shCtrl, Lenti-shYm2, Lenti-Ctrl, or Lenti-Ym2 infection (n = 12, 12, 6, and 6 sections from three independent cultures, respectively). Statistical significance in A and B was determined by unpaired t test. A: *p = 0.0156, t(4) = 7.923; B: **p = 0.0013, t(4) = 27.93; *p = 0.0247, t(4) = 6.239; and **p = 0.0017, t(4) = 8.443. Statistical significance was determined by two-way ANOVA in G and H, and asterisks were determined by Sidak's multiple-comparisons test. shCrtl and shYm2: F(1,44) = 34.59, p < 0.001; Lenti-Ctrl and Lenti-Ym2: F(1,20) = 9.951, p = 0.005. Scale bars, 20 μm.
Figure 9.
Figure 9.
Ym2 regulates cell differentiation in OE colonies. A–D, Confocal images of OMP+ cells in colonies infected with Lenti-shCtrl, Lenti-shYm2, Lenti-Ctrl, or Lenti-Ym2. E–H, Immunostaining against Sus4 in Lenti-shCtrl-, Lenti-shYm2-, Lenti-Ctrl-, or Lenti-Ym2-infected colonies. I, Statistical analysis of Sus4+ and OMP+ cell ratios in colonies with Lenti-shCtrl, Lenti-shYm2, Lenti-Ctrl, or Lenti-Ym2 infection (Sus4+: n = 7, 6, 7, and 6 sections from three independent cultures in each group; OMP: n = 6 sections in each group). J–M, Confocal images of Sox2+ and Ki67+ cells in OE colonies treated with 0, 0.5, 1, and 2 μg/ml Ym2. N–Q, Confocal images of OMP+ and Krt14+ cells in OE colonies treated with 0, 0.5, 1, and 2 μg/ml Ym2. R, Statistical analysis of Ki67+, Sox2+, Ki67+Sox2+, Krt14+, and OMP+ cells in untreated and recombinant Ym2-treated colonies (Ki67+, Sox2+, Ki67+Sox2+: n = 6 sections from three independent cultures in each group; Krt14+, OMP+: n = 5 sections in Ctrl and 0.5 μg/ml Ym2-treated groups; n = 6 sections in 1 and 2 μg/ml Ym2-treated groups). Statistical significance in I was determined by two-way ANOVA: F(3,42) = 26.05, p < 0.0001. Asterisks in I were determined by Sidak's multiple-comparisons test. Statistical significance in R was determined by one-way ANOVA, and asterisks were measured by Dunnett's multiple comparisons test. Ki67+: F(3,20) = 5.691, p = 0.0055; Sox2+: F(3,20) = 2.389, p = 0.0991; Ki67+Sox2+: F(3,20) = 6.707, p = 0.0026; Krt14+: F(3,18) = 1.696, p = 0.2036; OMP+: F(3,18) = 7.838, p = 0.0015. Scale bars, 10 μm.
Figure 10.
Figure 10.
Dexamethasone (Dex) treatment reduces the Ym2 level and defers OE regeneration. A, Scheme showed Dex injection in mice with methimazole-induced OE lesion. B, Quantitative PCR analysis on Dex-induced alteration in the Ym2-, TNF-α-, and IL-1β-mRNA levels in lesioned OE (n = 3 independent experiments). C–J, Confocal images of immunostaining against Ym2, OMP, PGP9.5, Sox2, and ICAM1 in the OE of mice with saline or Dex injection on day 14 and day 31 postlesion. K, Analysis on Ym2 intensity in lesioned OE on day 14 with saline or Dex administration (n = 9 sections from three mice). L, M, Statistical analysis of PGP9.5+, OMP+, or apical Sox2+ cells in the OE of saline- or Dex-injected mice on day 14 (PGP9.5+: n = 6 sections; OMP+: n = 6 and 12 sections in Dex-treated and saline-treated groups) and day 31 postlesion (Sox2+: n = 6 sections; OMP+: n = 5 sections). Statistical significance was determined by one-way ANOVA (B), by unpaired Student's t test (K), and by two-way ANOVA (L, M). B: Ym2: F(4,10) = 74.57, p < 0.0001; TNF-α: F(4,10) = 16.00, p = 0.0004; IL-1β: F(4,10) = 14.69, p = 0.0003; K: *p = 0.0456 (t(16) = 2.18); L: F(1,26) = 14.95, p = 0.0007; M: F(1,18) = 4.609, p = 0.0457. Asterisks were determined by Dunnett's multiple-comparisons test (B) and by Sidak's multiple-comparisons test (L, M). Scale bars, 10 µm.
Figure 11.
Figure 11.
Ym2 overexpression counteracts Dex-induced attenuation in OE regeneration. A, The timeline of Lenti-Ym2, Dex, and methimazole administration. B–M, Immunostaining revealed alterations in the number (per 100 µm OE) of ICAM1+ and PGP9.5+ cells (B–D, H–J) as well as OMP+ and Sox2+ cells (E–G, K–M) by saline, Lenti-Ctrl, or Lenti-Ym2 injection in Dex-treated mice, killed on day 14 and day 31 post-OE lesion. N, O, Statistical analysis of the number of ICAM1+, PGP9.5+, OMP+, and apical Sox2+ cells per 100 µm OE in Lenti-Ym2/Dex-treated mice and Lenti-Ctrl/Dex-injected controls on day 14 and day 31 after OE injury (n = 5 sections from three mice). P, Statistical analysis of the OE thickness in Dex-treated mice injected with Lenti-Ctrl or Lenti-Ym2. OE thickness: 32.1 ± 7.1 and 44.5 ± 8.5 μm in mice receiving Lenti-Ctrl and Lenti-Ym2 on day 14; 49.9 ± 6.3 and 54.5 ± 7.0 μm on day 31; n = 10 sections on day 14 and n = 6 sections on day 31 from three mice. Q–T, Confocal images of F4/80+ and CD45+ cells in the OE of Lenti-Ctrl- and Lenti-Ym2-injected mice. U, Statistical analysis of the number of F4/80+ and CD45+ cells/100 µm OE (n = 6 sections from three mice). Statistical significance was determined by two-way ANOVA (N, O, P). N: F(1,32) = 58.79, p < 0.0001; O: F(1,32) = 6.650, p = 0.0013; P: F(1,28) = 8.868, p = 0.0061. Asterisks in N, O, and P were determined by Sidak's multiple-comparisons test. Statistical significance in U was determined by unpaired t test. *p = 0.0347, t(10) = 2.485; ***p < 0.001, t(10) = 6.544. Scale bars: D, G, J, M, 10 μm; Q, S, 20 μm.
Figure 12.
Figure 12.
Anti-inflammatory administration interacts with Ym2 expression and affects cell differentiation in OE colonies. A, Schematic of methimazole and Lenti-shYm2 treatment in OE colonies. B, Schematic of methimazole and Dex administration in OE colonies. C, Quantitative PCR analysis showed decreases in the Ym2-, TNF-α-, and IL-1β-mRNA levels by Ym2 downregulation (n = 3 experiments). D, Quantitative PCR analysis on Ym2-, TNF-α-, and IL-1β-mRNA levels with Dex treatment in OE colonies (n = 3–5 experiments). E, Images of OMP-TdT+ (TdTomato+) colonies treated with saline, 0.1 μm Dex, or 1 μm Dex. F, Statistical analysis of the percentage of OMP-TdT+ colonies in the presence of saline, 0.1 μm Dex, or 1 μm Dex (n = 6, 6, and 7 sections from three independent cultures in each group). Statistical significance was determined by two-way ANOVA with Sidak's multiple-comparisons tests (C), and by one-way ANOVA with Dunnett's multiple-comparisons test (D, F). ns, Not significant. C: F(1,12) = 342.5, p < 0.0001; D: Ym2: F(3,12) = 12.34, p = 0.0004; TNF-α: F(3,10) = 18.15, p = 0.0002; IL-1β: F(3,8) = 5.203, p = 0.0335; F: F(2,16) = 10.83, p = 0.0011. Scale bars, 0.2 mm.
Figure 13.
Figure 13.
Ym2 overexpression alleviates the inhibitory effect of Dex on cell differentiation of OE colonies. A, C, E, Confocal images of Ym2+, Sus4+, and OMP+ cells in saline-treated, 0.1 μm Dex-treated, or 1 μm Dex-treated OE colonies. B, D, F, Statistical analysis of the Ym2+, Sus4+, and OMP+ cell percentages in OE colonies treated with saline, 0.1 μm Dex, or 1 μm Dex (Ym2+: n = 3, 4, and 3 sections in each group; Sus4+: n = 4 sections; OMP+: n = 4, 4, and 3 sections). G, Scheme showing the Lenti-Ctrl or Lenti-Ym2 and Dex administration in OE colonies. H, Statistical analysis on the percentage of Sus4+ or OMP+ cells in Dex-treated colonies infected with Lenti-Ctrl or Lenti-Ym2 (Sus4+: n = 7 and 6 sections from three independent cultures in each group; OMP+: n = 6 sections). I, J, Confocal images of Sus4+ and OMP+ cells in Lenti-Ctrl- or Lenti-Ym2-infected colonies treated with Dex. Statistical significance was determined by one-way ANOVA with Dunnett's multiple-comparisons test (B, D, F), and by two-way ANOVA with Sidak's multiple-comparisons test (H). B: F(2,7) = 11.29, p = 0.0064; D: F(2,9) = 7.732, p = 0.0111; F: F(2,8) = 5.916, p = 0.0265; H: F(1,21) = 20.74, p = 0.0002. Scale bars, 20 μm.
Figure 14.
Figure 14.
Summary of the main findings in this study. Green lines denote “facilitate,” and red lines denote “impede.”

Similar articles

Cited by

References

    1. Abercrombie M (1946) Estimation of nuclear population from microtome sections. Anat Rec 94:239–247. 10.1002/ar.1090940210 - DOI - PubMed
    1. Arnold K, Sarkar A, Yram MA, Polo JM, Bronson R, Sengupta S, Seandel M, Geijsen N, Hochedlinger K (2011) Sox2(+) adult stem and progenitor cells are important for tissue regeneration and survival of mice. Cell Stem Cell 9:317–329. 10.1016/j.stem.2011.09.001 - DOI - PMC - PubMed
    1. Bonneh-Barkay D, Zagadailov P, Zou H, Niyonkuru C, Figley M, Starkey A, Wang G, Bissel SJ, Wiley CA, Wagner AK (2010) YKL-40 expression in traumatic brain injury: an initial analysis. J Neurotrauma 27:1215–1223. 10.1089/neu.2010.1310 - DOI - PMC - PubMed
    1. Burman J, Raininko R, Blennow K, Zetterberg H, Axelsson M, Malmeström C (2016) YKL-40 is a CSF biomarker of intrathecal inflammation in secondary progressive multiple sclerosis. J Neuroimmunol 292:52–57. 10.1016/j.jneuroim.2016.01.013 - DOI - PubMed
    1. Bussink AP, Speijer D, Aerts JM, Boot RG (2007) Evolution of mammalian chitinase(-like) members of family 18 glycosyl hydrolases. Genetics 177:959–970. 10.1534/genetics.107.075846 - DOI - PMC - PubMed

Publication types