. 2021 May;9(5):e001335.
doi: 10.1136/jitc-2020-001335.

Druggable epigenetic suppression of interferon-induced chemokine expression linked to MYCN amplification in neuroblastoma

Affiliations

Druggable epigenetic suppression of interferon-induced chemokine expression linked to MYCN amplification in neuroblastoma

Johanna A Seier et al. J Immunother Cancer. 2021 May.

Abstract

Background: Amplification of the MYCN oncogene is a molecular hallmark of aggressive neuroblastoma (NB), a childhood cancer of the sympathetic nervous system. There is evidence that MYCN promotes a non-inflamed and T-cell infiltration-poor ('cold') tumor microenvironment (TME) by suppressing interferon signaling. This may explain, at least in part, why patients with NB seem to have little benefit from single-agent immune checkpoint blockade (ICB) therapy. Targeting MYCN or its effectors could be a strategy to convert a cold TME into a 'hot' (inflamed) TME and improve the efficacy of ICB therapy.

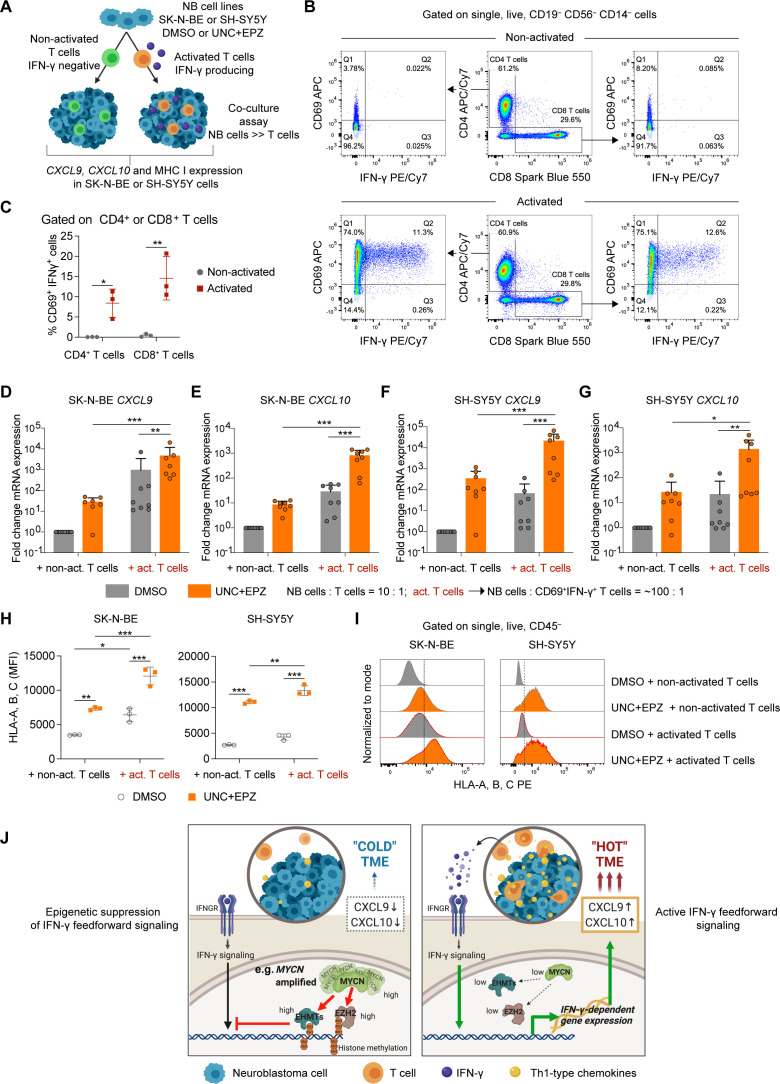
Methods: NB transcriptome analyses were used to identify epigenetic drivers of a T-cell infiltration-poor TME. Biological and molecular responses of NB cells to epigenetic drugs and interferon (IFN)-γ exposure were assessed by proliferation assays, immunoblotting, ELISA, qRT-PCR, RNA-seq and ChIP-qPCR as well as co-culture assays with T cells.

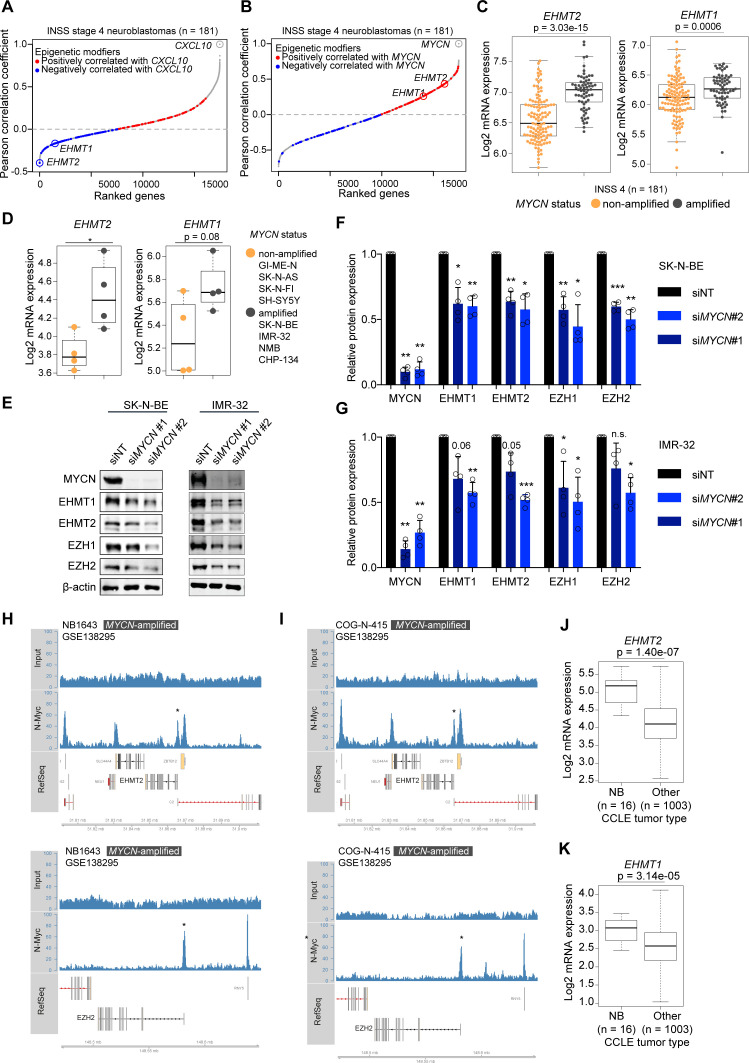
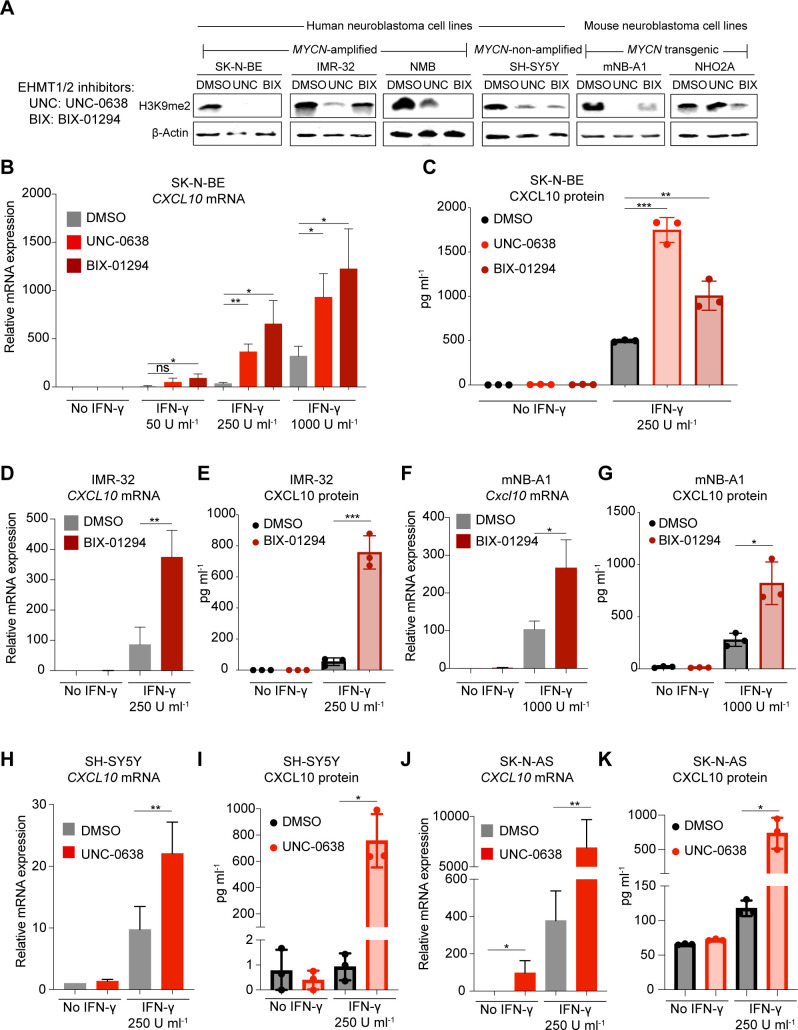
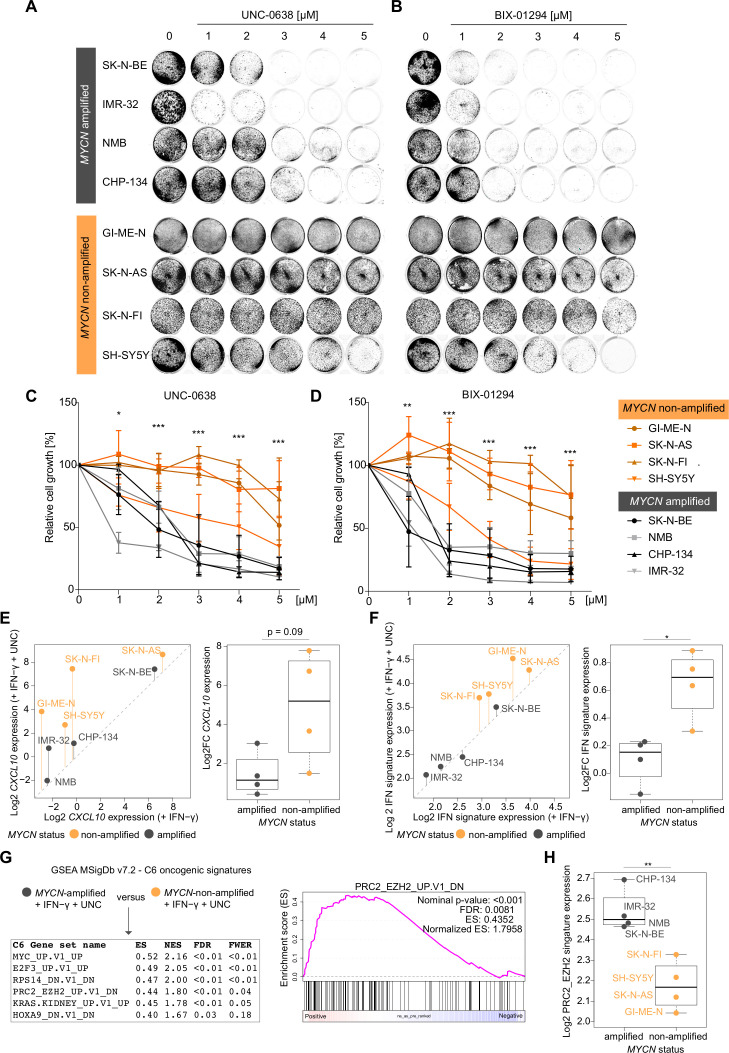
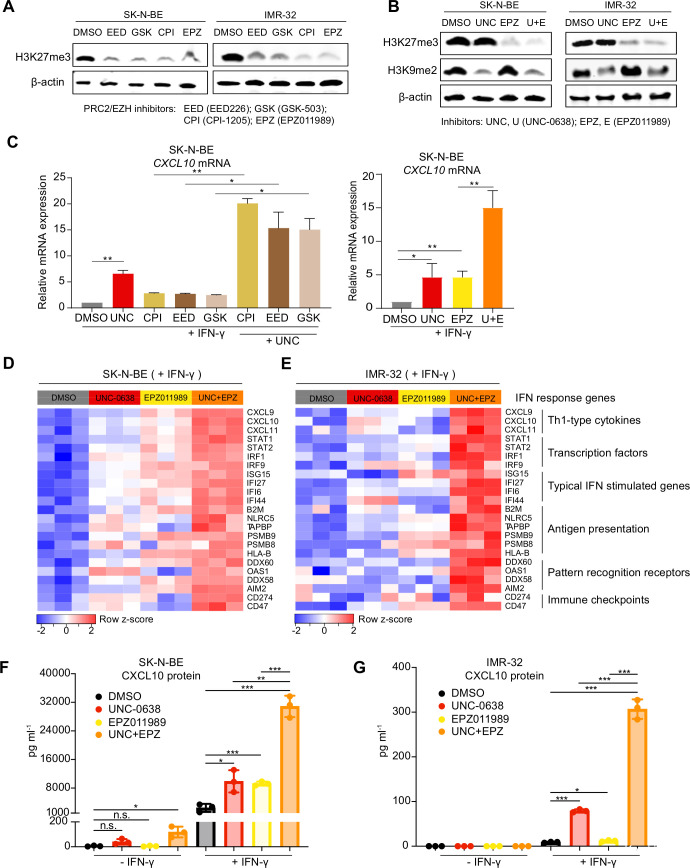
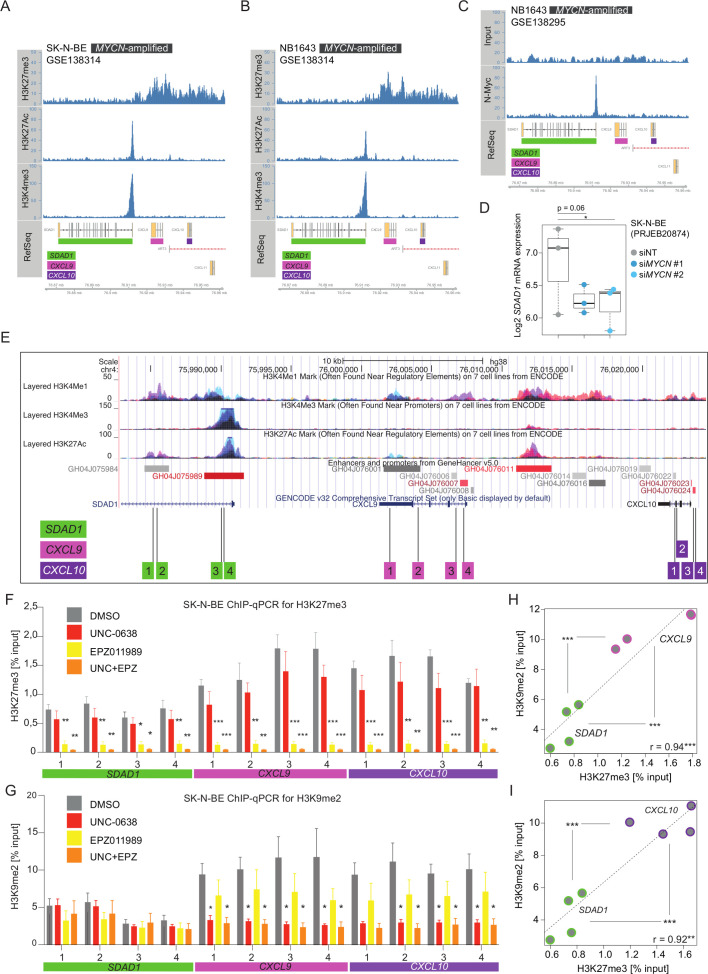
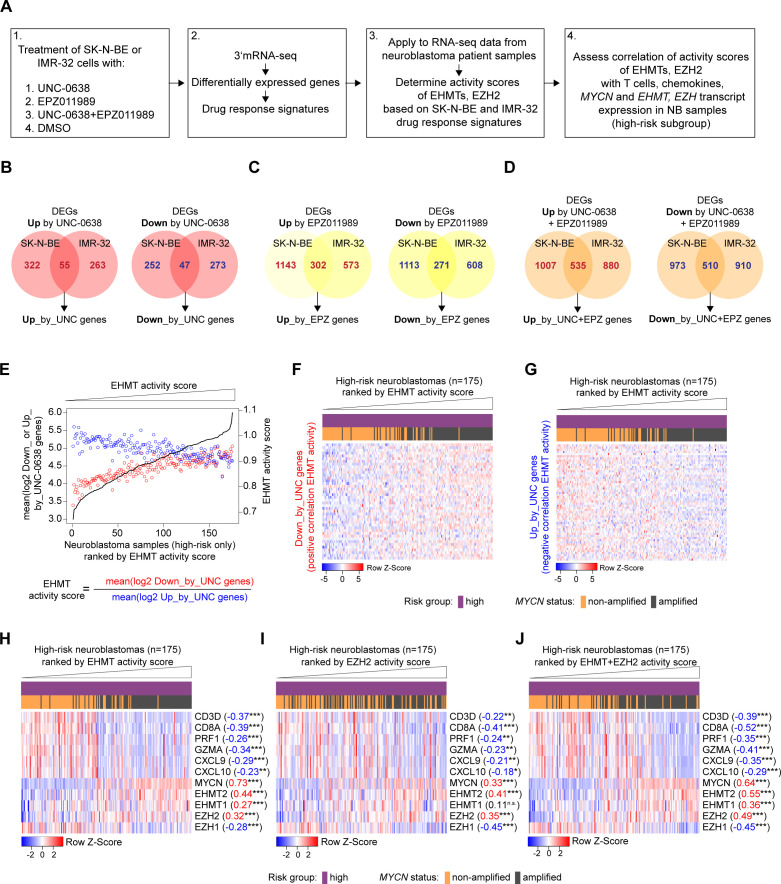
Results: We identified H3K9 euchromatic histone-lysine methyltransferases EHMT2 and EHMT1, also known as G9a and GLP, as epigenetic effectors of the MYCN-driven malignant phenotype and repressors of IFN-γ transcriptional responses in NB cells. EHMT inhibitors enhanced IFN-γ-induced expression of the Th1-type chemokines CXCL9 and CXCL10, key factors of T-cell recruitment into the TME. In MYCN-amplified NB cells, co-inhibition of EZH2 (enhancer of zeste homologue 2), a H3K27 histone methyltransferase cooperating with EHMTs, was needed for strong transcriptional responses to IFN-γ, in line with histone mark changes at CXCL9 and CXCL10 chemokine gene loci. EHMT and EZH2 inhibitor response gene signatures from NB cells were established as surrogate measures and revealed high EHMT and EZH2 activity in MYCN-amplified high-risk NBs with a cold immune phenotype.

Conclusion: Our results delineate a strategy for targeted epigenetic immunomodulation of high-risk NBs, whereby EHMT inhibitors alone or in combination with EZH2 inhibitors (in particular, MYCN-amplified NBs) could promote a T-cell-infiltrated TME via enhanced Th1-type chemokine expression.

Keywords: immunomodulation; immunotherapy; inflammation; neuroblastoma; tumor microenvironment.


Conflict of interest statement

Competing interests: None declared.

Figures

Figure 1
Figure 1
Euchromatic histone methyltransferases (EHMTs) as inversely regulated genes with CXCL10 level in high-risk neuroblastomas and its association with MYCN amplification. (A) Genes correlating with CXCL10 expression in INSS 4 NBs ranked by increasing Pearson correlation coefficients. Epigenetic modifiers from Xu et al are highlighted. Red: positively correlated; blue: negatively correlated. (B) As in (A) but showing genes correlating with MYCN expression. (C) Boxplots showing EHMT2 and EHMT1 expression (RNA-seq, log2) in INSS 4 NBs by MYCN status. (D) Boxplots showing EHMT2 and EHMT1 expression (3′mRNA-seq, log2) in human NB cell lines by MYCN status. (E) Western blots for MYCN, EHMT1, EHMT2, EZH1, EZH2 and β-actin in siMYCN or non-targeting non-targeting siRNA (siNT)-treated SK-N-BE and IMR-32 cells. Representative blots of biological replicates (n=4). (F, G) Quantification of experiment described in (E) from biological replicates (n=4). Error bars; SD. (H) and (I) MYCN-binding peaks in the genomic regions of EHMT2 (upper panels) and EZH2 (lower panel) by ChIP-seq. Cell lines and data set as indicated. (J) and (K) EHMT2 and EHMT1 expression in NB cells versus other cancer cells from the CCLE database. Statistics: two-sided unpaired t-tests (C, D, J, K). Two-sided unpaired t-test with logarithmic values (F, G). Boxplots: Boxes indicate second and third quartile. Bars indicate first and fourth quartile. Horizontal line represents median. *p<0.05; **p<0.01; ***p<0.001. Otherwise p values as indicated. NB, neuroblastoma.
Figure 2
Figure 2
Euchromatic histone-lysine methyltransferase (EHMT) inhibitors enhance IFN-γ-induced CXCL10 production in human and mouse neuroblastoma cell lines. (A) Western blots for H3K9me2 and β-actin of human and mouse NB cell lines treated with EHMT inhibitors UNC-0638 and BIX-01294 for 96 hours (2 µM). Representative blots of n=3. (B) qRT-PCR analysis CXCL10 mRNA expression (normalized to UBC) in SK-N-BE cells treated with UNC-0638 or BIX-01294 for 96 hours (2 µM) and stimulated with increasing concentrations of IFN-γ for the last 24 hours. Results from biological replicates (n=3). (C) Experimental setup as described in (B) but ELISA for CXCL10 protein level (pg mL−1) in culture supernatant. Results from biological replicates (n=3). (D) qRT-PCR analysis of CXCL10 mRNA expression (normalized to UBC) and (E) ELISA for CXCL10 protein level (pg mL−1) in supernatant. IMR-32 cells treated with BIX-01294 for 96 hours and stimulated with IFN-γ (250 U mL−1) for the last 24 hours. Results from biological replicates (n=3). (F, G) as described in (D, E), but mNB-A1 cells. (H, I) and (J, K) as described in (D, E), but SH-SY5Y and SK-N-AS cells. Results from biological replicates (n=3). Statistics: *p<0.05; **p<0.01; ***p<0.001; two-sided unpaired t-test. Error bars: mean±SD. IFN, interferon; NB, neuroblastoma.
Figure 3
Figure 3
Discordant effects of euchromatic histone-lysine methyltransferase (EHMT) inhibitors on growth inhibition and IFN-γ transcriptional responses dependent on MYCN status in human neuroblastoma cells (A) and (B) representative images from biological replicates (n=3) of stained culture dishes of MYCN-amplified and MYCN-non-amplified human NB cell lines treated with UNC-0638 and BIX-01249 at indicated concentrations for 96 hours. (C) and (D) Quantifications of the experiments described in (A) and (B). (E) CXCL10 and (F) hallmark interferon gamma response signature expression (log2) in human NB cells based on 3′mRNA-seq data and averaged values from biological duplicates. Left panels: Scatter plots comparing expressing expression in the presence of IFN-γ versus IFN-γ and UNC-0638. Vertical bars indicate log2 fold changes (Log2FCs). Right panels: Log2FCs replotted from scatter plots for statistical comparison. (G) Left panel: GSEA results from group comparison as indicated based on 3′mRNA-seq data described in (E) and (F). Right panel: GSEA plot for indicated gene set. (H) Log2 averaged expression gene set from (G) in NB cell lines stratified by MYCN status. Cell lines as indicated. Statistics: *p<0.05; **p<0.01; ***p<0.001; two-sided unpaired t-test with logarithmic relative growth (%) values comparing groups MYCN-amplified versus MYCN-non-amplified at each concentration in (C) and (D). Two-sided unpaired ratio t-test in (E, F, H). Error bars: mean±SD. Boxplots: Boxes indicate second and third quartile. Bars indicate first and fourth quartile. Horizontal line represents median. ES, enrichments score; FDR, false discovery rate; FWER, family wise error rate; GSEA, gene set enrichment analysis; IFN, interferon; NB, neuroblastoma; NES, normalized ES.
Figure 4
Figure 4
Combined euchromatic histone-lysine methyltransferase (EHMT) and EZH2 inhibition restores robust transcriptional responses to IFN-γ and CXCL10 chemokine production in MYCN-amplified human neuroblastoma cells. (A) Western blots H3K27me3 and β-actin in SK-N-BE and IMR-32 cells treated with different PRC2 and EZH2 inhibitors (all 3 µM) for 96 hours. Representative blots of n=3. (B) Western blots for H3K27me3, H3K9me2 and β-actin in SK-N-BE and IMR-32 cells treated with EHMT inhibitor UNC-0638 (2 µM), EZH2 inhibitor EPZ011989 (3 µM) or the combination of both drugs for 96 hours. Representative blots of n=3. (C) CXCL10 mRNA expression assessed by qRT-PCR in SK-N-BE NB cells treated as indicated. Results from biological replicates (n=3). (D) Heatmap visualizing the transcriptional response to IFN-γ in SK-N-BE and (E) IMR-32 cells treated with vehicle or UNC-0638, EPZ011989 or both for 7 days. IFN-γ (250 U/mL) was added for the last 24 hours. Experiments performed in biological replicates (n=3). (F, G) ELISA for CXCL10 protein level (pg/mL) in supernatants from SK-N-BE (F) and IMR-32 NB (G) cells treated as described in (C) and (D). Results from biological replicates (n=3). Statistics: *p<0.05; **p<0.01; ***p<0.001; two-sided unpaired t-test. Error bars: mean±SD. IFN, interferon; NB, neuroblastoma.
Figure 5
Figure 5
Loss of H3K9me2 and H3K27me3 repressive histone marks at CXCL9 and CXCL10 genomic loci on euchromatic histone-lysine methyltransferase (EHMT) and EZH2 inhibitor treatment of human neuroblastoma cells. Plotted histone ChiP-seq tracks obtained GSE138314 from (A) SK-N-BE and (B) NB1643 MYCN-amplified cells showing the genomic region of CXCL9, CXCL10 and CXCL11 chemokines genes with neighboring SDAD1 gene on human chromosome 4. (C) As (B), but showing MYCN-binding ChIP-seq track and input obtained from GSE138295. (D) SDAD1 expression (3′mRNA-seq, log2, from PRJEB20874) in SK-N-BE cells transfected with non-targeting siRNA (siNT) and MYCN siRNAs. (E) UCSC genome browser plot showing the genomic regions of SDAD1, CXCL9, CXCL10 and CXCL11 with ENCODE ChIP-seq tracks. Strategy of PCR primer pair positioning for tiling ChIP-qPCR in regulatory region of respective genes. Results from biological replicates (n=3) from tiling ChIP-qPCR for (F) H3K27me3 and (G) H3K9me2 represented as percentage input. SK-N-BE cells were treated with indicated inhibitors for 6 days prior to harvesting chromatin. Numbers on x-axis represent primer pairs as described in (E). (H) Scatter plot comparing and correlating baseline level of H3K27me3 and H3K9me2 as (% input) between neighboring SDAD1 and CXCL9 genomic regions based on results from (F) and (G) in untreated SK-N-BE cells. Statistically significant differences between groups (SDAD1 and CXCL9) are indicated. (I) Same analysis as in (H), but for CXCL10. Statistics: *p<0.05; **p<0.01; ***p<0.001; two-sided unpaired t-tests with logarithms of percentage input values; p values corrected for multiple testing with Benjamini and Hochberg method (FDR) in (E) and (G). Error bars: mean±SEM (F, G). Boxplots: boxes indicate second and third quartile. Bars indicate first and fourth quartile. Horizontal line represents median.
Figure 6
Figure 6
High-risk neuroblastomas with high euchromatic histone-lysine methyltransferase (EHMT) and EZH2 activity are characterized by MYCN amplification and a T-cell infiltration-poor tumor microenvironment. (A) Outline of bioinformatic strategy. (B, C, D) Generation of drug response signatures from overlap of differentially expressed genes in SK-N-BE and IMR-32 cells treated with UNC-0638 (B), EPZ011989 (C) or both drugs (D). (E) Exemplary visualization of calculation of EHMT activity scores for high-risk NB samples. (F, G) Exemplary heatmap visualization of expression of UNC-0638 drug response genes in high-risk NB samples ranked by increasing EHMT activity score. (H–J) Heatmaps visualizing immune contexture marker genes (eg, CD8A, CXCL10), EHMT2/1, EZH2/1 and MYCN in high-risk NB samples ranked by increasing activity scores of EHMT (H), EZH2 (I) and EHMT+EZH2 (J). Pearson correlation coefficients are indicated besides the names of the transcripts. Statistics: *p<0.05; **p<0.01; ***p<0.001; two-sided t-test for Pearson product moment correlation coefficient. NB, neuroblastoma.
Figure 7
Figure 7
Combined euchromatic histone-lysine methyltransferase (EHMT) and EZH2 inhibition amplifies chemokine and MHC I expression by neuroblastomas instigated by low frequency of activated IFN-γ producing T cells. (A) Outline of experimental strategy. (B) Gating strategy and flow cytometric detection of activated CD69+IFN-γ+ human T cells after treatment with anti-CD3/CD28. (C) Quantification of frequency of CD69+IFN-γ+ T cells from three independent donors. (D–G) CXCL9 and CXCL10 mRNA expression by qRT-PCR in SK-N-BE (D, E) and SH-SY5Y (F, G) cells co-cultured and treated as indicated. (H, I) Flow cytometric analysis of MHC I expression on SK-N-BE and SH-SY5Y cells co-cultured and treated as indicated. (J) Model summarizing our findings. Statistics: two-way ANOVA with multiple comparison (C, H). Two-sided unpaired t-test with logarithmic values (D–G). Horizontal line represents median. *P<0.05; **p<0.01; ***p<0.001. Otherwise p values as indicated. IFN, interferon.

Similar articles

Cited by

References

    1. Ackermann S, Cartolano M, Hero B, et al. . A mechanistic classification of clinical phenotypes in neuroblastoma. Science 2018;362:1165–70. 10.1126/science.aat6768 - DOI - PMC - PubMed
    1. Hölzel M, Huang S, Koster J, et al. . NF1 is a tumor suppressor in neuroblastoma that determines retinoic acid response and disease outcome. Cell 2010;142:218–29. 10.1016/j.cell.2010.06.004 - DOI - PMC - PubMed
    1. Eleveld TF, Oldridge DA, Bernard V, et al. . Relapsed neuroblastomas show frequent RAS-MAPK pathway mutations. Nat Genet 2015;47:864–71. 10.1038/ng.3333 - DOI - PMC - PubMed
    1. Carr-Wilkinson J, O'Toole K, Wood KM, et al. . High frequency of p53/MDM2/p14ARF pathway abnormalities in relapsed neuroblastoma. Clin Cancer Res 2010;16:1108–18. 10.1158/1078-0432.CCR-09-1865 - DOI - PMC - PubMed
    1. Schramm A, Köster J, Assenov Y, et al. . Mutational dynamics between primary and relapse neuroblastomas. Nat Genet 2015;47:872–7. 10.1038/ng.3349 - DOI - PubMed

Publication types

MeSH terms