. 2021 May;9(5):e002155.
doi: 10.1136/jitc-2020-002155.

Modulation of lactate-lysosome axis in dendritic cells by clotrimazole potentiates antitumor immunity

Affiliations

Modulation of lactate-lysosome axis in dendritic cells by clotrimazole potentiates antitumor immunity

Zining Wang et al. J Immunother Cancer. 2021 May.

Abstract

Background: Dendritic cells (DCs) play a critical role in antitumor immunity, but the therapeutic efficacy of DC-mediated cancer vaccine remains low, partly due to unsustainable DC function in tumor antigen presentation. Thus, identifying drugs that could enhance DC-based antitumor immunity and uncovering the underlying mechanism may provide new therapeutic options for cancer immunotherapy.

Methods: In vitro antigen presentation assay was used for DC-modulating drug screening. The function of DC and T cells was measured by flow cytometry, ELISA, or qPCR. B16, MC38, CT26 tumor models and C57BL/6, Balb/c, nude, and Batf3-/- mice were used to analyze the in vivo therapy efficacy and impact on tumor immune microenvironment by clotrimazole treatment.

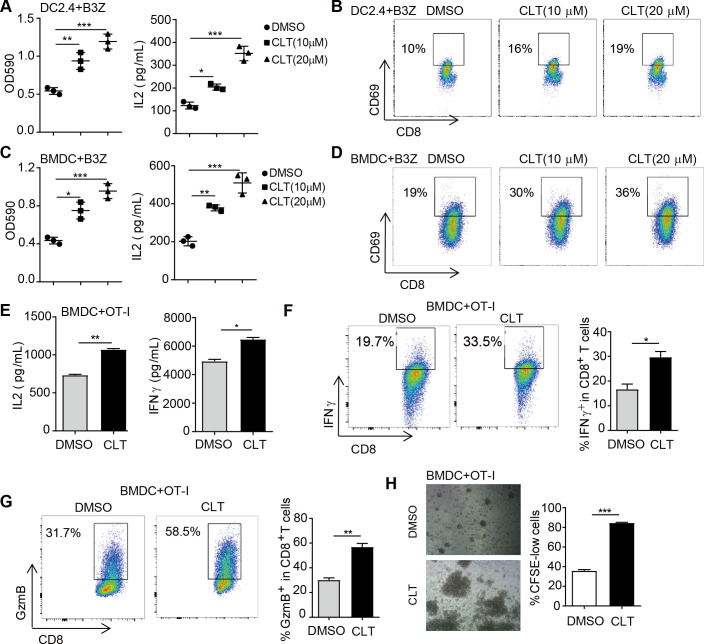
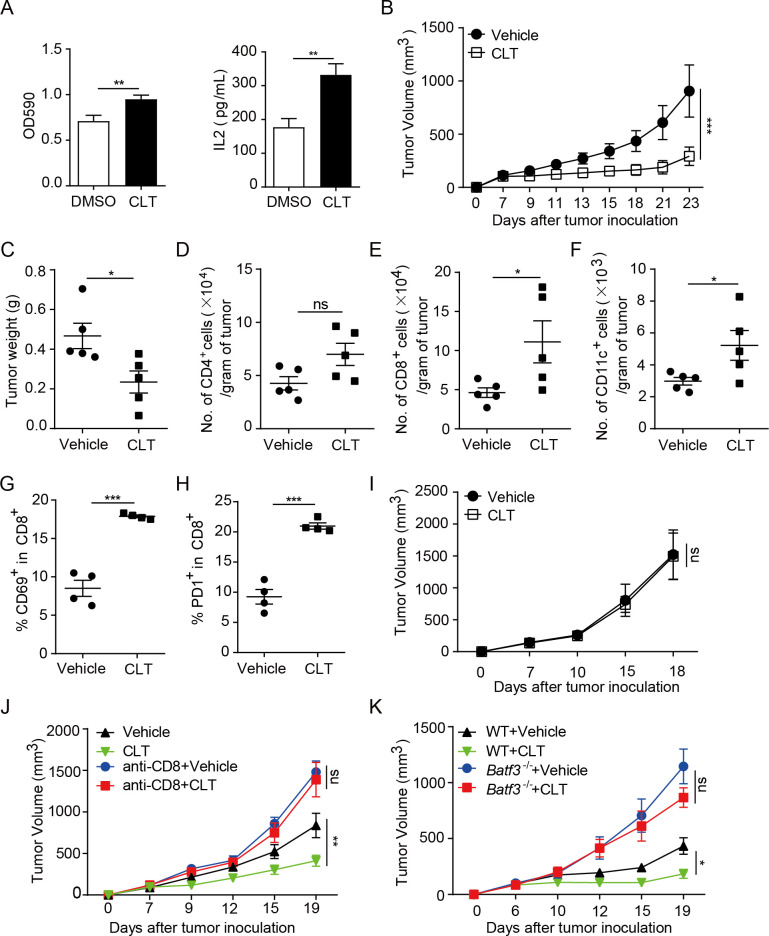
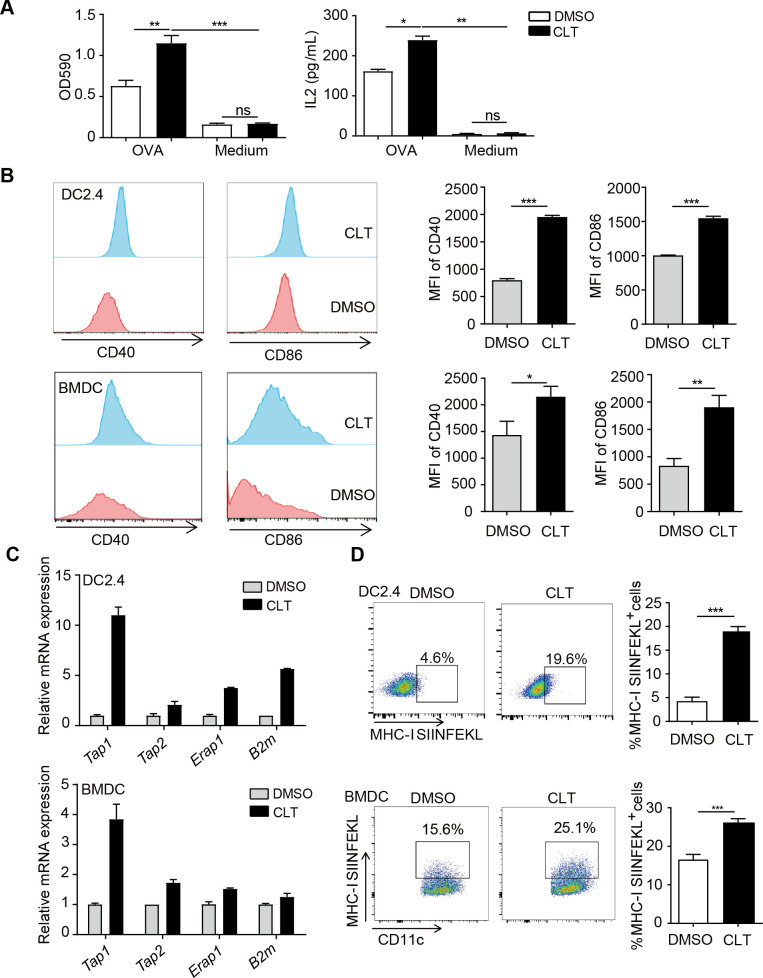
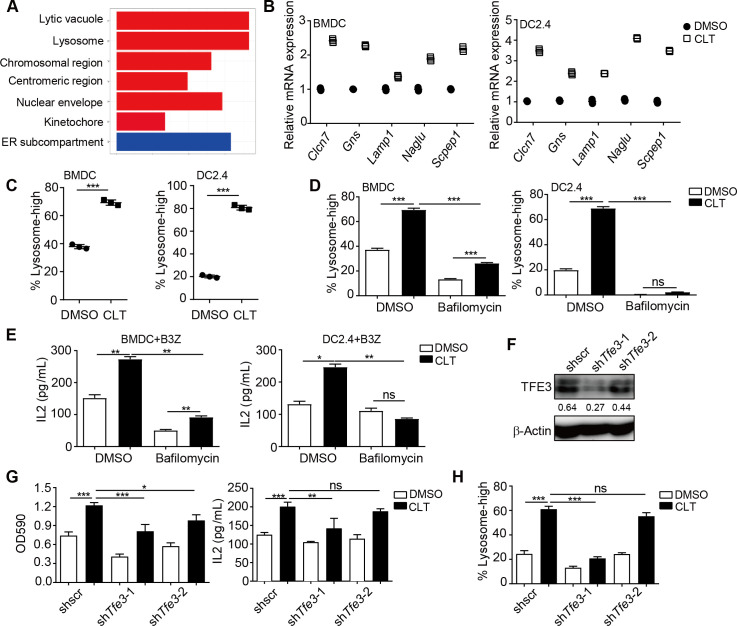
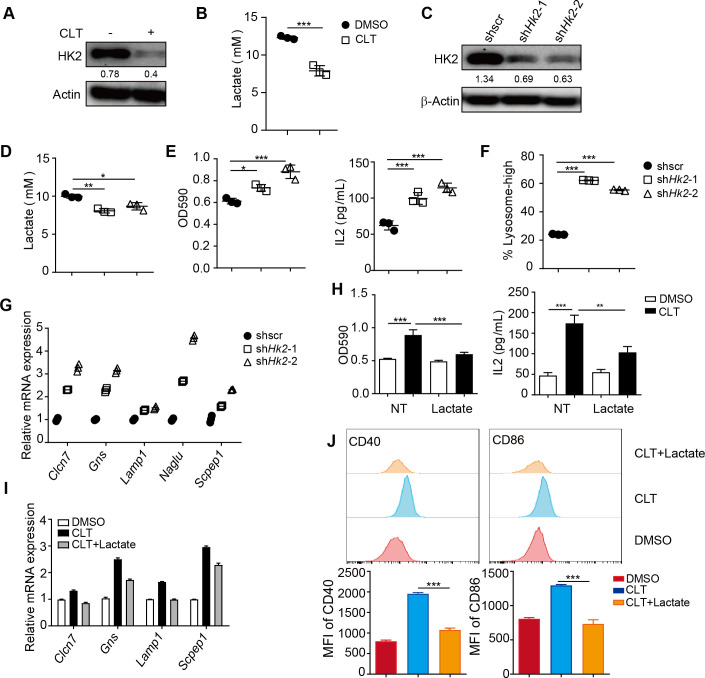
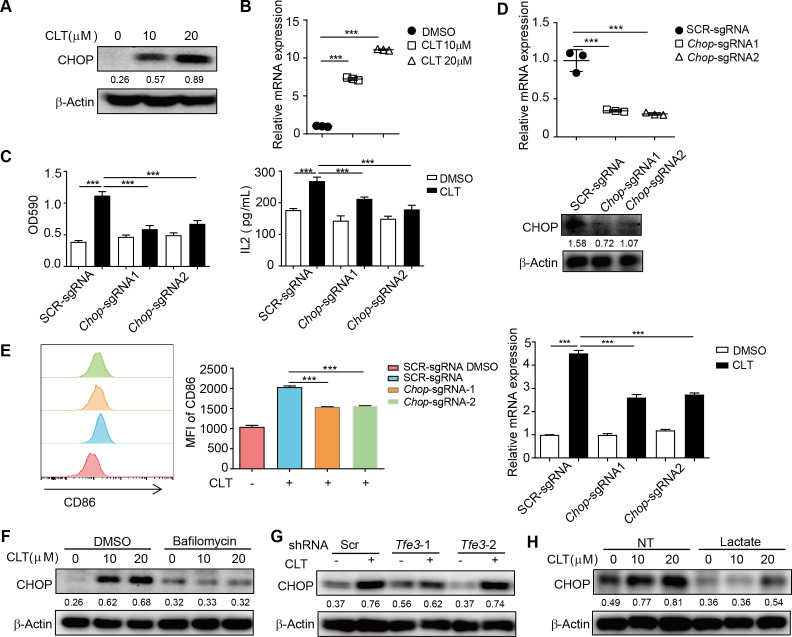
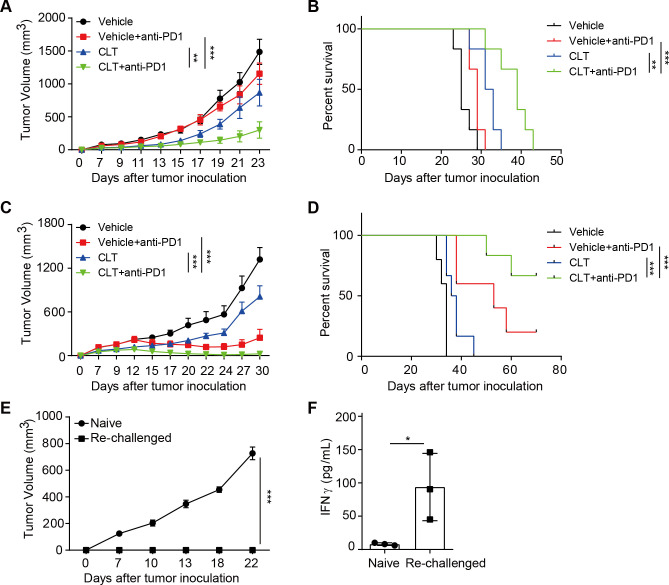
Results: By screening a group of small molecule inhibitors and the US Food and Drug Administration (FDA)-approved drugs, we identified that clotrimazole, an antifungal drug, could promote DC-mediated antigen presentation and enhance T cell response. Mechanistically, clotrimazole acted on hexokinase 2 to regulate lactate metabolic production and enhanced the lysosome pathway and Chop expression in DCs subsequently induced DC maturation and T cell activation. Importantly, in vivo clotrimazole administration induced intratumor immune infiltration and inhibited tumor growth depending on both DCs and CD8+ T cells and potentiated the antitumor efficacy of anti-PD1 antibody.

Conclusions: Our findings showed that clotrimazole could trigger DC activation via the lactate-lysosome axis to promote antigen cross-presentation and could be used as a potential combination therapy approach to improving the therapeutic efficacy of anti-PD1 immunotherapy.

Keywords: dendritic cells; immunotherapy.


Conflict of interest statement

Competing interests: No, there are no competing interests.

Figures

Figure 1
Figure 1
Clotrimazole enhanced DC-induced T cell activation. (A and B) DC2.4 cells were treated with clotrimazole or DMSO, then transfected with OVA (100 µg/mL) for 20 hours, followed by co-culture with B3Z cells for additional 24 hours, after which B3Z activation was measured by LacZ activity, IL-2 production (A), and CD69 expression (B). (C and D) BMDCs were treated as described in A), after which B3Z activation was measured by LacZ activity, IL-2 production (C), and CD69 expression (D). (E–G.) BMDCs were treated with clotrimazole or DMSO, then transfected with OVA (100 µg/mL) for 20 hours, and co-culture with OT-I cells for an additional 24 hours, after which OT-I cells activation were measured by IL-2 production, IFNγ production (E), and intracellular expression of IFNγ (F) and GZMB (G). (H) BMDCs were treated as in (E), then co-cultured with OT-I (labeled by CFSE) for 3 days. The proliferation of OT-I cells was detected by microscopy and flow cytometry. Data in A–H are the representative result of three repeated experiments. *p<0.05, **p<0.01, ***p<0.001, by one-way analysis of variance with Bonferroni’s post-test. BMDC, bonemarrow-derived dendritic cell; CLT, clotrimazole; DMSO, dimethyl sulfoxide; CFSE, carboxyfluoresceinsuccinimidyl amino ester; IFNγ, interferon gamma; GZMB, Granzyme B.
Figure 2
Figure 2
Clotrimazole inhibited tumor growth by promoting antitumor immunity. (A) BMDCs were treated with clotrimazole (10 µM) or DMSO for 20 hours, then incubated with live B16-OVA cells for 24 hours, followed by co-culture with B3Z cells for an additional 24 hours. The LacZ activity and IL-2 production were measured. (B) B6 mice bearing MC38 tumors were treated with clotrimazole or vehicle on day 3–7 (40 mg/kg, i.p.), and tumor growth was monitored. n=5 per group. (C–F) B6 mice bearing MC38 tumors were treated with clotrimazole or vehicle on days 3–7 (40 mg/kg, i.p.), Tumors were isolated on day 13, and tumor-infiltrating immune cells were analyzed by flow cytometry. Shown are tumor weight (C), numbers of tumor-infiltrating CD4+ T cells (D), CD8+ T cells (E), CD11c+ dendritic cells (F), CD69 and PD1 expression on CD8+ T cells (G–H). (n=5 for C–F, n=4 for G–H). (I.) Balb/c nude mice bearing MC38 tumors were treated with clotrimazole or vehicle on days 3–7 (40 mg/kg, i.p.), and tumor growth was monitored. n=5 per group. (J) B6 mice were injected with anti-CD8 depletion antibody on days 3, 6, and 9 after MC38 tumor inoculation, followed by clotrimazole treatment on day 3–7 (40 mg/kg, i.p.), and tumor growth was monitored. n=5 per group. (K) B6 background WT or Batf3−/− mice bearing MC38 tumors were treated with clotrimazole or vehicle on day 3–7 (40 mg/kg, i.p.), and tumor growth was monitored. n=5 per group. Tumor volume is shown as mean±SD, *p<0.05, **p<0.01, ns=not significant, by two-way analysis of variance with Bonferroni’s post-test (B, I–J) or unpaired Student’s t test (A, C–H). BMDC, bonemarrow-derived dendritic cell; CLT, clotrimazole; DMSO, dimethyl sulfoxide.
Figure 3
Figure 3
Clotrimazole activated dendritic cells. (A) DC2.4 cells were treated with clotrimazole (20 µM) or DMSO, then transfected with OVA (100 µg/mL) for 20 hours, and co-culture with B3Z cells for an additional 24 hours, after which LacZ activity and IL-2 production in B3Z cells were measured. (B and C) DCs were treated as described in (A), the expression of CD40 and CD86 was measured by flow cytometry (B), the expression levels of antigen processed genes were measured by qPCR (C). (D) DCs were treated with clotrimazole (20 µM) or DMSO for 20 hours, then transfected with OVA (100 µg/mL) for another 24 hours. The expression level of the MHC-I SIINFEKL complex was measured by flow cytometry. Data in A, B, D are the representative results of three repeated experiments. Data in (C) are shown as mean±SD of three replicates from one representative experiment. *p<0.05, **p<0.01, ***p<0.001 and ns=not significant, by one-way analysis of variance with Bonferroni’s post-test. OVA, antigen ovalbumin; CLT, clotrimazole; DMSO, dimethyl sulfoxide; DC, dendritic cell.
Figure 4
Figure 4
Clotrimazole induced dendritic cell activation through a lysosome pathway. (A.) Gene set pathway enrichment analysis by RNAseq using BMDCs treated with clotrimazole (20 µM) or DMSO for 24 hours. (B) DCs were treated with clotrimazole (20 µM) or DMSO for 24 hours. The expression of lysosome-associated genes was measured by qPCR. (C) DCs were treated as in (B), the PE-labeled lysosome tracker was added into the medium for an additional 30 mins. The fluorescence signal was detected by flow cytometry. (D) DCs were treated with clotrimazole (20 µM) or combined with bafilomycin (100 nM) for 20 hours, the PE-labeled lysosome tracker was added into the medium for an additional 30 min. The fluorescence signal was detected by flow cytometry. (E) DCs were treated as in D), then transfected with OVA (100 µg/mL) for 20 hours, and co-cultured with B3Z for an additional 24 hours, after which B3Z cell activation was measured by IL-2 production. (F and G) DC2.4 cells were treated with clotrimazole or DMSO, then transfected with OVA (100 µg/mL) for 20 hours, and co-culture with B3Z for an additional 24 hours, after which B3Z cell activation was measured by LacZ activity and IL-2 production (G). Western blot was used to detect the knockdown efficiency of TFE3 expression (F). (H) DC2.4 cells were treated as in G), the PE-labeled lysosome tracker was added into the medium for an additional 30 min. The fluorescence signal was detected by flow cytometry. Data in (B) are shown as mean±SD of three replicates from one representative experiment. Data in (C–H) are the representative result of three repeated experiments. *p<0.05, **p<0.01, ***p<0.001 and ns=not significant, by one-way analysis of variance with Bonferroni’s post-test. BMDC, bone marrow-derived dendritic cell; CLT, clotrimazole; DMSO, dimethyl sulfoxide; DC, dendritic cell.
Figure 5
Figure 5
Clotrimazole inhibited lactate production by targeting HK2 in DCs. (A) DC2.4 cells were treated with clotrimazole or DMSO for 24 hours, then the expression of HK2 was determined by WB. (B) DC2.4 cells were treated with clotrimazole or DMSO for 24 hours, the lactate concentration in the supernatant was measured. (C and D) DC2.4 cells were cultured for 24 hours, then the lactate concentration in the supernatant was measured (D); WB was used to detect the knockdown efficiency of HK2 expression in DC2.4 cells by shRNA (C). (E) DC2.4 cells were transfected with OVA (100 µg/mL) for 20 hours, then co-cultured with B3Z for an additional 24 hours, after which B3Z cell activation was measured by LacZ activity and IL-2 production. (F) DC2.4 cells were cultured for 24 hours, the PE-labeled lysosome tracker was added into the medium for an additional 30 min. The fluorescence signal was detected by flow cytometry. (G) The expression of lysosome-associated genes in DC2.4 cells was measured by qPCR. (H) DC2.4 cells were treated with DMSO, clotrimazole, lactate (20 mM) or clotrimazole +lactate, then transfected with OVA (100 µg/mL) for 20 hours, and co-culture with B3Z for an additional 24 hours, B3Z cell activation was measured by LacZ activity and IL-2 production. (I and J) DC2.4 cells were treated as in (H) for 24 hours. The expression of lysosome-associated genes was measured by qPCR (I), and the expression level of CD40 and CD86 was detected by flow cytometry (J). Data in (A–F, H, and J) are the representative result of three repeated experiments. Data in (G) and (I) are shown as mean±SD of three replicates from one representative experiment. *p<0.05, **p<0.01, ***p<0.001, by one-way analysis of variance with Bonferroni’s post-test. OVA, antigen ovalbumin; CLT, clotrimazole; DMSO, dimethyl sulfoxide; PE, Phycoerythrin.
Figure 6
Figure 6
Clotrimazole induced dendritic cell activation by regulating Chop expression. (A and B) DC2.4 cells were treated with clotrimazole or DMSO for 24 hours, and the expression of Chop was detected by WB (A) or qPCR (B). (C and D) DC2.4 cells were treated with clotrimazole or DMSO, then transfected with OVA (100 µg/mL) for 20 hours, then co-culture with B3Z for an additional 24 hours, after which B3Z cell activation was measured by LacZ activity and IL-2 production (C), the expression of Chop was detected by WB and qPCR (D). (E) DC2.4 cells were treated with clotrimazole or DMSO for 24 hours, after which the expression of CD86 was detected by flow cytometry and qPCR. (F) DC2.4 cells were treated with DMSO, clotrimazole, bafilomycin or clotriamzole +bafilomycin for 24 hours, after which the protein level of CHOP was detected by WB. (G) DC2.4 cells were treated with DMSO or clotrimazole for 24 hours, after which the protein level of CHOP was detected by WB. (H) DC2.4 cells were treated with DMSO, clotrimazole, lactate or clotriamzole +lactate for 24 hours, after which the protein level of CHOP was detected by WB. Data in A, C, E–H are the representative result of three repeated experiments. Data in (B, D and E) are shown as mean±SD of three replicates from one representative experiment. *p<0.05, **p<0.01, ***p<0.001, by one-way analysis with Bonferroni’s post-test. OVA, antigen ovalbumin; CLT, clotrimazole; DMSO, dimethyl sulfoxide; WB, Western blot; SCR, scramble; CHOP, C/EBP homologous protein; NT, no lactate treatment.
Figure 7
Figure 7
Clotrimazole potentiated the efficacy of anti-PD1 therapy in multiple mouse tumor models. (A) Balb/c mice were subcutaneously injected with CT26 tumor cells and divided into four groups, then treated with vehicle, clotrimazole (40 mg/kg, day 3–7), anti-PD1 (5 mg/kg, day 9, 12, 15), or clotrimazole in combination with anti-PD1 at indicated time points, and tumor growth was monitored. n=6 per group. (B) The survival curves for indicated groups as described in (A). (C) B6 mice were subcutaneously injected with MC38 tumor cells and divided into four groups, then treated with vehicle, clotrimazole (40 mg/kg, day 3–7), anti-PD1 (5 mg/kg, day 9, 12, 15), or clotrimazole in combination with anti-PD1 at indicated time points, and tumor growth was monitored. n=5 for vehicle and anti-PD1 group, n=6 for clotrimazole and clotrimazole combined with anti-PD1 group. (D) The survival curve for indicated groups as described in (C). (E) MC38 tumor cell lines were inoculated subcutaneously into mice that previously rejected MC38 tumors on clotrimazole and anti-PD1 therapy or into naïve B6 mice as control, and tumor growth was monitored. n=4 for each group. (F) CD8+ T cells were isolated from the lymph nodes of mice that previously rejected MC38 tumors on combination therapy, and co-cultured with MC38 tumor cells for 24 hours, then the IFNγ production was measured by ELISA. Tumor volume is presented as mean±SD, *p<0.05, **p<0.01, ***p<0.001, by two-way analysis of variance with Bonferroni’s post-test (A, C, E), log-rank (Mantel-Cox) test (B, D), or unpaired Student’s t test (F). CLT, clotrimazole.

Similar articles

Cited by

References

    1. Steinman RM. Decisions about dendritic cells: past, present, and future. Annu Rev Immunol 2012;30:1–22. 10.1146/annurev-immunol-100311-102839 - DOI - PubMed
    1. Gardner A, Ruffell B. Dendritic cells and cancer immunity. Trends Immunol 2016;37:855–65. 10.1016/j.it.2016.09.006 - DOI - PMC - PubMed
    1. Chen DS, Mellman I. Oncology meets immunology: the Cancer-Immunity cycle. Immunity 2013;39:1–10. 10.1016/j.immuni.2013.07.012 - DOI - PubMed
    1. Melero I, Gaudernack G, Gerritsen W, et al. . Therapeutic vaccines for cancer: an overview of clinical trials. Nat Rev Clin Oncol 2014;11:509–24. 10.1038/nrclinonc.2014.111 - DOI - PubMed
    1. Kroemer G, Galluzzi L, Kepp O, et al. . Immunogenic cell death in cancer therapy. Annu Rev Immunol 2013;31:51–72. 10.1146/annurev-immunol-032712-100008 - DOI - PubMed

Publication types

MeSH terms