Observational Study
. 2021 May 20;12(1):2999.
doi: 10.1038/s41467-021-22579-1.

Orphan GPR116 mediates the insulin sensitizing effects of the hepatokine FNDC4 in adipose tissue

Affiliations
Observational Study

Orphan GPR116 mediates the insulin sensitizing effects of the hepatokine FNDC4 in adipose tissue

Anastasia Georgiadi et al. Nat Commun. .

Abstract

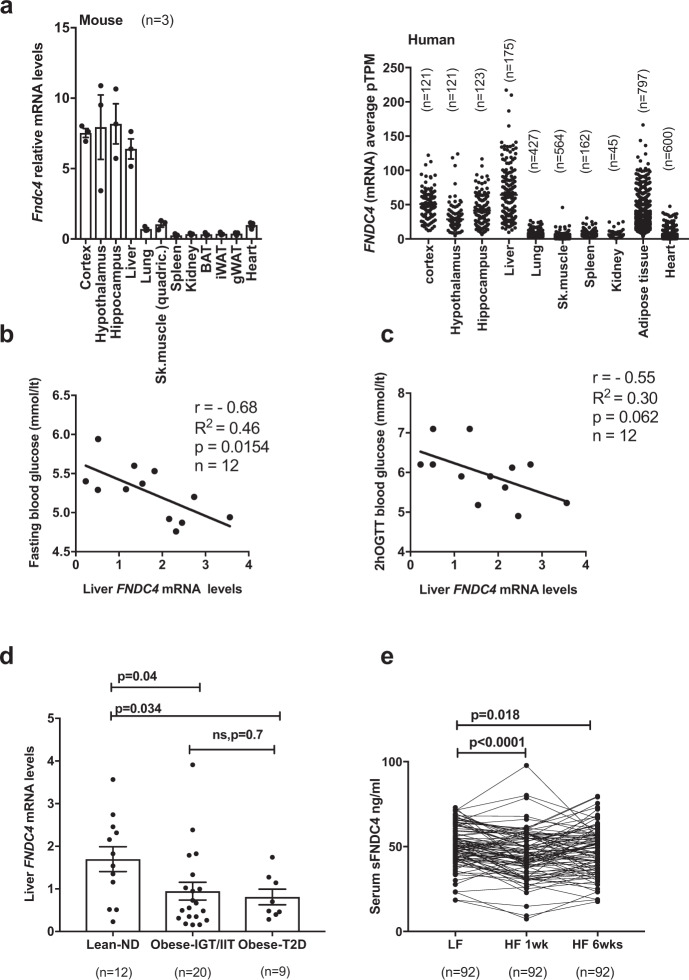
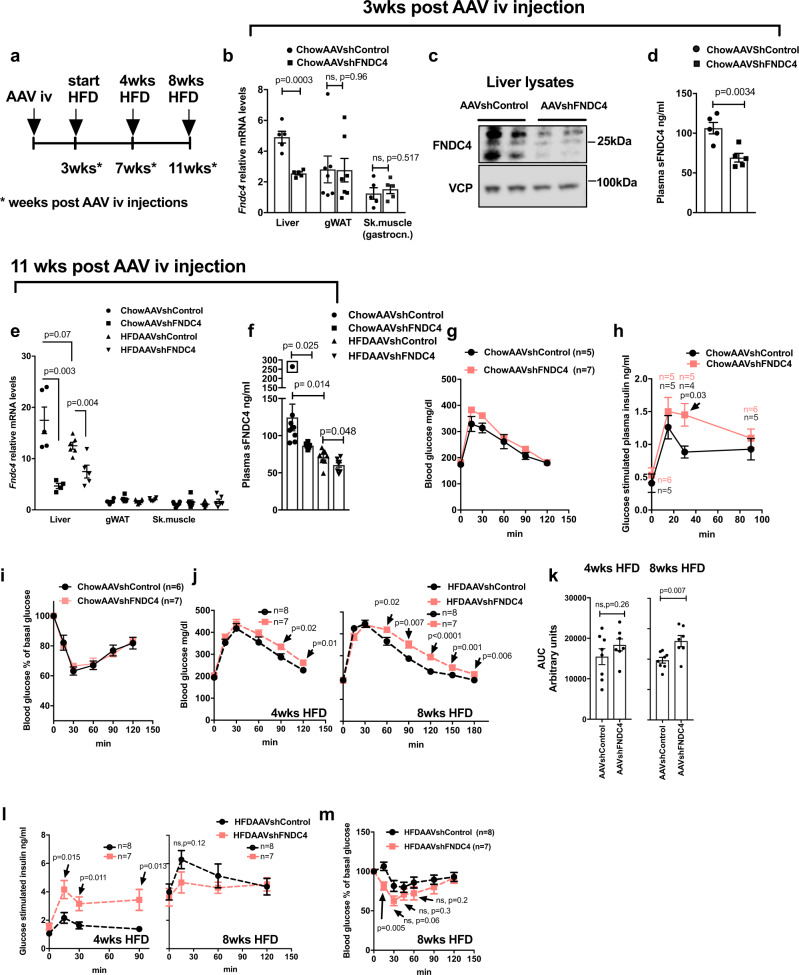
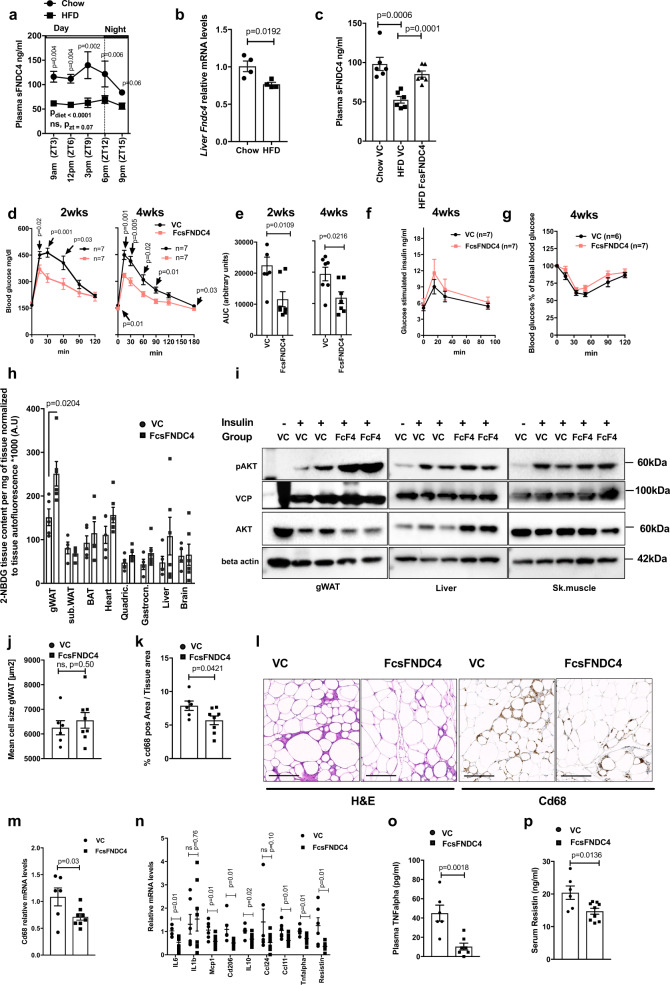
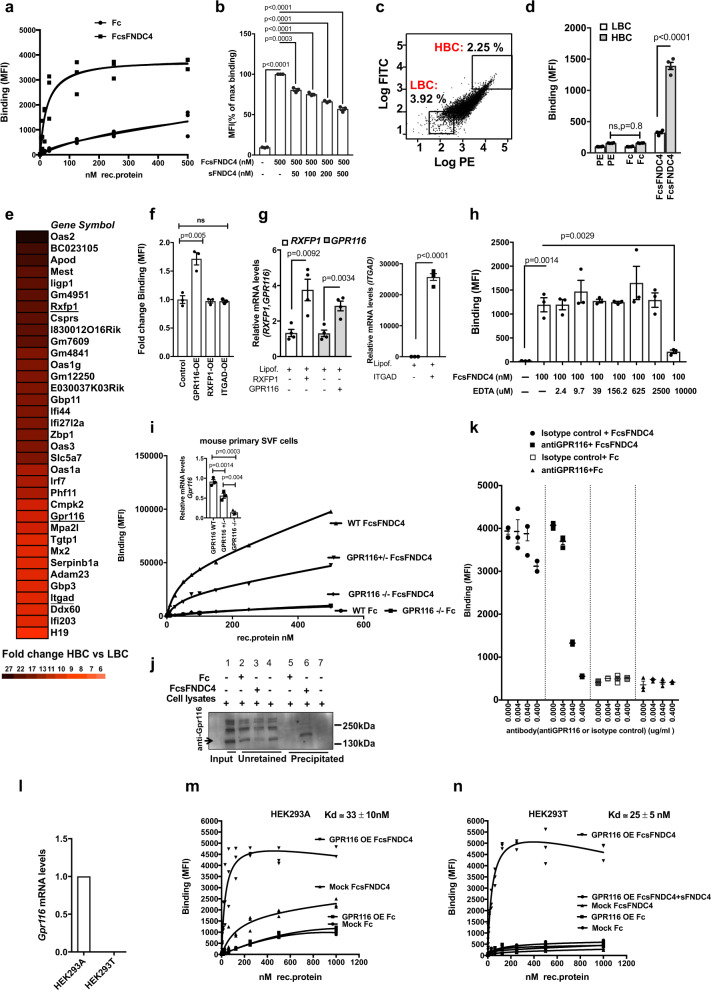
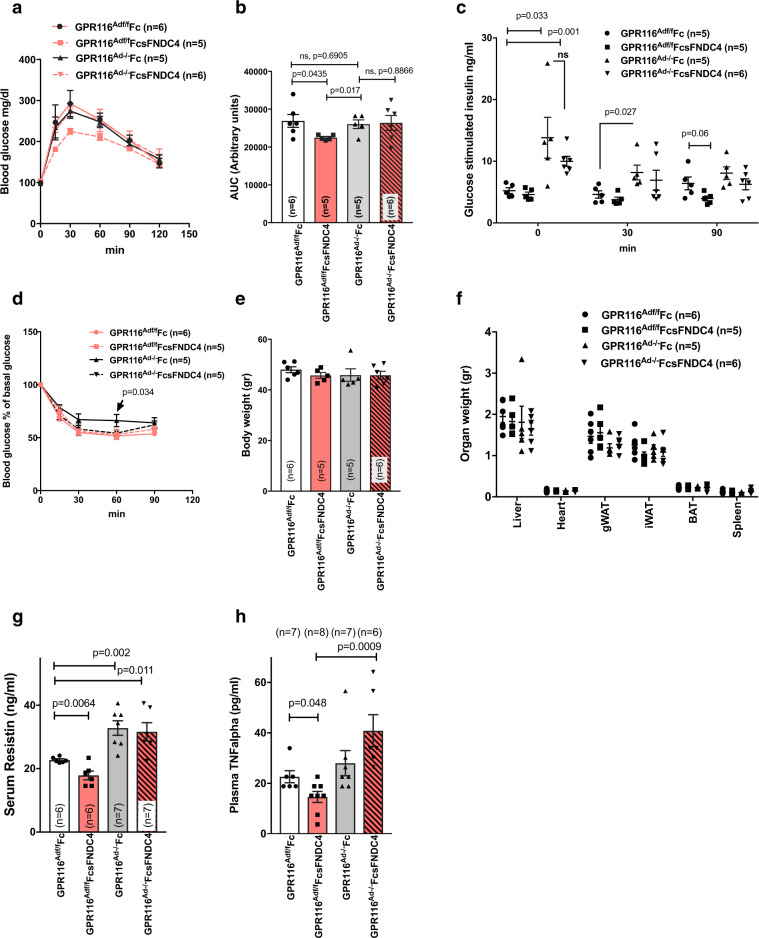
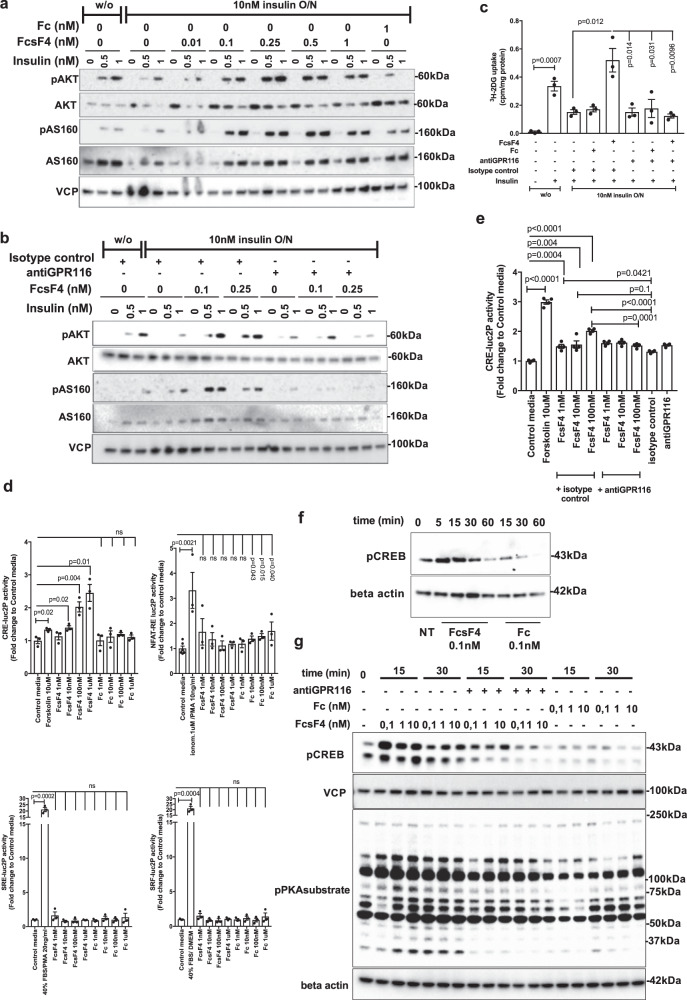
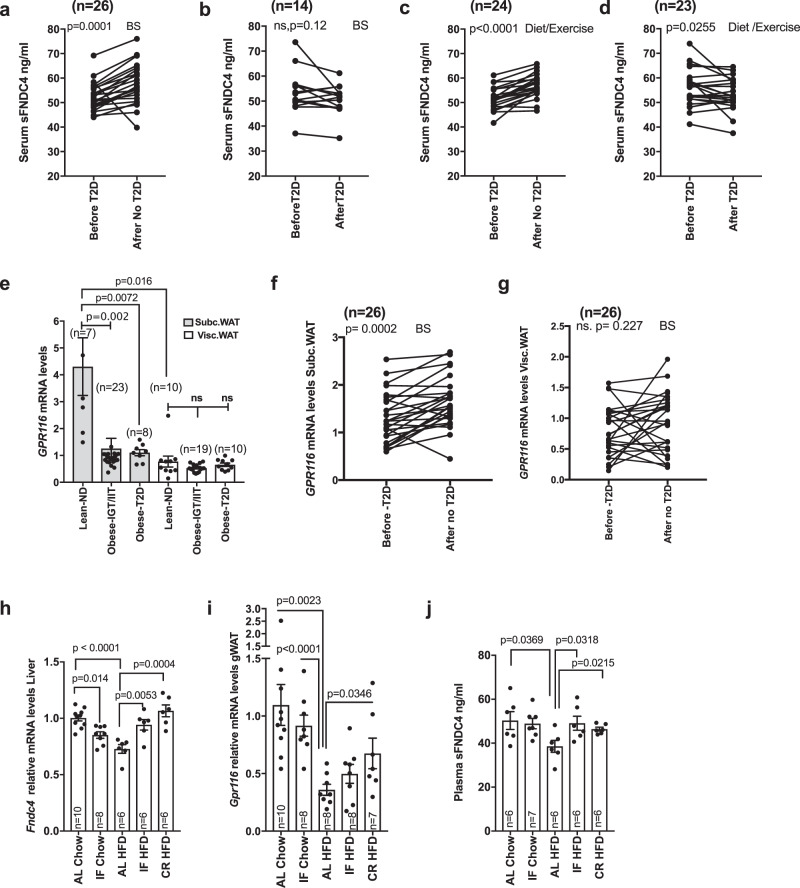
The proper functional interaction between different tissues represents a key component in systemic metabolic control. Indeed, disruption of endocrine inter-tissue communication is a hallmark of severe metabolic dysfunction in obesity and diabetes. Here, we show that the FNDC4-GPR116, liver-white adipose tissue endocrine axis controls glucose homeostasis. We found that the liver primarily controlled the circulating levels of soluble FNDC4 (sFNDC4) and lowering of the hepatokine FNDC4 led to prediabetes in mice. Further, we identified the orphan adhesion GPCR GPR116 as a receptor of sFNDC4 in the white adipose tissue. Upon direct and high affinity binding of sFNDC4 to GPR116, sFNDC4 promoted insulin signaling and insulin-mediated glucose uptake in white adipocytes. Indeed, supplementation with FcsFNDC4 in prediabetic mice improved glucose tolerance and inflammatory markers in a white-adipocyte selective and GPR116-dependent manner. Of note, the sFNDC4-GPR116, liver-adipose tissue axis was dampened in (pre) diabetic human patients. Thus our findings will now allow for harnessing this endocrine circuit for alternative therapeutic strategies in obesity-related pre-diabetes.


Conflict of interest statement

The authors declare no competing interests.

Figures

Fig. 1
Fig. 1. Liver and serum FNDC4 levels positively associate with glucose tolerance in humans.
a RT-qPCR quantification of mRNA levels of the mouse (left panel, n = 3 mice per tissue, male, C57Bl6N, 7–8 weeks old, skeletal muscle is quadriceps) and the human Fndc4 gene in the indicated tissues (right panel, n are shown on the figure and represent independent humans). Left panel: 2ddCt values are shown, which are expressed relative to Fndc4 mRNA levels for the Sk.muscle group. Tbp is used as a housekeeping gene. Right panel: The human data were retrieved from the Protein Atlas Project database (URL: http://www.proteinatlas.org/search/Fndc4) and represent pTMP (read counts normalized to transcripts per million coding genes). Exact values are provided in the Source Data. Pearson’s correlation for human liver FNDC4 mRNA levels and fasting blood glucose levels (mmol/l) (b) and c blood glucose levels (mmol/l) 2 h post oral glucose tolerance test (OGTT) (n = 12 independent humans). d RT-qPCR quantification of human liver FNDC4 mRNA levels at the indicated groups. ND non-diabetic, T2D type 2 diabetes, Obese-IGT/IIT impaired glucose tolerance/impaired insulin tolerance (“Methods: Cross-sectional study—Leipzig”) (n represents independent humans and exact numbers per group are shown on the figure). Statistics represent unpaired two-tailed t test. mRNA levels are provided as mRNA quantity (calculated based on the standard curve method). e Serum levels of sFNDC4 ng/ml in paired blood samples from humans, who initially consumed a low-fat (LF) diet for 6 weeks and subsequently were given a high fat (HF) diet for 6 weeks (“Methods: NUGAT study-DIfE”). Serum was collected at the end of the LF diet period (LF) and at 1 week (HF 1 week) and 6 weeks (HF 6 weeks) of HFD diet (paired samples), n = 92 independent humans. Statistics represent paired, two-tailed t test. Data shown are mean ± SEM.p p-value, ns non-significant. Source data are provided as a Source data file.
Fig. 2
Fig. 2. Mice with hepatic deletion of FNDC4 exhibited decreased circulating levels of sFNDC4 and developed a pre-diabetes phenotype.
a Schematic representation of the study protocol. b RT-qPCR quantification of Fndc4 mRNA at the indicated tissues (n = 5 mice per group for the liver and skeletal muscle (gastrocnemius) and n = 7 mice per group for gonadal white adipose tissue (gWAT). c Western blot against FNDC4 protein in the liver and VCP as loading control (n = 2 mice per group are shown). Results on additional mice and uncropped blots are shown in Source data. d ELISA quantification of plasma (trunk blood) sFNDC4 (n = 5 mice per group), 3 weeks post intravenous (iv) injection of AAVs. e RT-qPCR quantification of Fndc4 mRNA at the indicated tissues (n = 5 mice for Liver ChowAAVshControl, Liver HFDAAVShFNDC4, n = 4 mice for Liver ChowAAVshFNDC4, and n = 6 mice for Liver HFDAAVshControl, gWAT ChowAAVshControl, gWATChowAAVshFNDC4, gWAT HFDAAVshControl, gWAT HFDAAVshFNDC4, Sk.muscle ChowAAVshControl, Sk.muscle ChowAAVshFNDC4, Sk.muscle HFDAAVshControl, Sk.muscle HFDAAVshFNDC4). Skeletal muscle is gastrocnemius. For b, e, 2^ddCt values are shown, which are expressed relative to the Sk.muscle group. Hprt is used as a housekeeping gene for liver and gWAT and H3f3 is used as a housekeeping gene for Sk.muscle. f ELISA quantification of plasma (trunk blood) sFNDC4 (n = 8 mice ChowAAVshControl, n = 6 mice ChowAAVshFNDC4, n = 7 mice HFDAAVshControl, n = 8 mice HFDAAVshFNDC4) 11 weeks post iv injection of AAVs and 8 weeks on HFD or chow control diet. Statistics represent unpaired two-tailed t test. Data point in square was not taken into account for the statistics, due to very high levels of sFNDC4 compared to the rest of the mice in the group (outlier). Glucose homeostasis in chow and HFD fed mice: g blood glucose and h plasma insulin levels during an IPGTT. i blood glucose levels during an ITT on chow-fed mice. j Blood glucose levels, k area under the curve (refers to j), and l plasma insulin during an IPGTT on HFD-fed mice (weeks on HFD as shown on graph). m Blood glucose levels during an ITT on HFD-fed mice. In g, h, j, m, n = independent mice and the exact number of mice is shown on the figure. Male, C57BL6N mice were put on HFD when 10–11 weeks old and compared with age-matched chow fed mice. HFD contained 45% fat. During IPGTT and glucose-induced insulin test, 2 g/kg d-glucose was injected (ip) and during ITT 0.8 U/kg insulin was used (ip). p p-value, ns non-significant. Data shown are mean ± SEM. Statistics in b, df, h, jm represent an unpaired, two-tailed Student’s t test. Source data are provided as a Source data file.
Fig. 3
Fig. 3. Every second day, injections of rec. FcsFNDC4 0.2 mg/kg improved glucose tolerance and increased glucose uptake specifically in the white adipose tissue.
a Plasma (trunk) sFNDC4 in mice on 16 weeks HFD (n = 4 independent mice per time point) and Chow control mice (n = 2–4 independent mice per time point). Statistics represent a regular two-way ANOVA for diet (Pdiet) and time (Pzt). Multiple comparisons for diet effect were performed according to Holm–Sidak’s test and exact p values are shown for chow–HFD diet comparison for each time point. b RT-qPCR quantification of liver Fndc4 mRNA at 16 weeks HFD and Chow mice (n = 4 mice per group). c Plasma (trunk) sFNDC4 ng/ml from chow and 14 weeks HFD, 48 h after a single ip injection of FcsFNDC4 (0.2 mg/kg) or VC (n = 6 mice per group for Chow VS and HFD VC, n =7 mice per goup for HFD FcsFNDC4). d Blood glucose during IPGTT test, e area under the curve (AUC), f glucose-stimulated insulin response (during the IPGTT) in d, e (df n = 7 mice per group), and g percentage of blood glucose levels during an ITT using 0.8 U/kg insulin ip, (VC—n = 6 mice, FcsFNDC4—n = 7 mice) on HFD, 2 and 4 weeks injected with VC or FcsFNDC4. h Quantification of 2-NBDG glucose content at shown tissues, 35 min after ip 2-NBDG injection (n = 4–6 mice per group, exact numbers per group are provided in Source data). i Western blot of pAKT(Ser473) and total AKT at the indicated tissues, after an acute injection of insulin. pAKT and AKT were run on different blots, with VCP and beta actin as loading controls, respectively. This experiment was performed once under the exact same conditions. j Mean cell size of adipocytes and k percentage of Cd68-positive area of gWAT (j, k VC—n = 6 mice, FcsFNDC4—n = 8 mice). l Representative images (out of 20 images per mouse, VC—n = 6 mice, FcsFNDC4—n = 8 mice) for hematoxylin and eosin (H&E) and anti-Cd68 staining of gWAT. Scale bar = 200 µm. m, n RT-qPCR quantification of mRNA levels of the presented genes in gWAT (VC—n = 6 mice and FcsFNDC4—n = 8 mice). Data shown represent 2^ddCt values. H3f3 was used as a housekeeping gene. ELISA quantification of o plasma TNFalpha (VC—n = 6 mice and FcsFNDC4-—n = 7 mice) and p serum resistin (VC—n = 6 mice and FcsFNDC4—n = 9 mice). For hp HFD mice, 4 weeks injected with VC or FcsFNDC4 are shown. HFD contained 60% fat and it was initiated at 7–8 weeks of age. Mice were males, C57BL6N. Data shown are mean ± SEM. Statistics are unpaired, two-sided t test. p p-value, ns non-significant. Source data are provided as a Source data file.
Fig. 4
Fig. 4. Identification of GPR116 as a candidate receptor for sFNDC4.
a Saturation binding curves of FcsFNDC4 and Fc control to immortalized SVF (imm.SVF) preadipocytes derived from mouse iWAT. Y-axis shows ligand binding as mean fluorescence intensity (MFI) per 10,000 cells. Three replicate wells are shown per concentration of rec. protein. This experiment was repeated at least three times. b Competition of FcsFNDC4 binding (500 nM) with increasing concentrations of untagged sFNDC4. Data are expressed as percentage of max binding of 500 nM FcsFNDC4 (n = 3 independent experiments). Bars represent mean of three independent experiments ±SEM. c Gating of sorted cell populations of imm. SVF iWAT to very high log.PE/log.FITC signal (top 2.25% from total cell population = HBC-high binding cells) versus very low log.PE/log.FITC signal (bottom 3.92% from total cell population = LBC-low binding cells), positive for FcsFNDC4 binding (100 nM). This sorting was performed 20 times. d Binding of FcsFNDC4 (20 nM) and Fc control (20 nM) or only IgG-PE (PE) secondary in cells sorted from c after resorting and reseeding for 20 passages. Bars correspond to binding shown as MIF per 10,000 cells. This experiment was performed several times (20 times) up to passage 20 (n = 4 replicate wells). e Fold change mRNA expression data presented as a heat map. Top 35 genes identified with fold change HBC versus LBC >1.5 and p < 0.05 from Affymetrix gene expression arrays comparing LBC and HBC. Receptor genes are underlined. Color scale of fold change values is shown below the heat map. The means of three replicate wells per group (LBC and HBC) are compared. Absolute values and fold change calculations are presented in the Source data. The Affymetrix microarray data have been submitted to GEO (gene expression omnibus) under the identification GSE165329. Affymetrix arrays were performed once. f Fold change of binding (MFI) per 10,000 cells of FcsFNDC4 (100 nM) to HEK293A cells with transient overexpression of human RXFP1 or human GPR116 or human ITGAD. Binding to a mock transfection control (lipofectamine only) was used as control. n = 3 replicate wells of a representative experiment out of two independent experiments is shown. g (left and right panel) RT-qPCR quantification of the indicated genes at the indicated conditions. n = 4 replicate wells per condition are shown. This analysis was performed only once. TBP is used as a housekeeping gene. 2^ddCt values are shown. h Competition of FcsFNDC4 (100 nM) binding with increasing concentrations of EDTA (0–103 µM). Values are binding shown as MFI per 10,000 cells. n = 3 replicate wells of a representative experiment out of two independent experiments is shown. Cells are primary mouse SVF preadipocytes (iWAT). i Binding (MFI) of the indicated concentrations of FcsFNDC4 or Fc control to mouse SVF preadipocytes (iWAT) from WT, GPR116+/−, and GPR116−/− mice. n = 1 replicate well of cells pooled from n = 7–8 mice per genotype per tested concentration of rec. protein. This experiment was performed once. Mice were male, 7–9 weeks old. (i—top panel) RT-qPCR quantification of mRNA levels of Gpr116 in SVF iWAT preadipocytes used for binding in i at the indicated genotypes (n = 3 independent mice per genotype). Tbp is used as a housekeeping gene. j Pull down for GPR116: western blot analysis against GPR116. For pull down, 6xHis Dynabeads were prebound with 6xHis-Fc and 6xHis-Fc-sFNDC4 (30 µg), followed by incubation of 300 µg NIH3T3 cell lysates. (+) added to beads, (−) not added to beads, Input: rec. protein or cell lysates added to the Dynabeads. Unretained: cell lysates proteins that did not immunoprecipitate to the beads. Eluted: elution of GPR116, which precipitated on 6xHis-Fc-fused protein prebound to beads. Similar results were obtained from three independent experiments. Antibody against GPR116: ab136262. Representative WB out of three independent experiments is shown. Uncropped blot image is shown in Source data. k Mean fluorescence intensity (MFI) representing binding of FcsFNDC4 (100 nM) or Fc control (100 nM) to HEK293T GPR116 (human) OE cells in the presence of the indicated dose of antiGPR116 antibody, against the N-terminus of GPR116 (ab111169) or isotype control (ab171870). This experiment was performed once with n = 3 technical replicates. l q-PCR quantification of human Gpr116 mRNA levels in HEK293A (Ct = 25) and HEK293T (Ct = undetected) cells, n = 3 replicate wells per group. This quantification was performed once. m, n Saturation binding on HEK293A (m) or HEK293T (n) cells with stable human GPR116 OE or mock cells after incubation with the indicated concentrations of FcsFNDC4 or Fc control. For n, FcsFNDC4 binding was also performed in excess of sFNDC4 (1 mM) to determine non-specific binding (NSB). Calculated equilibrium binding constant (Kd) is shown for total binding in m and specific binding in n. In m, n, n = 3 replicate wells are shown of a representative experiments out of three independent experiments. In b, d, fi (top panel), k, data are shown as mean ± SEM. Statistical analysis in b, d, fi (top panel) represents unpaired two-tailed t test. For a, b, f, h, i, k, m, n, a representative gating is shown in Supplementary Fig. 1a. All cells were gated and thus MFI values were derived always from all assessed cells. Source data are provided as a Source data file.
Fig. 5
Fig. 5. HFD fed GPR116Ad−/− mice did not improve glucose tolerance in response to FcsFNDC4 therapeutic injections as opposed to GPR116Adf/f mice.
a Blood glucose during IPGTT test at the indicated time points and area under the curve (b). c Glucose-stimulated insulin response during the IPGTT in a, b. d Blood glucose as percentage of baseline glucose levels during an ITT. e Body weight, f organ weight, g serum resistin, and h plasma TNFalpha at the indicated groups. White bars: GPR116Adf/f Fc-injected mice, red bars: GPR116Adf/f FcsFNDC4-injected mice, grey bars GPR116Ad−/− Fc-injected mice, red bars/pattern: GPR116Ad−/− FcsFNDC4-injected. Mice were males, set on a HFD 60% fat when 9–10 weeks old, for 12 weeks. FcsFNDC4 injections were given at a dose of 0.2 mg/kg every second day for 4 weeks (injections between weeks 8 and 12 of HFD), n = 6–8 mice per group. Exact number of mice are shown on figures and also described in the Source data. During IPGTT and glucose-induced insulin test, 2 g/kg d-glucose was injected and during the ITT 0.8 U/kg insulin was used ip. In all panels, data are presented as mean ± SEM. Statistics represent unpaired two-tailed t test. p p-value, ns non-significant. Source data are provided as a Source data file.
Fig. 6
Fig. 6. sFNDC4 insulin-sensitizing effects in 3T3L1 adipocytes require interaction with GPR116 and involve Gs-cAMP signaling.
a WB of the indicated proteins: overnight incubation (O/N—16 h) of 3T3L1 adipocytes with FcsFNDC4 (FcsF4) or Fc with 10 nM of insulin or without insulin (w/o). Following O/N incubations, the cells were serum starved for 3 h. After that, cells were stimulated with insulin at the indicated concentrations (0, 0.5, 1 nM) for 5 min. b WB of the indicated proteins: 3T3L1 adipocytes were treated overnight with insulin (10 nM) or w/o and FcsFNDC4 or Fc in the presence of antiGPR116 (ab111169) (0.4 µg/ml) or isotype control (0.4 µg/ml). Prior acute insulin stimulation for 5 min, cells were incubated in serum-free media (SFM) for 3 h. For a, b, this experiment was performed at least two times and experiment repeats are shown in Supplementary Fig. 5 and quantification of blots in Supplementary Fig. 6. c Tritium-labeled glucose uptake at the indicated conditions. Cells were treated as in b and, after serum starvation, were stimulated with 1 nM insulin for 20 min and glucose transport was initiated by the addition of  3H-2DG (PerkinElmer Life Sciences) (0.25 μCi/well, 50 μM unlabeled 2-deoxyglucose) for 5 min, when the experiment was terminated. n = 3 replicate wells of a representative experiment out of two experiments is shown. d, e Stimulation of 3T3L1 adipocytes luciferase reporter stable cells lines with the indicated concentrations of stimuli. Stimulation was 3–4 h for the CRE-, SRE-, and SRF-luc2P cell lines and 16 h for the NFAT-RE luc2P cell line. For e, antiGPR116 (ab111169) 0.4 μg/ml was added 30 min prior the addition of the rec. proteins then media was removed and replaced with media containing the indicated concentrations of rec. proteins. In d, n = 3 replicate wells and NFAT control n = 6 replicate wells of a representative experiment out of at least 3 independent experiments is shown. In e, n = 4 independent experiments. f WB: 3T3L1 adipocytes and g WB: adipocytes derived from mouse primary SVF cells were incubated in SFM for 3 h and then stimulated in SMF with the indicated dose of rec. protein or antiGPR116 antibody 0.4 μg/ml for g and for the indicated duration of incubation (min). For d, f, g, at least three independent experiments were performed. In d, e, phosphodiesterase (PDE) inhibitor, IBMX (0,5 mM), was present in the media during the treatment of Cre2LucP adipocytes, whereas in f, g no phosphodiesterase (PDE) inhibitors were present. In ce, bars are mean ± SEM and statistics represents Student’s unpaired two-tailed t test. p p-value, ns non-significant, NT non-treated. Phospho-antibodies: pAKTSer473, pCREBSer133, pAS160Thr642. Source data are provided as a Source data file.
Fig. 7
Fig. 7. FNDC4–GPR116 axis response to anti-diabetic interventions in humans and mice positively correlates with improvements in insulin sensitivity after the intervention.
Quantification of serum sFNDC4 protein in paired samples of individuals who underwent weight loss intervention by bariatric surgery (BS) a (n = 26 humans), b (n = 14 humans), or c (n = 24 humans), d (n = 23 humans) diet and exercise. Statistics represent paired two-tailed t test. eg RT-qPCR quantification of GPR116 mRNA at the indicated groups. ND non-diabetic, T2D type 2 diabetes, Obese-IGT/IIT: impaired glucose tolerance/insulin tolerance (cross-sectional study Leipzig), BS bariatric surgery. n = human and the number of individuals is indicated on the graphs. For e, an unpaired two-tailed t test was used. For f, g, a paired two-tailed t test was used. h, i RT-qPCR quantification of Fndc4 and Gpr116 at the indicated tissues in mice ad libitum (AL), intermittent fasting (IF), or chow and HFD (45% fat) diet and caloric restriction (CR) upon HFD (45% fat). j Quantification of plasma sFNDC4 ng/ml at the indicated groups. Blood was collected from the central vein after decapitation (trunk). For hj, n = mice and the exact number of mice per group is shown on the graphs. Statistics represent an unpaired two-tailed t test. In e, hj, bars represent mean ± SEM. ad and f, g: subjects’ information are shown in Supplementary Table 2. For subjects’ information related to e, see Supplementary Table 1. Source data are provided as a Source data file.

References

    1. Barry, E. et al. Efficacy and effectiveness of screen and treat policies in prevention of type 2 diabetes: systematic review and meta-analysis of screening tests and interventions. BMJ356, i6538 (2017). - PubMed
    1. Fonseca VA. Defining and characterizing the progression of type 2 diabetes. Diabetes Care. 2009;32:S151–S156. doi: 10.2337/dc09-S301. - DOI - PMC - PubMed
    1. Meex RCR, Watt MJ. Hepatokines: linking nonalcoholic fatty liver disease and insulin resistance. Nat. Rev. Endocrinol. 2017;13:509–520. doi: 10.1038/nrendo.2017.56. - DOI - PubMed
    1. Bosma, M. et al. FNDC4 acts as an anti-inflammatory factor on macrophages and improves colitis in mice. Nat. Commun. 7, 11314 (2016). - PMC - PubMed
    1. Lv, Z. et al. FNDC4 inhibits RANKL-induced osteoclast formation by suppressing NF-κB activation and CXCL10 expression. Biomed. Res. Int. 2018, 3936257 (2018). - PMC - PubMed

Publication types

MeSH terms